Photocatalytic reduction of Cr(VI) by polyoxometalates/TiO2 electrospun nanofiber composites

Duoying Zhanga, Xu Lia, Huaqiao Tanb, Guoqiang Zhangbc, Zhao Zhaobc, Hongfei Shib, Lingtong Zhangb, Weixing Yub and Zaicheng Sun*b
aDepartment of Elelctronic Engineering, Jinan University, Guangzhou, 510632, P. R. China
bState Key Laboratory of Luminescence and Applications, Changchun Institute of Optics, Fine Mechanics and Physics, 3888 East Nanhu Road, Changchun 130033, P. R. China. E-mail: sunzc@ciomp.ac.cn; Tel: +86-431-86176349
cUniversity of Chinese Academy of Sciences, Beijing 100000, P. R. China

Received 20th August 2014 , Accepted 10th September 2014

First published on 10th September 2014


Abstract

Polyoxometalates (Ti0.75PW12O40, Ti-PTA)/TiO2 nanofiber composites were fabricated by a simple electrospinning technique and then high temperature calcination. In the structure, Ti-PTA, as an electron relay, can accept the photo-generated electrons from the conduction band of TiO2, which promote the separation of photo-generated charges in TiO2. Then the electrons stored on Ti-PTA further transfer to the Cr(VI) in the solution to realize the removal of Cr(VI). The Ti-PTA/TiO2 nanofiber composites exhibit enhanced photocatalytic performance for photocatalytic reduction of Cr(VI), which might be a potential photocatalyst for Cr(VI) removal in environmental therapy.

Introduction

Chromium is a common water contaminant because of wide applications in metallurgy, staining glass, anodizing aluminum, organic synthesis, leather tanning and wood preservation industries. Cr(VI) affects human physiology, accumulates in the food chain and causes severe health problems ranging from simple skin irritation to lung carcinoma. Its concentration in water is necessarily restricted to be less than 0.05 ppm by the environmental quality standards for water pollution control.1,2 Contrarily Cr(III) is low toxic and an essential human nutrient, which does not readily migrate in groundwater since it usually precipitates as hydroxides, oxides, or oxyhydroxides. It is also quite soluble in aqueous phase over almost the entire pH range, thus it is quite mobile in the natural environment. In a word, Cr(VI) is more toxic than Cr(III). Therefore, reduction of Cr(VI) to Cr(III) is beneficial for the environment and is a feasible method for removal of Cr(VI).2,3

Cr(VI) is a strong oxidant and therefore can be reduced in the presence of electron donors. In the recent years, photocatalytic removal of toxic substance in aqueous suspension of semiconductor has received considerable attention in view of solar energy conversion.3–8 This photocatalysis was achieved for rapid and efficient destruction of environmental pollutants. Among of all the semiconductors, TiO2 exhibits excellent photocatalytic activity due to its good chemical and biological stability, low cost and toxicity.9,10 Thus, photocatalytic reduction of Cr(VI) over TiO2 catalysts was extensively investigated including morphologies,5,11 organic sacrificial agent,12,13 and modified TiO2.14,15 However, low photocatalytic efficiency limits TiO2 photocatalyst's practical application due to high electron–hole recombination rate result in low quantum efficiencies.16 Many studies have been carried out to promote the charge separation process, such as noble metal,16–18 oxygen vacancy,11,19,20 mixed phase junction21,22 and heterojuction.23,24

Spatially separation of the photogenerated charge carriers is a feasible approach for enhancing the photocatalytic performance. Employing an electron scavenger to accept the electron from the conduction band of TiO2 is an effective way to restrain electron–hole recombination. Polyoxometalates (POMs) are good multielectron acceptors and show satisfactory photoactivity in homogeneous systems. However, it is hard to remove from homogeneous system after treatment, which results in a secondary pollution. Loading POMs onto catalyst carrier is a prefer way to solve this problem. For POMs–TiO2 composites, POMs easily accept photogenerated electron from TiO2 conduction band and electrons are temporarily stored in the form of reduced POMs and later the collected electron can be transfer to adsorbed substance. The POMs, such as PW12O403−, SiW12O404−, facilitate the transfer of photogenerated TiO2 electron to dioxygen as a means of increasing the efficiency of the photo-degradation of 1,2-dichlorobenzene and dye molecules.25,26 Although there are a few reports on the high efficiency photo-degradation of organic waste,27 the metal ions waste removal by POMs–TiO2 composites is rarely reported.28 Generally, loading POMs on the TiO2 by physical adsorption, resulting that POMs may desorb from the supporting materials. On the other hand, the limited amount POMs can be loaded on the supporting materials such as TiO2. Electrospinning technique is a robust method to fabricate the nanofibers composites, whose composition can be simply tuned via the feed materials ratio.

Herein, we fabricated POMs–TiO2 nanofibers composites through simple and facile electrospinning technique. H3PW12O40 (PTA) was mixed with titania sol–gel precursor and polyvinylpyrrolidone (PVP). The electrospun nanofibers were thermal treated at 400–600 °C to remove the polymer and transfer TiO2 from amorphous to anatase phase. The results Ti0.75PW12O40 (Ti-PTA)/TiO2 nanofiber composites exhibit enhanced photocatalytic activity of Cr(VI) reduction at optimum POMs amount and thermal treatment temperature. Based on the above results, we proposed a possible reaction mechanism – heterojunction of Ti-PTA/TiO2. POMs accepted the photogenerated electron from TiO2 conduction band and further reduced the Cr(VI) ion adsorbed on the Ti-PTA/TiO2.

Experimental

Materials

Tetrabutyltitanate (TBT), phosphotungstic acid (H3PTA), potassium dichromate were purchased from Aladdin Reagent Inc. Polyvinylpyrrolidone (PVP, Mw 1[thin space (1/6-em)]300[thin space (1/6-em)]000) was obtained from Alfa Aesar Inc. All chemicals were used without any further purification.

Solution preparation

0.7 g of PVP was dissolved into 15 mL isopropanol (IPA) till to form clear solution. Then 0.2 mL acetic acid was added into PVP solution. After stirring for 1 hour, about 0.5 mL TBT was added into PVP solution and stir over 1 hour for hydrolysis of TBT. Finally, designed amount PTA (5–30 mol% relative to TBT) was added into above solution and stir till to completely dissolved.

Electrospinning conditions

The above solution was loaded into 10 mL syringe connected with a 22 gauges blunt needle. PVP/TiO2/PTA fibers were collected on the alumina foil. The syringe was set up with a tip-to-collector distance of 15 cm. The solution feed rate was set 0.5 mL h−1 and 15 kV was applied to the needle and collector. The collected fibers were thermal treated at 400–600 °C for 5 hours to remove PVP.

Characterization

The morphology of the fibers was observed with a scanning electron microscopy on a JEOL JSM 4800F and transmission electron microscopy (TEM, FEI Tecnai G2 operated at 200 kV). The crystalline structure was recorded by using an X-ray diffractometer (XRD) (Bruker AXS D8 Focus), using Cu Kα radiation (λ = 1.54056 Å). The UV-vis absorption spectra were measured on a Shimadzu UV 2600 UV-vis spectrophotometer. X-ray photoelectron spectrum (XPS) analyses were performed on an ESCALABMKII spectrometer with an Al-Kα (1486.6 eV) achromatic X-ray source.

Photocatalytic reduction of Cr(VI)

The photocatalytic activity of the samples was evaluated through the reduction of K2Cr2O7 in aqueous solution and isopropanol under a 300 W high voltage UV light mercury lamp at a 20 cm distance. The experiments were performed at 25 °C as follows: 20 mg of Ti-PTA/TiO2 nanofiber composites was added into 20 mL of K2Cr2O7 solution (160 ppm) and 20 mL isopropanol. Before irradiation, photocatalysts were not submitted to any previous treatment and then were dispersed in K2Cr2O7 solution under magnetic stirring for 30 min and covered from any source of light to assure that the adsorption–desorption equilibrium between the TiO2 catalyst and K2Cr2O7 was reached. Then the solution was stirred and exposed to the UV light irradiation. After irradiation for a designated time, aliquots were taken from the irradiated reaction flask and submitted to centrifugation to separate Ti-PTA/TiO2 composites. The K2Cr2O7 concentration was monitored by the absorbance value at the maximum peak (365 nm) using a Shimadzu UV-2600 spectrometer.

Results and discussion

Electrospinning is a simple and facile technique for fabrication of nanofibers, which are about 200 nm in diameter. Generally, TiO2 sol–gel precursor was added into PVP solution to form TiO2–PVP composites, which is electrospun into fibers. The TiO2 also assumes the shape of nanofibers is maintained after removing PVP via high temperature sintering process. To obtain uniform Ti-PTA/TiO2 nanofiber composites, H3PTA was added PVP and TiO2 sol–gel precursor mixed solution to form a homogeneous solution. Fig. 1A and B display the morphology of as-spun PVP/PTA/TiO2 nanofibers at the optimum electrospinning conditions. The fibers show quite good uniformity with 188 ± 36 nm in diameter. The Ti-PTA/TiO2 nanofiber composites have lower fiber diameters (87 ± 15 nm) than as-spun PVP/PTA/TiO2 nanofibers because of the degradation of PVP during the sintering process (Fig. 1C and D). Transmission electron microscopy (TEM) image of a single PTA-TiO2 nanofiber is shown in Fig. 1E. It discloses that the nanofiber is actually made of small nanoparticles with ∼15 nm in diameter. Some dark nanoparticles are observed on the fiber, which may relate to Ti-PTA in the fiber due to tungsten existence. Fig. 1F shows high resolution TEM (HR TEM) and fast Fourier transform (FFT) images corresponding to the different area. The HR TEM indicates the anatase phase of TiO2 and the lattice fringes correspond to 0.35 nm. In the dash rectangle region, the FFT pattern shows two symmetry dots which is consistence with the TEM image. The solid rectangle region shows different lattice fringe and FFT pattern, which is believed to correspond to the Ti-PTA nanoparticles.
image file: c4ra08934k-f1.tif
Fig. 1 Scanning electron microscopy (SEM) images of PVP/PTA/TiO2 (A and B) and Ti-PTA/TiO2 (C and D). Transmission electron microscopy (TEM) photographs of single Ti-PTA/TiO2 nanofiber (E). F is high resolution TEM images of Ti-PTA/TiO2 fibers. The fast Fourier transform images of different region are inserted at right upper corner. The solid line rectangle indicates the Ti-PTA, and dash line rectangle is TiO2.

To further verify the PTA existence in the fiber, energy dispersive analysis of X-rays (EDAX) and X-ray photoelectron spectroscopy (XPS) were employed. Fig. 2A clearly exhibits signal of Ti, W O and P elements in EDAX pattern of TiO2-PTA (10 mol% for W) nanofibers. The intensity of W signal increases with the increasing of adding amount of H3PTA in the original solution (see Fig. S1 in ESI). The W 4f, W 4d, C 1s, W 4p, Ti 2p and O 1s signal are clearly shown in the full scan survey XPS spectrum of Ti-PTA/TiO2 (20%) nanofibers. These results are consistence with the EDAX results. Both EDAX and XPS results confirm that Ti-PTA/TiO2 nanofiber composites form through this simple electrospinning and sintering process.


image file: c4ra08934k-f2.tif
Fig. 2 Energy dispersive X-ray analysis (EDAX, A) and full scan X-ray photoelectron spectroscopy (XPS, B) of Ti-PTA/TiO2 nanofiber composites.

The photocatalytic activity strongly depends on the crystalline phase and the molar ratio of TiO2 and H3PTA. Firstly, the effect of sintering temperature on the crystalline phase was investigated. The Fig. 3A displays XRD pattern of PTA-TiO2 (20 mol% W/Ti) after sintering at different temperature from 450–600 °C. XRD patterns matched with the crystalline anatase phase of TiO2 (JCPDS no. 21-1272). The TiO2 nanoparticles size was calculated to be about 11.7 nm according to the Scherrer equation. The XRD peak at 25.3 turns more and more sharp, indicating the TiO2 nanoparticle size grows up with the increase of sintering temperature. TiO2 nanoparticles size increase from 6.0 nm to 6.4 nm at sintering temperature of 550 °C. When the sample was sintered at 600 °C, a series of new diffraction peaks are observed. These new peaks match with monoclinic phase WO3 (JCPDS no. 43-1035). These results indicate that the PTA transfer into WO3 after high temperature treatment.


image file: c4ra08934k-f3.tif
Fig. 3 Powder X-ray diffraction (XRD) of PVP/PTA-TiO2 nanofibers composites calcined at different temperature (A) and different molar ratio of PTA to TBT (B).

Thus the PTA amount will affect the photocatalytic activity of PTA-TiO2 nanofibers. The XRD pattern of different the molar ratio of TBT and PTA is shown in Fig. 3B. After sintering at 550 °C, the (101) diffraction peak of pure TiO2 nanofibers shows narrower and sharper than Ti-PTA/TiO2 nanofibers. The TiO2 nanoparticle sizes were calculated to be 11.7 nm, 7.3 nm, 6.4 nm and 5.9 nm for pure TiO2, 10, 20 and 30 mol% PTA-TiO2 nanofibers, respectively. These indicate that the addition of PTA depress the TiO2 crystal growth to some degree. In addition, WO3 diffraction peaks are also observed in the PTA-TiO2 30 mol% sample, indicating that PTA may be transferred WO3 at high temperature treatment when the PTA amount is too high.


image file: c4ra08934k-f4.tif
Fig. 4 Photocatalytic reduction of Cr(VI) by Ti-PTA/TiO2 nanofiber composites prepared at (A) different temperature and (B) different feed ratio of PTA to TBT.

Photoreduction of Cr(VI) was carried out to evaluate the photocatalytic activity of Ti-PTA/TiO2 nanofibers (Fig. 4). Because the Ti-PTA/TiO2 nanofiber are mesoporous materials, adsorption of Cr(VI) on the nanofibers were observed in all case before starting the photocatalytic reduction. Under the UV-vis illumination, Cr(VI) ion concentration has a faint decrease. For pure TiO2 nanofibers, about 60% Cr(VI) was reduced into Cr(III) in 60 minutes. However, the Ti-PTA/TiO2 nanofibers thermal treated at 450 °C, the photocatalytic activity is close to the pure TiO2 nanofibers. With the sintering temperature increase to 500 °C, the photocatalytic performance has an obvious improvement. When the sintering temperature increases to 550 °C, the photocatalytic performance reaches the best point. More than 90% Cr(VI) ion can be removed within 50 minutes. However, the photocatalytic activity significantly drops down if the sintering temperature further increases to 600 °C. The reason is that WO3 formed under high temperature thermal treatment results in the low photocatalytic performance. Similar results are observed in the different molar ratio of PTA to TBT sample. The photocatalytic performance increase with the relative amount of PTA, then too high amount PTA results in that PTA easily transfer into WO3 at 550 °C. That leads to that the photocatalytic performance dramatically decreases. Fig. S5 shows the photocatalytic reduction process of Cr2O72− under UV-vis light. There is a characteristic adsorption band of H3PTA at 260 nm. During photocatalytic reduction process, a shoulder peak at 260 nm was observed at the initial stage, indicating that some H3PTA adsorbed on the surface of Ti-PTA/TiO2 nanofibers may be dissolved into the solution. However, the intensity of this peak shows no increase with prolonging the reaction time. That means there is no further PTA release from the Ti-PTA/TiO2 nanofibers. The formation of Ti-PTA effectively prevents the loss of PTA from the Ti-PTA/TiO2 nanofibers composites.

Fig. 5 showed the optical images of Ti-PTA/TiO2 nanofibers composites before and after exposed UV-vis light. Normally, the Ti-PTA/TiO2 display white color powder and turns blue after exposing UV light. That indicates that the anion PTA was reduced and form reduced PTA in the Ti-PTA/TiO2. It could gradually recover when it stores in the ambient environment at room temperature. This process clearly demonstrates that the Ti-PTA works as a redox agent in the Ti-PTA/TiO2 nanofibers composites. As an electron acceptor, it accepts the photo-generated electron from TiO2 and turns into reduce state, and then the reduced Ti-PTA further can be oxidized by Cr(VI) in the solution and back to Ti-PTA.


image file: c4ra08934k-f5.tif
Fig. 5 Optical images of Ti-PTA/TiO2 nanofibers composites before (A) and after (B) exposed UV-vis light.

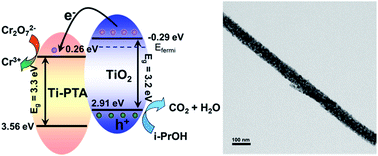
To decide the highest occupied molecular orbital (HOMO) and lowest unoccupied molecular orbital (LUMO) of Ti-PTA, we measured the redox potential of H3PTA via the cyclic voltammetry measurement. The LUMO potential (0.26 eV vs. NHE) could be calculated from the equation as shown in Fig. S5. The optical band gap (3.3 eV) is obtained from the UV-vis spectrum of H3PTA (Fig. S6). On the basis of these results, we infer the LUMO and HOMO of Ti-PTA are 0.26 and 3.56 eV vs. NHE, respectively. As we know, the conduction band (CB) and valence band (VB) of typical anatase TiO2 are −0.29 and 2.91 eV vs. NHE and the Fermi level of TiO2 will locate at ∼0.20 eV below CB.29 Based on the above results and understanding, we believe that the heterojunction between Ti-PTA and TiO2 forms in Ti-PTA/TiO2 nanofibers. In the structure, TiO2 is a matrix, mainly adsorb most of light. Ti-PTA nanoparticles embed into the TiO2 nanofibers. It works as electron relay, accepting photogenerated electron from TiO2 and releasing the electron to Cr(VI). Ti-PTA can be easily reduced by the photo-excited TiO2, thus promote the charge separation of TiO2. The electron can temporary store in the Ti-PTA prevent from recombination of photo-generated electrons and holes. That is the reason that an enhanced photocatalytic performance was observed for the Ti-PTA/TiO2 nanofibers composites. While reduced Ti-PTA can also be oxidized by Cr2O72− then recovers to Ti-PTA. The toxic Cr(VI) could be removed from the solution by this process. On the other side, the photo-generated hole can transfer to the sacrificed agent – alcohol. Fig. 6 shows the whole possible reaction mechanism.


image file: c4ra08934k-f6.tif
Fig. 6 Possible photocatalytic mechanism of PTA-TiO2 nanofiber composites.

Conclusions

In summary, Ti-PTA/TiO2 nanofiber composites were fabricated via a simple electrospinning method. The nanofibers morphology can be reserved after removing the polymer by high temperature sintering process. The heterojunction between Ti-PTA and TiO2 promote the photo-generated electron and hole separation, leading to an improvement of photocatalytic performance. The Cr(VI) removal experiment was designed as to demonstrate the photocatalytic activity of Ti-PTA/TiO2 nanofibers. This nanofibers shows a great photoreduction capability of Cr(VI) ion under UV-vis light illuministration.

Acknowledgements

We acknowledge the financial support from the National Natural Science Foundation of China (no. 21201159, 61176016, and 21104075), the Science and Technology Department of Jilin Province (no. 20121801), “Hundred Talent Program” CAS and open research fund of Key Laboratory of Functional Inorganic Material Chemistry (Heilongjiang University).

Notes and references

  1. P. Miretzky and A. F. Cirelli, J. Hazard. Mater., 2010, 180, 1–19 CrossRef CAS PubMed.
  2. V. Madhavi, A. V. B. Reddy, K. G. Reddy, G. Madhavi and T. N. V. K. V. Prasad, Res. J. Recent Sci., 2013, 2, 71–83 CAS.
  3. L. B. Khalil, W. E. Mourad and M. W. Rophael, Appl. Catal., B, 1998, 17, 267–273 CrossRef CAS.
  4. J. J. Testa, M. A. Grela and M. I. Litter, Environ. Sci. Technol., 2004, 38, 1589–1594 CrossRef CAS.
  5. G. Cappelletti, C. L. Bianchi and S. Ardizzone, Appl. Catal., B, 2008, 78, 193–201 CrossRef CAS PubMed.
  6. E. Gkika, A. Troupis, A. Hiskia and E. Papaconstantinou, Appl. Catal., B, 2006, 62, 28–34 CrossRef CAS PubMed.
  7. H. Jabeen, V. Chandra, S. Jung, J. W. Lee, K. S. Kim and S. B. Kim, Nanoscale, 2011, 3, 3583–3585 RSC.
  8. X. Liu, L. Pan, T. Lv, G. Zhu, Z. Sun and C. Sun, Chem. Commun., 2011, 47, 11984 RSC.
  9. A. L. Linsebigler, G. Lu and J. T. Yates, Chem. Rev., 1995, 95, 735–758 CrossRef CAS.
  10. T. Kawahara, Y. Konishi, H. Tada, N. Tohge, J. Nishii and S. Ito, Angew. Chem., 2002, 114, 2935–2937 CrossRef.
  11. Y. Yang, G. Wang, Q. Deng, D. H. Ng and H. Zhao, ACS Appl. Mater. Interfaces, 2014, 6, 3008–3015 CAS.
  12. L. Wang, N. Wang, L. Zhu, H. Yu and H. Tang, J. Hazard. Mater., 2008, 152, 93–99 CrossRef CAS PubMed.
  13. G. Colon, M. C. Hidalgo and J. A. Navio, Langmuir, 2001, 17, 7174–7177 CrossRef CAS.
  14. L. Yang, Y. Xiao, S. Liu, Y. Li, Q. Cai, S. Luo and G. Zeng, Appl. Catal., B, 2010, 94, 142–149 CrossRef CAS PubMed.
  15. P. Mohapatra, S. K. Samantaray and K. Parida, J. Photochem. Photobiol., A, 2005, 170, 189–194 CrossRef CAS PubMed.
  16. B. Xin, L. Jing, Z. Ren, B. Wang and H. Fu, J. Phys. Chem. B, 2005, 109, 2805–2809 CrossRef CAS PubMed.
  17. S. C. Chan and M. A. Barteau, Langmuir, 2005, 21, 5588–5595 CrossRef CAS PubMed.
  18. Z. Bian, T. Tachikawa, P. Zhang, M. Fujitsuka and T. Majima, J. Am. Chem. Soc., 2014, 136, 458–465 CrossRef CAS PubMed.
  19. T. R. Gordon, M. Cargnello, T. Paik, F. Mangolini, R. T. Weber, P. Fornasiero and C. B. Murray, J. Am. Chem. Soc., 2012, 134, 6751–6761 CrossRef CAS PubMed.
  20. F. Zuo, L. Wang, T. Wu, Z. Zhang, D. Borchardt and P. Feng, J. Am. Chem. Soc., 2010, 132, 11856–11857 CrossRef CAS PubMed.
  21. D. C. Hurum, A. G. Agrios, K. A. Gray, T. Rajh and M. C. Thurnauer, J. Phys. Chem. B, 2003, 107, 4545–4549 CrossRef CAS.
  22. J. Zhang, Q. Xu, Z. Feng, M. Li and C. Li, Angew. Chem., Int. Ed., 2008, 47, 1766–1769 CrossRef CAS PubMed.
  23. J. A. Seabold, K. Shankar, R. H. T. Wilke, M. Paulose, O. K. Varghese, C. A. Grimes and K.-S. Choi, Chem. Mater., 2008, 20, 5266–5273 CrossRef CAS.
  24. Y. Chen, J. C. Crittenden, S. Hackney, L. Sutter and D. W. Hand, Environ. Sci. Technol., 2005, 39, 1201–1208 CrossRef CAS.
  25. R. R. Ozer and J. L. Ferry, Environ. Sci. Technol., 2001, 35, 3242–3246 CrossRef CAS.
  26. C. Chen, P. Lei, H. Ji, W. Ma, J. Zhao, H. Hidaka and N. Serpone, Environ. Sci. Technol., 2004, 38, 329–337 CrossRef CAS.
  27. Y. Yang, Y. Guo, C. Hu, C. Jiang and E. Wang, J. Mater. Chem., 2003, 13, 1686–1694 RSC.
  28. A. Troupis, A. Hiskia and E. Papaconstantinou, Angew. Chem., Int. Ed., 2002, 41, 1911–1914 CrossRef CAS.
  29. M. Gratzel, Nature, 2001, 414, 338–344 CrossRef CAS PubMed.

Footnote

Electronic supplementary information (ESI) available: More EDAX and XPS results. See DOI: 10.1039/c4ra08934k

This journal is © The Royal Society of Chemistry 2014
Click here to see how this site uses Cookies. View our privacy policy here.