Experimental evaluation of the gas recovery factor of methane hydrate in sandy sediment

Yoshihiro Konno*, Yusuke Jin, Kazunori Shinjou and Jiro Nagao*
Production Technology Team, Methane Hydrate Research Center, National Institute of Advanced Industrial Science and Technology (AIST), 2-17-2-1 Tsukisamu-Higashi, Toyohira-ku, Sapporo 062-8517, Japan. E-mail: yoshihiro-konno@aist.go.jp; jiro.nagao@aist.go.jp; Fax: +81 11 857 8417; Tel: +81 11 857 8949

Received 18th August 2014 , Accepted 7th October 2014

First published on 7th October 2014


Abstract

Gas production tests have been conducted on artificial sandy sediments saturated by methane hydrate and water using a unique apparatus referred to as High-pressure Giant Unit for Methane-hydrate Analyses (HiGUMA), which is the world's largest reservoir simulating vessel intended for gas hydrate analysis. The gas recovery factor was investigated at various depressurization schemes, including one-step depressurization, multistep depressurization, and depressurization below the quadruple point of methane hydrate. The gas production rate increased during the depressurization process with sediment temperature reduction; however, the rate decrease and stabilized at a very low level after the temperature reached a newly established equilibrium condition. This result indicates that an appropriate heat of the hydrate-bearing sediments is a crucial factor for driving hydrate dissociation. The potential economic recovery factor was 14% for 4.6 MPa of production pressure in the one-step depressurization. In the multistep depressurization, the recovery factor was increased with a reduction in production pressure and showed values of 13%, 31%, and 40% for 4.0 MPa, 3.1 MPa, and 2.5 MPa, respectively. However, depressurization above the quadruple point could not dissociate all the existing hydrate due to the lack of heat. In contrast, it was determined that 65% of the in-place methane could be produced when the production pressure was decreased to 2.1 MPa, which is below the quadruple point, because the latent heat of ice formation was efficiently used for hydrate dissociation. The results show that intentional ice formation by adjusting production pressure can potentially enhance methane hydrate recovery at a comparable level of conventional natural gas production.

Introduction

Gas hydrates are clathrate compounds in which appropriately sized gas molecules known as guests are trapped inside a cage of hydrogen-bonded water molecules.1 Various molecules such as methane, nitrogen, and carbon dioxide can become guests; however, methane hydrate is the most common hydrate present in nature. Methane hydrate is known as a source of abundant carbon in the geosphere and has potential as an exploitable gas resource.2 Methane hydrate trapped within sandy sediments in permafrost regions and shallow sea beds exhibits promising features for commercial gas production. In particular, methane hydrate in shallow sea beds represents a potentially enormous source of methane and motivates large energy consumer countries such as Japan, China, India, and South Korea to produce natural gas.

Commonly known methods of gas production from hydrate-bearing sediments include thermal stimulation, depressurization, chemical injection, and combinations of these processes.3 Thermal stimulation and depressurization methods were applied at the Mackenzie Delta, Northwest Territories, Canada, during the winters of 2002, 2007, and 2008.4–6 These field tests revealed that depressurization is a promising gas production method from the perspectives of energy efficiency and productivity. On the basis of this knowledge, Japan Oil, Gas and Metals National Corporation conducted the world's first offshore experiment to produce gas by depressurization during March 12–18, 2013, as part of a program sponsored by the Research Consortium for Methane Hydrate Resources in Japan (MH21 Research Consortium). Provisional results show that a cumulative gas volume of approximately 120[thin space (1/6-em)]000 m3 was continuously produced during the test, which lasted approximately six days.7 The test demonstrated the technical feasibility of producing gas in significant quantities by depressurization from methane hydrate on a shallow seabed.

Fig. 1 schematically shows the production behavior of the depressurization method when using a single vertical well system. Depressurization is a gas recovery method used to dissociate methane hydrate by lowering the wellbore pressure to a level below the hydrate stability pressure. Generally, the production pressure is kept above 3 MPa to avoid ice formation. This value is slightly above 2.56 MPa, which is the quadruple point of methane hydrate. In the early production stage, gas production is controlled by the flow properties of hydrate-bearing sediments. Although the initial permeability of hydrate-bearing sediments is relatively lower than conventional oil/gas reservoirs because of pore filling by solid hydrates, the reservoir-intrinsic permeability (absolute permeability) is sufficiently high to produce gas in the presence of methane hydrate in unconsolidated sandy sediments. Because of the unique features of hydrate-bearing sediments, the drainage radius increases with time by hydrate dissociation. Therefore, the gas production rate is considered to increase in the early production stage.


image file: c4ra08822k-f1.tif
Fig. 1 Schematic of production behavior using depressurization method.

While the drainage radius is expanding, methane hydrate dissociation is driven mainly using the sensible heat in the reservoir. The sensible heat is generated from temperature gaps between the initial reservoir temperature and equilibrium temperature at the decreased pressure. The sensible heat is generated in situ and is used as the latent heat of hydrate dissociation. However, the sensible heat is insufficient for dissociating all the existing methane hydrate, which is particularly true for highly hydrate-saturated and lower temperature reservoirs. After exhausting the sensible heat, the gas production rate turns downward because of the lack of hydrate dissociation heat, and hydrate dissociation continues by heat conduction from over- and under-burden layers. The gas production rate at this stage stabilizes at a very low level, which would not be economically viable. Thus, the potential of economical gas production by the depressurization method exists only until the sensible heat is consumed.

The fundamental mechanism of the depressurization method indicates that the method can be applicable to permeable reservoirs such as oceanic sandy sediments. Enhanced methane hydrate recovery (EMHR) should be developed to increase the recovery factor after depletion of the sensible heat. Obviously, long-term (more than a few months) production tests in the field are essential to assess the feasibility of exploiting methane hydrate and should be encouraged in the future. However, few short-term field tests have been conducted thus far because they are generally costly and time consuming. Under these circumstances, laboratory tests continue to play an important role in the investigation of gas production methods.

Laboratory experiments of gas hydrates in sediments began in the 1990s from so-called core tests using centimeter scales.8 The primary motive was to investigate the formation and dissociation behavior of gas hydrates in porous media. Modern laboratory experiments have become larger and more complex in order to mimic actual field conditions, and they focus on efficient and sustainable gas production methods. At the Oak Ridge National Laboratory, USA, Phelps et al.9 developed a seafloor process simulator with a volume of 72.2 L for investigating the formation and properties of gas hydrates at temperatures and pressures corresponding to ocean depths of 2 km. Recently, this simulator was used to study fines migration during gas production from hydrate-bearing sediments.10 Castaldi et al.11–13 built a 72 L scale reactor vessel to investigate gas production from methane hydrate and analyzed the depressurization and thermal stimulation methods for producing gas. Yang, Yuan, and Sun et al.14–18 performed gas production experiments from methane hydrate using various methods such as hot-water cyclic injection, ethylene glycol injection, depressurization, gaseous carbon dioxide injection, and liquid carbon dioxide injection. Their experiments included a medium-sized cylindrical reactor with a volume of approximately 7 L. Li et al.19–22 developed a cubic hydrate simulator with a volume of 5.8 L and investigated production methods such as hot water huff and puff, depressurization, and combinations of these processes. Recently, Li et al.23,24 developed a larger cylindrical pressure vessel known as the pilot-scale hydrate simulator with a volume of 117.8 L. Additionally, within the framework of the German national research project, Submarine Gas Hydrate Reservoirs, a 425 L scale laboratory reservoir simulator (LARS) was developed by Schicks et al.25 Thus far, LARS is the largest reservoir simulator for hydrate research and is equipped with a unique catalytic reactor for heating hydrate-bearing sediments to produce gas. The confining pressure enables mimicking of an actual sediment setting whereby pressure is applied to the sediment via a neoprene jacket set inside the pressure vessel. This system gives LARS an advantage over other hydrate reservoir simulators.

To understand the gas production behavior in actual fields using laboratory experiments, the experimental setup should be designed as per the field conditions. In particular, the rate-determining factor of gas production at the laboratory must be identical to that in the actual field. Generally, the rate-determining factor of gas production differs depending on the reservoir scale.26–29 For example, the rate-determining factors in centimeter scales are phase change kinetics and heat transfer; mass transfer is not a dominant factor in such small scales. Conversely, in field scales, mass transfer becomes the predominant factor in the early production stage. Phase change kinetics is negligible, and heat transfer is a predominant factor in the late production stage. From this perspective, recent efforts to increase vessel size are reasonable measures for investigating gas production behavior at the field scale. However, few experimental apparatuses are sufficiently large for eliminating the boundary effect. Generally, it is difficult to distinguish the flow control dissociation, or sensible-heat-driven dissociation, from the heat-conduction-driven dissociation. As a result, investigations of gas recovery factors have been rarely conducted.

In this study, we use the world's largest reservoir simulator, the High-pressure Giant Unit for Methane-hydrate Analyses (HiGUMA) to simulate field-like gas production behavior through laboratory experiments. We form methane hydrate in artificial sandy sediments within the pressure vessel of HiGUMA and perform gas production tests using the depressurization method with a vertical well system. To evaluate the feasibility of the depressurization method, gas recovery factors are investigated for different production pressures and pressure reduction schedules. Additionally, as an EMHR to assist in the depressurization method, that which dissociates gas hydrate through the use of ice formation heat is analyzed.

Results and discussion

Production behavior and recovery factor during one-step depressurization

To understand the typical production behavior when using the normal depressurization method, a gas production test was conducted through one-step depressurization. Fig. 2(a) shows the experimental results of the time-dependent variations in gas and water production rates in which the moving average was 5 min. Production and overburden pressure are also shown in Fig. 2(b). The phase saturations in this experiment were 39% methane hydrate, 55% water, and 6% gas with a porosity of 43%. The production pressure was decreased to 4.6 MPa over 50 min in one step. After starting depressurization, the water production rate gradually increased and was followed by gas production. When the production pressure fell below the equilibrium pressure of methane hydrate at the initial temperature (6.9 MPa at 283.15 K), the water production rate showed a rapid increase. After the water production rate reached a peak rate, the gas production started to increase. These results indicate that pore-filling water is drained in the first process of depressurization, after which time gas decomposed from methane hydrate starts to flow. The increasing tendency of the gas production rate lasted during the depressurization process. In contrast, the water production rate decreased rapidly after reaching the peak rate. The reduction in the gas production rate occurred after the pressure reached the setting value of 4.6 MPa.
image file: c4ra08822k-f2.tif
Fig. 2 Production behavior during one-step depressurization.

Temperatures of the sediment are shown in Fig. 2(c). During the depressurization process, temperatures of the sediments decreased owing to the endothermic reaction of hydrate dissociation. When the production pressure reached 4.6 MPa, the temperatures stabilized at approximately 278.8 K, which is the equilibrium temperature of methane hydrate at 4.6 MPa. This result demonstrates that the equilibrium condition was newly established in the sediments according to the reduced pressure. In other words, the sensible heat of the sediments was depleted for hydrate dissociation during the depressurization process. After depleting the sensible heat, the production of both gas and water showed stable behavior and lasted approximately 150 h until all the methane hydrate was dissociated. Hydrate dissociation at this stage was driven by the heat conduction from the surrounding areas of the vessel. As previously mentioned, heat-conduction-driven dissociation would not meet the economical requirements of gas production. For this reason, the potential economic recovery factor should be determined on the basis of cumulative gas production before stabilization of the gas production rate. The experiment shows that the cumulative gas volume before the stabilized period was 3.6 Nm3, which is 14% of the in-place methane in the sediment (25.7 Nm3). On the contrary, 78% of the in-place methane was finally produced after all the existing hydrate was dissociated (20.0 Nm3). This result indicates that the potential economic recovery factor is 18% of the technically viable recovery factor under these conditions.

Sediment compaction is also an important behavior in investigating the feasibility of the depressurization method. Displacement of the sediments is shown in Fig. 2(d). Compaction occurred after starting depressurization; rapid change was especially observed after a decrease in the temperature. This is because hydrate dissociation caused sediments to lose their cementing effect. The compaction strain moderated after the hydrate dissociation stabilized. This result indicates that rapid sediment compaction occurred mainly during sensible heat-driven dissociation.

Production behavior and recovery factors during multistep depressurization

In an actual operation in fields, the production pressure is adjusted according to the production rate. In this experiment, the production pressure was reduced by following three steps. From the perspective of the sensible heat generation, the production pressure should be reduced as much as possible. Accordingly, the production pressure was decreased to the approximate condition of the quadruple point of methane hydrate (2.56 MPa, 273 K) at the final reduction step. Fig. 3(a)–(d) show the time-dependent variations in gas and water production rates with a 5 min moving average, production and overburden pressure, temperatures of the sediments, and displacement of the sediments, respectively.
image file: c4ra08822k-f3.tif
Fig. 3 Production behavior during multistep depressurization.

First, the production pressure was decreased to 4.0 MPa over several minutes. The gas and water production in first-step depressurization showed similar behavior to that observed in the experiment described in the previous section. The water production rate reached a peak rate, followed by gas production. The gas production increased after the depressurization process; however, reduction followed because of the sensible heat consumption. The sediment compaction occurred rapidly after a decrease in the temperature. The well was shut after approximately 10 min before the temperatures in the sediments decreased to the equilibrium temperature (277 K at 4.0 MPa). During the 30 min shut-in period, the temperatures increased slightly by heat conduction from the areas surrounding the vessel. The sediment compaction stabilized after the well was shut; however, the change continued during the shut-in period.

Second-step depressurization was started at approximately 40 min. The production pressure was decreased to 3.1 MPa over 10 min. The production behavior showed slight differences in this step. The gas production rate increased immediately after depressurization, followed by water production, and its gas–water ratio was obviously higher than that in the first-step depressurization. This result occurred because most of the pore-filling water was already produced in first-step depressurization. Additionally, gas saturation increased during the shut-in period because the equilibrium condition had already collapsed after first-step depressurization. These conditions allowed decomposed gas to flow easily just after second-step depressurization. This phenomenon may be enhanced in laboratory experiments because, in actual fields, pore water in deeper sediments flow into the surrounding areas of the well. However, over time, a similar condition occurs in fields. Rapid sediment compaction occurred again after a decrease in the temperature, and the change stabilized after the temperatures reached the equilibrium.

Third-step depressurization was conducted immediately after second-step depressurization. The production pressure was decreased to 2.5 MPa over a few minutes. Although the production behavior was similar to that in second-step depressurization, the peak rates became smaller because the degree of depressurization from the second to third step was smaller (0.6 MPa) than that from the first to second step (0.9 MPa). The lower depressurization degree yielded less sensible heat generation and less expansion of decomposed gas; thus, the production rate became small. The compaction strain was also small. The production pressure of 2.5 MPa is just below the pressure at the quadruple point of methane hydrate; nevertheless, sediment temperatures did not show behavior indicating ice formation.

The phase saturations in the multistep depressurization experiment were 64% methane hydrate, 33% water, and 3% gas with a porosity of 40%; the total in-place methane was 34.6 Nm3. The recovery factor achieved after each depressurization step was 13%, 31%, and 40%, respectively. The production pressure decrease was directly proportional to the increase in recovery factor. However, methane hydrate remained in sediments even after the production pressure was reduced to that near the quadruple point. These results indicate that the sensible heat generated by the depressurization method is insufficient for dissociating all the existing hydrate in such a highly-saturated reservoir.

Production behavior and recovery factor by deep depressurization method

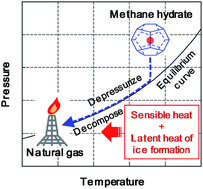
As mentioned in the previous sections, additional heat is required to enhance hydrate dissociation and to increase the recovery factor. The thermal stimulation method, including well heating and hot-water injection, was introduced as an EMHR; however, the efficient transportation of heat to the dissociation zone remains a problematic issue. To overcome the heat loss during transportation, heat generation near the dissociation zone is desirable. As one solution, the deep depressurization method (DDM) is introduced in this study. In this method, the wellbore pressure is lowered below the quadruple point of the hydrate. Under these conditions, water generated from hydrate dissociation instantaneously forms ice instead of a liquid phase. If the latent heat of ice formation is used for hydrate dissociation, productivity reduction due to lack of heat can be avoided. Production behavior below the quadruple point has been studied by analytical, numerical, and experimental research thus far, and the results varied among studies.11,30–36 In some studies, productivity worsened rather than improving because abundant ice formed in pore spaces, blocking flow paths. To understand the actual effect of ice formation on gas production, an apparatus such as HiGUMA is required to mimic field conditions.

In this study, the DDM was applied just after third-step depressurization. Fig. 4(a)–(d) show the time-dependent variations in gas and water production rates with a 5 min moving average, production and overburden pressure, temperatures of the sediments, and displacement of the sediments, respectively. The production pressure decreased from 2.5 MPa to 2.1 MPa over several minutes. During pressure reduction, the gas production rate denoted the same increasing tendency as that in third-step depressurization; however, the gas production rate stabilized at the peak rate for approximately 15 min without decreasing. Temperatures in the sediments showed small but rapid increases after decreasing, although the surrounding temperature was constant in this period, indicating ice formation. The same phenomenon—rapid increase of temperature during ice formation—was observed in other core-scale experiments when the pressure was lowered below the quadruple point of the hydrate.31,34,36 Although hydrate dissociation continued, the change in sediment compaction was slower than in the previous depressurization process. The slowdown may be caused by ice formation because the formed ice cemented the sediments instead of the hydrate.


image file: c4ra08822k-f4.tif
Fig. 4 Production behavior using the deep depressurization method (DDM).

Fig. 5 shows the correlation between the recovery factor and temperature gaps (the initial temperature minus the dissociation temperature) when applying normal depressurization (multistep depressurization) and the DDM. The recovery factor of normal depressurization increased almost linearly with an increase in temperature gaps, because the sensible heat used for hydrate dissociation increased by increasing the temperature gaps. On the contrary, the recovery factor achieved after applying the DDM was 65% despite the same temperature gap of normal depressurization. These results indicate that the additional contribution of sensible heat for hydrate dissociation was negligible, and it can be concluded that the latent heat of ice formation contributes to hydrate dissociation. The gas produced by the DDM (22.4 Nm3) was 68% of the technically recoverable gas (33.0 Nm3) when all the hydrate was dissociated. These results indicate that ice formation enhances hydrate dissociation and has a positive effect on gas production. Therefore, it can be inferred that the DDM is an effective EMHR after depletion of the sensible heat of reservoirs. Note that the negative effect of ice formation may occur in cases where absolute permeability is too low and ice forms severely around the well. Optimization of the DDM is a subject for further study.


image file: c4ra08822k-f5.tif
Fig. 5 Correlation between the recovery factor and temperature gaps.

Experimental details

System overview of HiGUMA

The HiGUMA was constructed to bridge the scale gap between conventional laboratory experiments (tens of centimeters in scale) and field tests (a few hundred meters in scale). Konno et al. showed that the size requirement for flow control dissociation was approximately 0.5 m in the case of one-dimensional cores.28 On this basis, the size of HiGUMA was decided. The detailed design concept of this facility was described by Nagao.29 The HiGUMA was developed as part of a national research program sponsored by the Research Group for Production Method and Modeling established in the MH21 Research Consortium. The HiGUMA was manufactured by Mitsui Zosen Plant Engineering Inc. in compliance with the criteria laid out in the High Pressure Gas Safety Act of Japan and is operated by the Methane Hydrate Research Center (MHRC) of AIST, Japan. It is interesting to note that the Japanese word “Higuma” means brown bear, which is the largest terrestrial animal in Japan and a symbolic animal in the island of Hokkaido, where the MHRC is based.

A schematic diagram of the HiGUMA is shown in Fig. 6. The HiGUMA consists of a main pressure vessel with a vertical well system, two pressure vessels for fluid separation and sampling, a gas pod for produced gas, a booster for gas injection, two pumps for water injection, numerous valves and sensors. The operating pressure of the main pressure vessel is 15 MPa (design pressure 16.5 MPa) and the operation temperature range is 0–20 °C (accessible temperature range from −5 °C to 20 °C). These ranges satisfy the pressure and temperature ranges of target reservoirs for resource development at the eastern Nankai Trough, offshore Japan. The main pressure vessel was built inside a walk- in, two-storied, explosion-proof cold room. The data acquisition and control system was installed in a monitoring room with double-entry doors.


image file: c4ra08822k-f6.tif
Fig. 6 Schematic of the High-pressure Giant Unit for Methane-hydrate Analyses (HiGUMA).

Pressure vessel and vertical well system

Fig. 7 shows schematic diagrams of the main pressure vessel and vertical well system. The height of the vessel is 3.2 m, and the external diameter is 1.4 m at its widest point. The internal volume of the vessel is 1710 L, which makes it the world's largest reservoir simulator for gas hydrate analysis. The maximum design pressure and minimum and maximum design temperatures are 16.5 MPa, −8.0 °C, and 40 °C, respectively. The vessel is constructed of carbon steel and stainless steel and has three sections: the upper cap, sample container, and bottom part. Sandy sediment with methane hydrate is formed within the sample container. A movable plate located between the upper cap and the sample container divides the material inside the vessel into water and sandy sediment components. The movable plate is pressed into the sandy sediment by pressurized water stored within the upper cap to mimic the overburden pressure of a natural formation. The bottom part is filled by porous bricks and gravel to simulate an aquifer. The inner diameter of the sample container is 1.0 m, and the sample height is 1.0–1.1 m. The volume of the sample container is greater than 810 L, depending on the sample height and position of the movable plate. Each connection of the three sections is sealed by a nitrile butadiene rubber (NBR) O-ring and a polytetrafluoroethylene backup ring, and sections are held in place by 28 alloy-steel bolts (JIS SNB23-1, size: M60). The weights of the upper cap, sample container, and bottom part are 2210, 3640, and 3130 kg, respectively. The total weight of the vessel, including the sample, movable plate, and well system, is greater than 12[thin space (1/6-em)]000 kg. The vessel is anchored on the concrete floor of the cold room, and the upper cap can be hoisted and removed with a crane during sample preparation. Each section has various openings for sensor insertion and water and gas flow lines. The sample container has 50 ports, which are mainly used for pressure and temperature sensors, located in four rows along the direction of the height. Nineteen ports in the bottom part are used for water injection and drainage. The ports in the upper cap are used for the pressure and temperature sensors, water injection to apply overburden pressure, and a connection for the vertical well system. The upper cap also has an optical window for a laser displacement meter to measure the position of the movable plate corresponding to sediment compaction.
image file: c4ra08822k-f7.tif
Fig. 7 Schematic of the main pressure vessel and the vertical well system.

The vertical well system is located at the center of the sample chamber. The length of the well is 1.3 m, and the outer and inner diameters are 0.132 and 0.100 m, respectively. The well is composed of stainless steel and has 32 ports, including four in the circumferential direction × eight in the vertical direction. Each port has an 8 mm diameter hole, which is plugged by an open-hole cap with a sand screen (aperture 100 μm) or a shut-in cap. These configurations are used to mimic the actual wells used in field tests. The diameter of the well is similar to the size of an actual well casing at production intervals in field tests. Although the ports system is not being used in field tests, such a system enables free selection of production intervals instead of perforations in field tests. Sand screens can be replaced to create coarser or finer apertures on the basis of the grain size of sediments. An aperture of 100 μm was selected to prevent production of Toyoura standard sand, in which the average particle diameter is 220 μm. The well penetrates the movable plate and is connected to a guide pipe mounted on the upper cap. Each connection is sealed by NBR O-rings and can be detached easily, which enables replacement of the well with a newly designed one if necessary. The well can be used to inject gas during the hydrate formation process, and by definition, it is also used for production of gas and water during the production tests. The pressure of the well is controlled by two back pressure controller valves set in the production line. These back pressure controller valves are connected in a parallel arrangement for robust pressure control.

Separator, sampling pod, and gas pod for production fluids and sand

The production line from the vertical well system is connected to the separator, which is a small pressure vessel with an internal volume of 66 L. A water-level gauge is mounted to measure the water volume produced. The lowest portion of the separator is connected to a sampling pod with an internal volume of 13 L. The water and fine sand produced during this process can be sampled by the pod during the experiment. The maximum design pressure and minimum and maximum design temperatures of each vessel are 16.5 MPa, −8.0 °C, and 40 °C, respectively. The produced gas is stored in the gas pod with an internal volume of 1606 L before venting. The maximum design pressure of the gas pod is 0.8 MPa. The gas stored in the gas pod can be sampled through a vacuum pump.

Sensors and data acquisition and control system

Pressure transducers (Yokogawa Electric Corporation, EJX440J) that are explosion proof and have a working range of 0–20 MPa with an accuracy ±0.075% are used for the pressure measurements of the sandy sediment, production line, water stored within the upper cap, separator, and gas pod. The temperatures of the sandy sediment, water stored within the upper cap, separator, and gas pod are measured by explosion-proof, type K thermocouples (Yamari Industries, TFTB-316). The water level in the separator is measured by an explosion-proof differential pressure transducer (Yokogawa Electric Corporation, EJX130J) with a working range of 0–5.87 kPa at an accuracy of ±0.1%. The position of the movable plate corresponding to sediment compaction is evaluated by a laser displacement meter (KEYENCE, Multi-Function Analog Laser Sensor IL-600). The gas flow rate is measured by a mass flow meter (Tokyo Keiso, EP-TF-5340). Fig. 8 shows the locations of sensors used in this study.
image file: c4ra08822k-f8.tif
Fig. 8 Locations of sensors.

The main valves in the injection and production lines and all sensors are connected to a distributed control system (DCS) manufactured by Yokogawa Electric Corporation (CENTUM VP). The DCS is located in a monitoring room with double-entry doors separated from the explosion-protection area. All data are monitored and recorded at 10 s intervals. Opening and closing of the main valves, temperature control of the cold room, and pressure control of all vessels are controlled remotely through the DCS. The DCS constantly monitors the HiGUMA and sends an alarm and an e-mail to a predetermined administrator when conditions can become catastrophic, such as a methane gas leak, a high-temperature anomaly suggesting a fire, a strong earthquake, or an electrical power outage. In the event of an electrical power outage, the DCS automatically shuts down the HiGUMA using electricity supplied from an uninterruptible power supply.

Experimental procedure

Sandy sediments were prepared using Toyoura standard sand with an average particle diameter of 220 μm. First, the well was mounted vertically at the center of the sample container using a centering jig. Then, the sample container was filled with distilled water to a predetermined level, and sand was sifted into the sample container through a movable screen at a constant height. Then, the sand was mixed with the distilled water using a vibrator to tighten the sediment. This process was repeated several times. Approximately 1300 kg of sand was used, and the resulting sediment porosity calculated by material balance was 40–43%.

Excess water in the sandy sediment was drained by gravity through ports at the bottom of the pressure vessel prior to methane gas injection. During the drainage process, to avoid hydrate formation in the porous brick and gravel, the water level in the pressure vessel was maintained at just above the top surface of the porous brick. This procedure prevents gas invasion into the porous brick and gravel. Thus, the residual water in sandy sediments initially formed methane hydrate. Fig. 9 shows the temperature and pressure changes during the hydrate formation process of a sample used for the test of one-step depressurization. Methane gas with a grade purity of 99.5% was injected through the vertical well. To avoid contamination, any residual air in the sediment was flushed a few times with methane gas prior to raising the pressure to 10.1 MPa. The cold room temperature was decreased to 276 K to begin the hydrate formation. Methane gas was injected a few times during 10 days while maintaining the system under hydrate formation conditions. After the pressure was stabilized between 10.1 MPa and the equilibrium pressure of methane hydrate, distilled water was injected through the ports at the bottom of the pressure vessel to cause residual methane gas to form into hydrate. Then, the pressure and temperature were set at 10 MPa and 283 K, respectively. To ensure that residual gas was removed from the pressure vessel, distilled water was flooded through the pressure vessel until the outflow rate matched the injection rate. Drainage and injection of water were conducted in the vertical direction to avoid radial distribution of water, which would result in radial distribution of hydrate and may influence production behaviors.


image file: c4ra08822k-f9.tif
Fig. 9 Temperature and pressure changes during hydrate formation. The equilibrium condition of methane hydrate was calculated by CSMHYD, which is available publicly on the website of the Center for Hydrate Research at the Colorado School of Mines.37

Depressurization tests were performed by adjusting the back pressure controller valves to maintain a constant level of production pressure. The ports of the well were plugged by open-hole caps from the second to sixth line in the vertical direction, and all others were plugged with shut-in caps (Fig. 7). The top and bottom ports were plugged to eliminate preferential pressure propagation through the upper sand boundary and the lower aquifer of porous brick. The overburden pressure was maintained at 12 MPa during production. The cold room temperature was maintained at a constant 283 K. The gas production test lasted for approximately 10 days until the temperature inside the sandy sediment recovered to the initial temperature of 283 K. At the end of the production operation, the system pressure was decreased to atmospheric pressure to collect residual gas. Finally, phase saturations were calculated by solving the volume balance of each phase inside the pore volume of sediments at the initial pressure and temperature conditions.36 The total amount of water was derived from material valance during drainage and injection of water in the hydrate formation process. The total amount of gas, in contrast, was derived from all corrected gas after the depressurization test. Assuming that hydrate formed homogeneously in sandy sediments, phase saturations were determined.

Conclusions

We repeatedly conducted gas production tests from methane hydrate in sandy sediments prepared with HiGUMA, the world's largest pressure vessel. Depressurization was applied to produce gas from methane hydrate using a vertical well system. Gas production at a high rate was achieved during the depressurization process, which was driven by consumption of the sensible heat in the reservoir. However, the gas production rate showed a rapid decrease after depletion of the sensible heat. The recovery factor of this high-rate period was 14%, which is 18% of the technically recoverable gas at this production pressure. By lowering the production pressure in multiple steps, the recovery factor increased with a reduction of production pressure to levels of 13%, 31%, and 40% for 4.0 MPa, 3.1 MPa, and 2.5 MPa, respectively. However, depressurization above the quadruple point could not dissociate all the existing hydrate in our test conditions.

To overcome the productivity reduction due to the lack of heat for dissociation, the DDM was applied to enhance ice formation by decreasing the production pressure below the quadruple point. After reaching the production pressure below the quadruple point, gas production was sustained at a high rate with an abrupt temperature increase of sediments to the ice point. These results indicate that the latent heat of ice formation was used efficiently for the hydrate dissociation. The negative effect of flow blocking by ice formation was not observed in our test conditions. The recovery factor when applying the DDM was 65%, which is 68% of the technically recoverable gas at this production pressure. The recovery factor achieved using the DDM was comparable with that in conventional natural gas production. Thus, gas production from methane hydrate reservoirs can be competitive to conventional natural gas production by developing efficient and sustainable gas production methods such as the DDM.

Acknowledgements

This study was financially supported by the Research Consortium for Methane Hydrate Resources in Japan (MH21 Research Consortium), which conducts Japan's Methane Hydrate R&D Program conducted by the Ministry of Economy, Trade and Industry (METI). We gratefully acknowledge the financial support and permission provided to present this paper. We also thank Drs H. Narita, T. Ebinuma, M. Kida, and H. Oyama of AIST for their fruitful discussions and K. Watanabe, H. Asano, K. Matsumoto, H. Izumi, and T. Uchiumi of AIST for their technical support.

Notes and references

  1. E. D. Sloan and C. A. Koh, CRC, Boca Raton, Clathrate Hydrates of Natural Gases, FL, 3rd edn, 2008 Search PubMed.
  2. R. Boswell and T. S. Collett, Energy Environ. Sci., 2011, 4, 1206–1215 CAS.
  3. Y. F. Makogon, Hydrates of Hydrocarbons, Penn Well Publishing, Co., Tulsa, OK, 1997 Search PubMed.
  4. S. H. Hancock, T. S. Collett, S. R. Dallimore, T. Satoh, T. Inoue, E. Huenges, J. Henninges and B. Weatherill, Bull. - Geol. Surv. Can., 2005, 585, 15 Search PubMed.
  5. M. Yasuda and S. J. Dallimore, J. Jpn. Assoc. Pet. Technol., 2007, 72, 603–607 CrossRef CAS , Japanese with English abstract.
  6. K. Yamamoto and S. Dallimore, Fire in the Ice, 2008, 8(3), 1–5 Search PubMed.
  7. JOGMEC, News Releases 2012, 2013, March 19, https://www.jogmec.go.jp/english/news/release/news_01_000006.html.
  8. M. H. Yousif, P. M. Li, M. S. Selim and E. D. Sloan, J. Inclusion Phenom., 1990, 8, 71–88 CrossRef CAS.
  9. T. J. Phelps, D. J. Peters, S. L. Marshall, O. R. West, L. Liang, J. G. Blencoe, V. Alexiades, G. K. Jacobs, M. T. Naney and J. L. Heck, Jr, Rev. Sci. Instrum., 2001, 72, 1514–1521 CrossRef CAS PubMed.
  10. J. W. Jung, J. Jang, J. C. Santamarina, C. Tsouris, T. J. Phelps and C. J. Rawn, Energy Fuels, 2012, 26, 480–487 CrossRef CAS.
  11. Y. Zhou, M. J. Castaldi and T. M. Yegulalp, Ind. Eng. Chem. Res., 2009, 48, 3142–3149 CrossRef CAS.
  12. G. C. Fitzgerald, M. J. Castaldi and Y. Zhou, J. Pet. Sci. Eng., 2012, 94–95, 19–27 CrossRef CAS PubMed.
  13. G. C. Fitzgerald and M. J. Castaldi, Ind. Eng. Chem. Res., 2013, 52, 6571–6581 CrossRef CAS.
  14. X. Yang, C. Sun, Q. Yuan, P. Ma and G. Chen, Energy Fuels, 2010, 24, 5912–5920 CrossRef CAS.
  15. Q. Yuan, C. Sun, X. Yang, P. Ma, Z. Ma, Q. Li and G. Chen, Energy Fuels, 2011, 25, 3108–3115 CrossRef CAS.
  16. X. Yang, C. Sun, K. Su, Q. Yuan, Q. Li and G. Chen, Energy Convers. Manage., 2012, 56, 1–7 CrossRef CAS PubMed.
  17. Q. Yuan, C. Sun, X. Yang, P. Ma, Z. Ma, B. Liu, Q. Ma, L. Yang and G. Chen, Energy, 2012, 40, 47–58 CrossRef CAS PubMed.
  18. Q. Yuan, C. Sun, B. Liu, X. Wang, Z. Ma, Q. Ma, L. Yang, G. Chen, Q. Li, S. Li and K. Zhang, Energy Convers. Manage., 2013, 67, 257–264 CrossRef CAS PubMed.
  19. G. Li, X. Li, Y. Wang and Y. Zhang, Energy, 2011, 36, 3170–3178 CrossRef CAS PubMed.
  20. X. Li, Y. Wang, G. Li, Y. Zhang and Z. Chen, Energy Fuels, 2011, 25, 1650–1658 CrossRef CAS.
  21. X. Li, Y. Zhang, G. Li, Z. Chen and H. Wu, Energy Fuels, 2011, 25, 4497–4505 CrossRef CAS.
  22. X. Li, Y. Wang, G. Li and Y. Zhang, Energy Fuels, 2012, 26, 1124–1134 CrossRef CAS.
  23. X. Li, B. Yang, G. Li, B. Li, Y. Zhang and Z. Chen, Fuel, 2012, 94, 486–494 CrossRef CAS PubMed.
  24. G. Li, B. Li, X. Li, Y. Zhang and Y. Wang, Energy Fuels, 2012, 26, 6300–6310 CrossRef CAS.
  25. J. Schicks, E. Spangenberg, R. Giese, B. Steinhauer, J. Klump and M. Luzi, Energies, 2011, 4, 151–172 CrossRef CAS PubMed.
  26. L.-G. Tang, X.-S. Li, Z.-P. Feng, G. Li and S.-S. Fan, Energy Fuels, 2007, 21, 227–233 CrossRef CAS.
  27. M. B. Kowalsky and G. J. Moridis, Energy Convers. Manage., 2007, 48, 1850–1863 CrossRef CAS PubMed.
  28. Y. Konno, Y. Masuda, H. Oyama, M. Kurihara, and H. Ouchi, Proceedings of 2010 Offshore Technology Conference held in Houston, Texas, USA, 3–6 May 2010, OTC 20591 Search PubMed.
  29. J. Nagao, Synthesiology, 2012, 5, 89–97 CrossRef.
  30. G. G. Tsypkin, Fluid Dyn., 2005, 40, 117–125 CrossRef CAS PubMed.
  31. Y. Zhou, M. J. Castaldi and T. M. Yegulalp, Ind. Eng. Chem. Res., 2009, 48, 3142–3149 CrossRef CAS.
  32. G. J. Moridis, T. S. Collett, R. Boswell, M. Kurihara, M. T. Reagan, C. Koh and E. D. Sloan, SPE Reservoir Eval. Eng., 2009, 12, 745–771 CrossRef CAS PubMed.
  33. G. J. Moridis and M. T. Reagan, J. Pet. Sci. Eng., 2011, 76, 124–137 CrossRef CAS PubMed.
  34. C. Haligva, P. Linga, J. A. Ripmeester and P. Englezos, Energy Fuels, 2010, 24, 2947–2955 CrossRef CAS.
  35. E. M. Myshakin, B. J. Anderson, K. Rose and R. Boswell, Energy Fuels, 2011, 25, 1077–1091 CrossRef CAS.
  36. Y. Konno, T. Uchiumi, H. Oyama, Y. Jin, J. Nagao, Y. Masuda and H. Ouchi, Energy Fuels, 2012, 26, 4310–4320 CrossRef CAS.
  37. CSMHYD, Center for Hydrate Research at the Colorado School of Mines, http://hydrates.mines.edu/CHR/Software.html Search PubMed.

This journal is © The Royal Society of Chemistry 2014
Click here to see how this site uses Cookies. View our privacy policy here.