Photochromic Ag:TiO2 thin films on PET substrate

F. Tricotabcdef, F. Vocanson*abc, D. Chaussydef, D. Beneventidef, S. Reynaudabc, Y. Lefkirabc and N. Destouches*abc
aUniversity of Lyon, F-42023 Saint-Etienne, France
bCNRS, UMR 5516, Laboratoire Hubert Curien, 18 Rue Pr. Lauras, F-42000 Saint-Etienne, France. E-mail: nathalie.destouches@univ-st-etienne.fr; francis.vocanson@univ-st-etienne.fr
cUniversity of Saint-Etienne, Jean Monnet, F-42000 Saint-Etienne, France
dUniv. Grenoble Alpes, LGP2, F-38000 Grenoble, France
eCNRS, LGP2, F-38000 Grenoble, France
fAgefpi, France

Received 17th August 2014 , Accepted 4th November 2014

First published on 7th November 2014


Abstract

TiO2:Ag nanocomposite thin films were prepared on plastic PET substrate in two steps. First, a sol–gel route and evaporation induced self-assembly (EISA) method were used to fabricate the TiO2 matrix. The use of thermal treatment being discordant with the plastic substrate, the mesoporosity was realized by chemical extraction or infrared annealing. Silver was then introduced in the film porosity in the form of ions by soaking the films into a silver salt. A reversible photochromic behavior was successfully demonstrated after successive cycles of UV and visible laser exposures without degrading the PET substrate. This laser-induced colour changes are based on the reversible growth and dissociation of silver nanoparticles within the titania matrix.
Introduction

For the last few years, TiO2:Ag nanocomposite thin films have received a large amount of attention due to their photochromic behavior.1–12 These materials can reversibly change colour under light exposure.1,5–11 Films are prepared by creating a porous TiO2 matrix and loading it with silver species.5 When the latter are silver oxide or ions, the nanocomposite films are colorless. UV exposure permits then to reduce silver species in metallic silver nanoparticles thanks to the photocatalytic behavior of TiO2.10 Due to various shapes and sizes of silver nanoparticles the films usually take a grey-brown color resulting from an inhomogeneous broadening of the localized surface plasmon resonance (LSPR).1,8 Reversibly, exposure of colored films under visible light excites free electrons at the surface of particles through their LSPR. Excited electrons can, directly or via the TiO2 matrix, move to trapping centers like adsorbed oxygen or water molecules, and stabilize.8 Silver nanoparticles are then transformed in Ag+, silver oxide or smaller nanoparticles1,6 leading to the disappearance of the LSPR band and to the film bleaching.

To elaborate TiO2 matrix, sol–gel and EISA13 methods are commonly applied. To resume, a sol containing a titanium precursor is formulated with a surfactant that is added with a concentration superior to the critical micellar concentration to favor the formation of micelles in the film. The latter define the template of the mesoporosity that is released by removing the surfactant.13,14

To the best of our knowledge, all studies on such photochromic films had been carried out on rigid substrates: glass, pyrex glass, ITO, silica.1–12 Herein, we propose to adapt this technology on flexible substrates, and particularly on polyethylene terephthalate (PET) sheets to extend the traditional fields of applications of these photochromic materials to smart cards or packaging of products.

The use of plastic supports requires drastic changes in the elaboration process of the TiO2 matrix compared to what is usually done. The main one is striking out the traditional calcination commonly used to eliminate the surfactant from titania films. Some alternatives are found in literature consisting in washing with mixed solvents, extracting with a Soxhlet apparatus or treating with UV/ozone. For example, Fateh et al.15 coated polycarbonate (PC) supports with mesoporous TiO2 thin films, using the sol–gel method and Pluronic P123 as surfactant. After coating and stabilization, they removed surfactant from the film by washing it in a mixture of ethanol/HCl. Several studies found in literature also deal with the production of mesoporous SiO2 thin film by sol–gel on plastic supports using P123 or CTAB as surfactant. They involve a washing with ethanol or a Soxhlet extraction with ethanol for 24 h.16–18 Few papers report the use of an UV-ozone treatment to remove surfactant from inorganic thin films by oxidation of organic species.19

In this paper, we elaborate TiO2:Ag nanocomposite thin films on PET substrate by a sol–gel process. The sol and the surface properties of PET are characterized for optimizing the coating. The latter is then submitted to three chemical and physical treatments to polymerize the TiO2 network, create a mesoporosity without damaging the substrate and get a good adhesion on this. The performances of these treatments are compared. After filling the films with silver salt, their photochromic behavior is assessed through several cycles of color changes. Similar results to those already reached on rigid supports are demonstrated opening the way to new applications of these stable and polychrome photochromic coatings.

Experimental

Materials

Titanium tetra-isoproxyde (TTIP, 97%), benzoyl acetone (BzAc; 99%), 1-propanol (99.5%), sodium borohydride (NaBH4), ammonium hydroxide (NH4OH, 5 N) and poly(ethylene oxide)–poly(propylene oxide)–poly(ethylene oxide) block copolymer (Pluronic P123, MW: 5000) were all purchased from Sigma-Aldrich. Concentrated hydrochloric acid (HCl, 37%) and ethanol (EtOH, absolute) were respectively obtained from Roth and Carlo Erba and silver nitrate (AgNO3, 99%) was purchased from Acros. PET A4 sheets (Melinex ST504, thickness 175 μm) with one side coated with acrylics were furnished by DuPont Teijin Film.

Thin film preparation

Sol–gel formulation. Mesoporous TiO2 thin films were obtained by modifying a procedure we had used for inorganic photochromic coatings elaborated on rigid substrates.2 Ethanol and acetylacetone were respectively replaced by 1-propanol and BzAc in order to slow down the film drying and permit polymerising TiO2 without thermal treatment but under UV (365 nm) exposure. The formulation is now defined as follows: a precursor solution was prepared by mixing appropriate amounts of TTIP and BzAc in 1-propanol and was stirred for 15 min. An appropriate amount of Pluronic P123 was dissolved in 1-propanol and then mixed with the precursor solution after the addition of hydrochloric acid. The mixture was stirred for 30 min. After this period, ultra-pure water (H2O) was slowly added to the well-mixed solution before being stirred for seven hours. Molar ratios of these reagents were fixed at: TTIP/P123/1-propanol/HCl/H2O/BzAc = 1[thin space (1/6-em)]:[thin space (1/6-em)]0.026[thin space (1/6-em)]:[thin space (1/6-em)]29.77[thin space (1/6-em)]:[thin space (1/6-em)]0.017[thin space (1/6-em)]:[thin space (1/6-em)]31.11[thin space (1/6-em)]:[thin space (1/6-em)]0.5. The sol is then aged at least two days before using.
Coating on PET support. The sol was deposited on the untreated side of 2.5 cm × 2.5 cm square pieces of clean PET substrates thanks to a syringe combined at an Acrodisc syringe filter (from Sigma-Aldrich), composed of a PVDF membrane with pores of 200 nm of diameter. Uniform thin films were obtained by spin coating (1500 rpm for 40 seconds). The samples were then baked for 180 min at 110 °C to form a TiO2 xerogel film. The latter is highly soluble in alcohols owing to the TTIP–BzAc complexation.20 Three processes, two chemical and one physical, were then developed (i) to damage the chelating agent BzAc permitting the polymerization of the TiO2 matrix and (ii) to extract the surfactant P123 from the film and release the mesoporosity. All processes are described below and summed up in Fig. 1.
image file: c4ra08804b-f1.tif
Fig. 1 Elaboration processes of mesoporous TiO2 thin films.
Chemical processes leading to mesoporous TiO2 films. In this case, the polymerization of the TiO2 matrix and the release of porosity were performed in two steps. Firstly, films were exposed to UVA light (365 nm wavelength, 310 μW cm−2) for 24 h to decompose the TTIP–BzAc complex. Secondly, surfactant was extracted using two different ways. The first one involves a solid–liquid extraction through a well-known Soxhlet apparatus in which the ethanol used as solvent is heated to reflux. The solvent vapour travels up a distillation arm, and condenses into the chamber housing the thimble of solid. The liquid but warm solvent dissolved the Pluronic P123 contained in the thin films; then the Soxhlet chamber was emptied by a siphon side arm, with the solvent running back down to the distillation flask. This cycle was repeated during 18 hours.16–18 Then samples were dried at 60 °C for one night. The second consists in sonication in ethanol bath for 30 min before drying at 90 °C for 30 minutes.
Physical process leading to mesoporous TiO2 films. In this case, steps (i) and (ii) described above are performed simultaneously by infrared (IR) annealing in a Rapid Thermal Processing (RTP) Furnace AS-ONE supplied by AnnealSys. IR radiations emitted by halogen lamp (emission occurs from 0.3 to 4 μm) damage BzAc and Pluronic P123 by heating these IR absorbent species. To avoid the degradation of the PET substrate, which also absorbs IR radiations, a thermal contact is created between the bottom side of PET and the cooled base of the furnace. The operation conditions are defined by several parameters: the furnace chamber atmosphere, IR light power, heating time, annealing mode (continuous or pulsed heating) and, when needed, number of pulses and power ramp at the beginning of each pulse. We worked with a 50% O2–50% Ar atmosphere flowing continuously during annealing. This atmosphere appeared to be more effective than 100% O2 or ambient air to remove Pluronic P123 from the film. A pulsed mode was chosen to limit the thermal heating of PET in the bulk. For each pulse and whatever the targeted IR light power, a linear power ramp was adapted to last 1 min in the front edge. The pulse duration is defined as the ratio of the heating time and the number of pulses. The time between two successive pulses is fixed to 20 s, i.e. is long enough to cool down the sample between each pulse. The remaining parameters, i.e. IR light power (P), heating time (t) and number of pulses (n), were optimized using a Box–Behnken surface analysis design21–23 to maximize the P123 removal without damaging the PET substrate. For this study, P was varied between 20 and 40% of the maximum power (30 kW), t between 5 and 60 min and n between 1 and 9.

Introduction of silver salt in the films

The chemical and physical treatments both lead to mesoporous titania films on PET substrate. To give them a photochromic behavior, silver ions were introduced within the pores as follows. The films were soaked 30 min in an aqueous ammoniacal silver solution [Ag(NH3)2]+NO3 as already described in our previous papers.1,5 They were then rinsed with ultrapure water and dried for 12 h at room temperature in darkness.

Laser exposures for the photochromic tests

Silver nanoparticles were grown in situ from the impregnated silver salt using a continuous wave (CW) laser induced reduction at 244 nm wavelength with an irradiance of 0.11 W cm−2. The oxidation of silver nanoparticles was carried out with a CW Ar laser emitting at 488 nm with an irradiance of 6.7 W cm−2 or 4.6 W cm−2 depending on the films, as described hereafter.

Characterization

Sol characterization. Rheological behavior and viscosity were measured thanks to a Physica MCR 301 rheometer and using the CP50-1 modulus. The temperature was fixed at 20 °C for the measurements. To determine the viscosity, the shear rate was fixed at 1000 s−1 and one measurement per second of the viscosity value was taken during 5 minutes. To characterize the rheological behavior, a linear ramp of the shear rate from 100 to 2000 s−1 was applied, and the viscosity value was followed. The surface tension was evaluated with the Nouy ring method using a digital tensiometer Kruss K10ST. Ten measurements with a precision of 0.1 mN m−1 were carried out and the average was taken on.
Substrate and film characterization. A contact angle apparatus OCA 20 was used and surface energies of each side of PET sheets were calculated with the Owens Wendt equation from contact angle between the substrate and water, PEG 200, diiodomethane, and glycerol. Defects on the samples surface were observed through an optical microscope Leica FTM 200 equipped with a 10× objective lens. A PerkinElmer Lambda 900 UV/vis/NIR spectrophotometer was used to record the UV-vis spectra of bare or coated PET samples after different kinds of treatments to assess changes in the optical properties and sometimes in the film composition. A Thermo Nicolet iS10 Fourier transform infrared (FTIR) spectrometer was used to characterize the organic content of samples at different steps of the processes. The IR spectra were normalized thanks to the peak at 723 cm−1 which is included in Ti–O–Ti and BzAc bands and dominated by the PET. Bending strength of bare PET and coated PET were determined by bending a 50 mm length of PET sample through a 15° angle with Büchel Stiffness tester according to the NF Q 03-048 procedure. The sample is griped in jaws and rotated through the set angle, the force transmitted through the sample is measured. Film adhesion on PET substrate was measured with Scratch test by following the D3359-97 procedure of the American Society for Testing and Materials. The film thickness was determined using a Dektak XT surface Profiler with a diamond stylus of 2 μm in radius. To characterize the film surface at the nanoscale, scanning electron microscopy (SEM) pictures were obtained using a FEI NovananoSEM microscope (SEM-FEG) operating at an acceleration voltage of 10–15 kV under partial vacuum. To discuss about crystallinity and repartition of species in the film, Transmission Electron Microscopy (TEM) characterizations were carried out with a Jeol TEM 2010 LaB6 200kV. Sample was prepared by reducing the substrate thickness, putting it in a specific resin and preparing thin slices by ultramicrotomy.

Results and discussion

PET resistance to thermal, UV and IR treatments

Melinex ST504 (PET sheets) is given to be stable upon continuous heating up to 115 °C and to shrink from 150 °C for 30 min. UV-visible spectra and optical images of the bare substrates were recorded after two hours long heating at different temperatures and they attested a good resistance to temperature up 140 °C. From this temperature, a slight decrease in the transmittance spectrum occured and micrometer size bubbles were observed by optical microscopy. They are mainly due to the decomposition of some additives of the industrial coating covering the PET sheets. Due to this poor resistance to thermal heating and in order to avoid damaging the substrate, heating treatments for film elaboration will be limited to 110 °C during this study. This temperature is much lower than the temperature needed to decompose Pluronic P123 (about 300 °C) and to release the film porosity. Alternative processes to thermal heating in a furnace will therefore be carried out, as described in the thin film preparation sub-section. Rapid thermal annealing under IR flash lamps is one of them. After optimizing the use conditions, the effect of IR annealing on bare PET was characterized by UV-visible and IR transmission spectroscopy and microscopic observations. Transmittance spectra in the UV-visible and IR ranges of bare PET before and after annealing didn't change at all. In the same way, transmittance IR spectra of coated PET treated with Soxhlet and IR annealing showed no difference. Finally, no bubbles were observed at microscopic scale confirming that the PET substrate was not damaged by IR annealing. On the other hand, the chemical processes described previously also required a pre-exposure to UVA light in order to polymerize the TiO2 network. As PET absorbs UVA, it was checked that 24 hours long exposures in the conditions used for the film treatment did not change the optical properties of the bare sheets.

Compatibility between sol and substrate

The rheological behaviour of the sol was studied. Fig. 2 shows that the viscosity of the sol remains stable at around 6.5 mPa s from the second day after its formulation till at least 3 months. The sol also exhibits a Newtonian behavior for shear rates ranging from 100 s−1 to 2000 s−1.
image file: c4ra08804b-f2.tif
Fig. 2 Sol viscosity versus time.

To ensure that the sol could correctly spread on the PET sheet and give rise to homogeneous films, we compared the surface tension of the sol to the surface energy of the support. It is well known that wetting uniformly the surface of a solid with a liquid requires a surface energy higher than the surface tension of the covering solution.24 Our measurements give a surface energy of 38.51 and 42.03 mJ m−2 for both sides of PET sheets (the first one is bare, the other covered with an industrial organic coating). The surface tension of the sol, measured at 25.9 mN m−1, appears therefore to be lower than the surface energy of the support whatever the considered side. This ensures a good spreading as attested also by the small contact angle measured between the sol and the untreated side of a PET sheet, that is 15.9°.24

Mesoporous TiO2 thin film elaboration

The sol was deposited by spin coating at 1500 rpm and, as expected from previous characterizations, it led to homogeneous thin films on flexible PET sheets. The films were baked at 110 °C for 2 hours to form a TiO2 xerogel and stabilize the film. Then, chemical and physical processes have been carried out to release the mesoporosity; the results are assessed in the next sections.
Chemical treatments. The chemical treatments of the films are performed in two steps as described in the experimental section.

A first UVA exposure leads to the polymerization of the TiO2 network through the decomposition of BzAc. The latter is monitored by UV-visible transmission spectroscopy with the increase in the film transmittance at around 365 nm (Fig. 3), which allows to set the exposure time at 24 h to reach a high enough level of transmittance. After this step, the average film thickness is 272 ± 64 nm and its adhesion very good, with a class 4B according to the D3359-97 procedure, meaning less than 5% of the film surface peeled with the scotch tape test.


image file: c4ra08804b-f3.tif
Fig. 3 UV-vis transmittance spectra of coated films before and after UVA exposure.

The second step consists in a chemical removal of P123. Two ways were tested: (i) ethanol bath under sonication, and (ii) solid–liquid extraction with a Soxhlet apparatus. For both ways, ethanol was chosen as solvent because it was inert for PET and efficient for the P123 extraction. The Pluronic P123 removal was characterised by FTIR spectroscopy. The main peaks of P123 on IR spectra correspond to C–O bond vibration (1100 cm−1), CH2 (and CH3) symmetric bond vibration (2860 cm−1), CH2 antisymmetric bond vibration (2920 cm−1) and CH3 symmetric bond vibration (2970 cm−1). Unfortunately, the C–O and CH3 symmetric (2970 cm−1) peaks were dominated by contributions of ester group and CH of benzene cycle from the PET substrate around the same wavenumbers and cannot be used to follow changes in the film composition. The CH2 peak at 2920 cm−1 also strongly appears on the IR spectrum of the PET contrary to the one at 2860 cm−1. Consequently, only the peak at 2860 cm−1 was studied as being mainly due to the P123 presence. Treatment (i) leads to a maximum decrease in the 2860 cm−1 peak from 30 min (Fig. 4) whereas treatment (ii) requires 18 h for the same result (Fig. 4). Sonication at room temperature is thus much more efficient than Soxhlet extraction for the targeted application. Both kinds of films look homogeneous at the macroscopic scale after treatment, however some cracks appear on the film at the microscopic scale. They are more numerous and larger after sonication than after Soxhlet extraction (Table 1). The rapid extraction of P123 during sonication at room temperature probably produces stronger constrains within the film. These cracks do not alter the adhesion of films on PET, which remains a class 4B after both kinds of treatments.


image file: c4ra08804b-f4.tif
Fig. 4 IR spectra of coated films after chemical and physical treatments in optimized operation conditions.
Table 1 Comparison of the film characteristics for each elaboration process
  Soxhlet EtOH bath US IR annealing
Optical images of films in each elaboration process image file: c4ra08804b-u1.tif image file: c4ra08804b-u2.tif image file: c4ra08804b-u3.tif
Thickness (nm) 116 ± 18 144 ± 6 183 ± 9
Adhesion ≪5% of film surface damaged by scotch removing


It has to be noted that the chemical treatments strongly affect the film thickness (Table 1), compared to what was measured after UV exposure. This is likely to be due to the condensation of TiO2, the departure of P123 and also to the dissolution of a part of titania in ethanol. The latter is expected to be less important when ethanol is at ambient temperature than at reflux and ultrasonic bath, indeed, leads to a higher film thickness. At the nanometer scale, as observed by SEM, the film surface looks homogeneous with some texturing (Fig. 5). However, very few pores are clearly visible on the surface. The film surface after the Soxhlet treatment seems to be rougher than the other. This may be due to the stronger erosion that leads to a thinner film. The absence of pores may be explained by the use of BzAc as chelating agent in the sol formulation. Indeed, films elaborated from a similar sol in which BzAc was replaced by acetylacetone with the same molar ratio clearly exhibit larger pores on the surface as what we had already observed in previous works.2 The pores are likely to be much smaller with BzAc but this do not affect significantly the impregnation with silver salt in the next step of the process.


image file: c4ra08804b-f5.tif
Fig. 5 SEM images of films after (a) Soxhlet treatment, (b) EtOH bath under US and (c) RTA extraction. The scale bar is 200 nm.
IR annealing. In this case the optimization process aims at maximizing the Pluronic P123 removal without degrading the quality of PET. It is based on a Box–Behnken surface analysis design and led to the following optimized parameters: a power P of 26% of the maximum power, a heating time t of 28.8 min, and a number of pulses n of 6.

As previously, IR spectroscopy shows the disappearance of the peak at 2860 cm−1, which confirms the P123 removal (Fig. 4). The optimized process also allows completely degrading BzAc as shown with the transmittance spectra of Fig. 6, which means that the titania network is expected to be well polymerized and condensed. High resolution TEM measurements and electron diffraction on such samples didn't show any crystallization of the TiO2 matrix. TiO2 is therefore amorphous, as usually obtained in previous studies about the elaboration of mesoporous TiO2 on glass substrates for photochromic applications. However, contrary to what happened after the chemical treatments, the film thickness remains relatively high (Table 1), accrediting the role of ethanol on the titania dissolution during the chemical processes. As previously, the film adhesion remains a class 4B in spite of the presence of numerous cracks at the macroscopic level (Table 1); but the film does not peel even after several weeks. These cracks are likely to be caused by the rapid removal of P123, which strongly constrains the films. They mainly appear on the rapid processes. SEM characterizations show a surface similar to that obtained with chemical treatments. However, a little more pores are visible. Their diameter is about 5 nm or less (Fig. 5). Coating and IR annealing treatments don't significantly affect the flexibility of the substrate since the bending strength was measured at 38.7 ± 2 mN for bare PET and 39.9 ± 1.7 mN for coated PET after IR annealing. Variation between the two values is less than 5%. The measured resistance values in both cases remain very weak compare to the resistance of flexible paperboard of 220 g m−2 that is about 450 mN; the studied materials are therefore very flexible.


image file: c4ra08804b-f6.tif
Fig. 6 UV-vis transmittance spectra of coated films before and after IR annealing.
Comparison and perspectives. The three proposed treatments have proven to efficiently produce porous TiO2 films from a hybrid sol including the titania precursor and micelles of copolymer. They all resulted in a good degradation of BzAc and decomposition of P123 without damaging the PET substrate. The film adherence is very good. One of these treatments, IR annealing, is however much more efficient in term of elaboration time since it needs only 30 min against more than 24 h for the chemical treatments, since they are preceded by a long UV exposure. The latter could however be reduced if a higher intensity was provided. IR annealing gives rise to higher film thickness, to the release of few more pores on the top surface but also to a large amount of microscopic cracks. The latter are not observable by eye and do not significantly change the visual appearance of the samples. The IR process is therefore an interesting process for industrial purpose.

Photochromic behaviour

Mesoporous titania films resulting from chemical and physical treatments were impregnated with an ammoniacal silver nitrate solution in order to incorporate silver ions in the films porosity. To test their photochromic behavior successive reduction and oxidation reactions were induced by UV and visible laser exposures, respectively.

Reduction of the silver salt occurs when exciting the titania matrix under UV light. The intensity of the 244 nm wavelength laser flux was chosen at 0.11 W cm−2 not to degrade the PET properties. As the latter also absorbs UV light, a yellow colour corresponding to the PET degradation may appear when using higher intensities. The exposure time was chosen as the minimum time leading to the saturation level of the film absorbance in the visible. The growth of silver nanoparticles indeed gives rise to a localized surface plasmon resonance band centered at around 500 nm, whose amplitude increases during exposure and saturates when all silver salt is reduced, as already reported in previous studies carried out on glass substrates.1,2,5 The saturation level of the absorbance is obtained after 5 min on the chemically treated films, whatever the treatment used, and after 10 min on the IR annealed films (Fig. 8a). The maximum value of the absorbance at saturation is more or less correlated to the film thickness (Table 1) and therefore to the silver content in the film; the maximum absorbance increases a little for films resulting from sonication in EtOH and much more for films annealed with IR (Fig. 8b). The longer time needed to reduce silver in thicker films is likely to be due to the localized reduction of silver under exposure. 244 nm wavelength is strongly absorbed by titania and silver ions reduction usually occurs in the first 100 nm of the film top part under such a low incident intensity, as reported in other articles.25,26 The latter also showed that ionic species could migrate through the film to areas where they were depleted due to the local occurrence of the reduction process. This led to the formation of dense populations of silver nanoparticles in areas of maximum light intensity and to poor silver content in the dark areas.25,27 We also observed here the formation of silver nanoparticles mainly near the film top surface, in the first 80 nm as it is shown in Fig. 7b.26 HR TEM micrographs also highlight the presence of crystallized fcc metallic Ag nanoparticles in an amorphous matrix (Fig. 7c). SEM characterizations (Fig. 7a) better highlight the nanoparticle morphology on the film top surface. The nanoparticle size ranges from 20 to 90 nm on the top surface, whereas it varies between 2 and 11 nm within the film. In the case of IR annealing (Table 1), the thicker film forms a deeper silver ions reservoir from which silver takes more time to reach to the top surface where most of the laser-induced reduction occurs. This could explain the longer time needed to reach the absorbance saturation under UV exposure. As on previous experiments carried out on glass substrates,1,2,5 the localized surface plasmon resonance band of the UV treated films is quite large (Fig. 8a, spectrum after the first reduction) and is likely to result from an inhomogeneous NP size distribution. The spectra obtained on the different kinds of films are similar, only the resonance wavelength slightly shifts from 450 to 490 nm depending on the treatment. Whatever the considered film, the first UV reduction always leads to a higher and blue-shifted spectrum.


image file: c4ra08804b-f7.tif
Fig. 7 Electron microscopy characterization of IR annealed films after the first UV reduction treatment. (a) SEM image of the top surface, (b) TEM image of the cross-section, (c) HR TEM image exhibiting fcc structures of metallic Ag (4.079: lattice parameter).

image file: c4ra08804b-f8.tif
Fig. 8 (a) UV-vis spectra of IR annealed films after successive UV and visible exposures. (b) Absorbance at 488 nm for 5 cycles of UV/visible exposures for each kind of film.

The colored films were then illuminated with visible light to re-oxidize silver nanoparticles in order to regain a colorless state and assess the reversible photochromic behavior of the films. As already reported on glass substrates, the LSPR band progressively vanishes under exposure at 488 nm wavelength.1,2,26 And, as for UV exposures, there is an intensity threshold above which the visible laser exposure damages the PET substrate. Silver nanoparticles absorb visible light and it appears that they can heat high enough their surrounding medium to burn the PET substrate. For a given intensity, the temperature rise is known to increase with the absorption coefficient of the film.28 It is then expected to be higher for the IR annealed films. We indeed observed a degradation of the PET properties above 4.6 W cm−2 for the IR annealed films and 6.7 W cm−2 for the chemically treated films. It has to be noted that without silver within the films, visible laser exposures do not damage PET. We worked at these threshold intensity values to bleach the films more rapidly without degrading PET. The exposure time was chosen, as previously, as the minimum time leading to the sample bleaching, which means to the disappearance of the LSPR band. It was 10 min for the Soxhlet films, 15 min for the sonicated films and 20 min for the IR annealed samples. The higher the initial absorbance is, the longer the bleaching time. All kinds of samples give the same absorbance spectrum after bleaching (Fig. 8a, spectrum after the first oxidation).

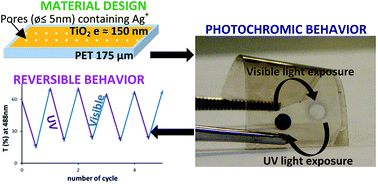
Then, five photochromic cycles including a reduction step and an oxidation step carried out in the same exposure conditions as the ones optimized on the first cycle were repeated. Fig. 8b shows the changes in the absorbance at 488 nm on each kind of sample after each exposure. From the second cycle, the results are quite reproducible whatever the kind of film. All films exhibit therefore a reversible photochromic behavior with a good contrast between the colored and colorless states as it can be seen on Fig. 9.


image file: c4ra08804b-f9.tif
Fig. 9 Picture of an IR annealed sample showing a reduced area (grey-brown circle) and an oxidized area (transparent circle).

Finally, the effect of flexibility of the substrate was checked. First reduction and oxidation were performed on a film coming from IR annealing. The sample was winded around a bar of 9 mm in diameter for 5 minutes. After that, second reduction and oxidation were done. UV-visible spectra after each step were measured. Similar results to those shown in Fig. 8a were obtained. Reduction and oxidation phenomena occurred after the roiling round step. Thus, the sample deformation does not alter the photochromic behaviour.

Conclusions

In summary, we developed nanocomposite TiO2:Ag films to functionalize PET substrates and give them a photochromic behavior. The films were deposited by spin coating and different processes were developed to avoid the thermal treatment incompatible with plastic materials. They were compared in terms of adhesion, thickness, porosity, optical properties and photochromism. The sol includes benzoyl-acetone as chelating agent to initiate the polymerization of the titania network under UV exposure instead of oven treatment. This UV treatment precedes the extraction of surfactant step by chemical processes. Two of them were optimized to remove P123 from TiO2 without damaging PET and they were compared to a rapid thermal process involving IR radiations, which was used to simultaneously polymerize the TiO2 network and remove P123. The latter appears to be faster and easier to implement than the previous ones; it leads to thicker films with a more pronounced color, after soaking in silver salt and growing embedded silver nanoparticles, but exhibit more cracks at the microscopic scale. However, the latter do not alter the film adherence that remains very good for all films. The photochromic properties of the three kinds of films are similar with a good contrast between the color and colorless states and a good reproducibility of the color transitions. We therefore demonstrate the possibility to elaborate flexible photochromic materials using simple and rapid processes. This opens the way to new applications for smart cards or goods packaging for which photochromism could be used for updatable data storage, or security features for instance.

Acknowledgements

The authors thank the French national research agency (ANR) for its financial support in the framework of projects PHOTOFLEX N° 12-NANO-0006. This research was made possible thanks to the facilities of the TekLiCell platform funded by the Région Rhône-Alpes (ERDF: European regional development fund) and The Materials Characterization Center of Grenoble INP.

References

  1. N. Crespo-Monteiro, N. Destouches, L. Bois, F. Chassagneux, S. Reynaud and T. Fournel, Adv. Mater., 2010, 22, 3166–3170 CrossRef CAS PubMed .
  2. L. Nadar, N. Destouches, N. Crespo-Monteiro, R. Sayah, F. Vocanson, S. Reynaud, Y. Lefkir and B. Capoen, J. Nanopart. Res., 2013, 15, 2048–2058 CrossRef .
  3. N. Crespo-Monteiro, N. Destouches and T. Fournel, Appl. Phys. Express, 2012, 5, 075803 CrossRef .
  4. N. Crespo-Monteiro, N. Destouches, L. Nadar, S. Reynaud, F. Vocanson and J. Y. Michalon, Appl. Phys. Lett., 2011, 99, 173106 CrossRef PubMed .
  5. L. Nadar, R. Sayah, F. Vocanson, N. Crespo-Monteiro, A. Boukenter, S. Sao Joao and N. Destouches, Photochem. Photobiol. Sci., 2011, 10, 1810–1816 CAS .
  6. C. Dahmen, A. N. Sprafke, H. Dieker, M. Wuttig and G. von Plessen, Appl. Phys. Lett., 2006, 88, 011923 CrossRef PubMed .
  7. R. Han, X. Zhang, L. Wang, R. Dai and Y. Liu, Appl. Phys. Lett., 2011, 98, 221905 CrossRef PubMed .
  8. K. Kawahara, K. Suzuki, Y. Ohko and T. Tatsuma, Phys. Chem. Chem. Phys., 2005, 7, 3851–3855 RSC .
  9. E. Kazuma and T. Tatsuma, Chem. Commun., 2012, 48, 1733–1735 RSC .
  10. K. Naoi, Y. Ohko and T. Tatsuma, Chem. Commun., 2005, 1288–1290 RSC .
  11. Y. Ohko, T. Tatsuma, T. Fujii, K. Naoi, C. Niwa, Y. Kubota and A. Fujishima, Nat. Mater., 2003, 2, 29–31 CrossRef CAS PubMed .
  12. Q. Qiao, X. Zhang, Z. Lu, L. Wang, Y. Liu, X. Zhu and J. Li, Appl. Phys. Lett., 2009, 94, 074104 CrossRef PubMed .
  13. C. J. Brinker, Y. Lu, A. Sellinger and H. Fan, Adv. Mater., 1999, 11, 579–585 CrossRef CAS .
  14. E. L. Crepaldi, G. J. d A. A. Soler-Illia, D. Grosso, F. Cagnol, F. Ribot and C. Sanchez, J. Am. Chem. Soc., 2003, 125, 9770–9786 CrossRef CAS PubMed .
  15. R. Fateh, A. A. Ismail, R. Dillert and D. W. Bahnemann, J. Phys. Chem. C, 2011, 115, 10405–104115 CAS .
  16. Z.-L. Hua, J.-L. Shi, L. Wang and W.-H. Zhang, J. Non-Cryst. Solids, 2001, 292, 177–183 CrossRef CAS .
  17. Q. Wei, Z.-R. Nie, Y.-L. Hao, L. Liu, Z.-X. Chen and J.-X. Zou, J. Sol-Gel Sci. Technol., 2006, 39, 103–109 CrossRef CAS .
  18. E. M. Wong, M. A. Markowitz, S. B. Qadri, S. L. Golledge, D. G. Castner and B. P. Gaber, Langmuir, 2002, 18, 972–974 CrossRef CAS .
  19. I. Recloux, M. Debliquy, A. Baroni, Y. Paint, A. Lanzutti, L. Fedrizzi and M.-G. Olivier, Appl. Surf. Sci., 2013, 277, 201–210 CrossRef CAS PubMed .
  20. V. Gâté, Y. Jourlin, F. Vocanson, O. Dellea, G. Vercasson, S. Reynaud, D. Riassetto and M. Langlet, Opt. Mater., 2013, 35, 1706–1713 CrossRef PubMed .
  21. G. E. P. Box and D. W. Benhken, Technometrics, 1960, 2, 455–475 CrossRef .
  22. G.-M. Gao, H.-F. Zou, D.-R. Liu, L.-N. Miao, S.-C. Gan, B.-C. An, J.-J. Xu and G.-H. Li, Fuel, 2009, 88, 1223–1227 CrossRef CAS PubMed .
  23. M. Khajeh, J. Food Compos. Anal., 2009, 22, 343–346 CrossRef CAS PubMed .
  24. P. G. de Gennes, Rev. Mod. Phys., 1985, 57, 827–863 CrossRef CAS .
  25. N. Destouches, Y. Battie, N. Crespo-Monteiro, F. Chassagneux, L. Bois, S. Bakhti, F. Vocanson, N. Toulhoat, N. Moncoffre and T. Epicier, J. Nanopart. Res., 2013, 15, 1422 CrossRef .
  26. N. Crespo-Monteiro, N. Destouches, T. Epicier, L. Balan, F. Vocanson, Y. Lefkir and J.-Y. Michalon, J. Phys. Chem. C, 2014, 118, 24055–24061 CAS .
  27. Y. Battie, N. Destouches, L. Bois, F. Chassagneux, N. Moncoffre, N. Toulhoat, D. Jamon, Y. Ouerdane, S. Parola and A. Boukenter, J. Nanopart. Res., 2010, 12, 1073–1082 CrossRef CAS .
  28. I. D. Calder and R. Sue, J. Appl. Phys., 1982, 53, 11 CrossRef PubMed .

This journal is © The Royal Society of Chemistry 2014