Fe(II)(aq) uptake of Mg(II)–Al(III)/Fe(III)–SO4/CO3 HTLCs under alkaline conditions: adsorption and solid state transformation mechanisms

Mario A. Gomez*a, M. Jim Hendrya, Samir Elouatikb, Joseph Essilfie-Dughana and Susanta Paikarayb
aDepartment of Geological Sciences, University of Saskatchewan, 114 Science Place, Saskatoon, Saskatchewan S7N 5E2, Canada. E-mail: mag346@mail.usask.ca; Tel: +1-306-2616246
bDepartment of Chemistry, University of Montreal, C.P. 6128, Succursale Centre-ville, Montreal, Quebec H3C 3J7, Canada

Received 17th August 2014 , Accepted 17th October 2014

First published on 17th October 2014


Abstract

Abiotic reduction of Mg(II)–Al(III)/Fe(III)–SO4/CO3 hydrotalcites (HTLCs) was investigated under three anoxic abiotic reaction conditions: (1) a target pH of 8 and 10 mM Fe(II)(aq), (2) a target pH of 8 and 0.5 mM Fe(II)(aq), and (3) a target pH of 10 and 0.5 mM Fe(II)(aq). Under both Fe(II)(aq) concentrations and at the targeted pH of 8, the greatest Fe(II)(aq) uptake, Mg(II)(aq) release, and least deviation in pH was observed for Fe-based HTLCs (Mg(II)–Fe(III)–SO4/CO3) irrespective of the interlayer ion (SO4 or CO3). In contrast, the Al-based HTLCs showed the greatest pH drift from the target pH of 8; this phenomenon was attributed to the remaining total Fe(II + III) in solution. At the target pH of 10 and 0.5 mM Fe(II)(aq), the pH of the Al-based HTLCs was greater than the Fe-based HTLCs despite 99% of the Fe(II) being removed from solution in both cases. The greatest Mg(II)(aq) release was again observed for the Fe-based HTLCs. Unique to these reaction conditions was the readsorption of the released Mg(II)(aq) by the Mg–Fe–CO3 HTLC. The major reaction phases produced from the adsorption of Fe(II)(aq) onto Mg(II)–Al(III)/Fe(III)–SO4/CO3 HTLCs were green rust (GR) and magnetite (MG). Two types of phase transformation mechanisms are suggested to occur during the adsorption of Fe(II)(aq) onto Mg(II)–Al(III)/Fe(III)–SO4/CO3 HTLCs, both dependent upon the metal ion (Al vs. Fe) and independent of the interlayer ions (SO4 or CO3). For Fe-based HTLCs (Mg–Fe–SO4/CO3), surface adsorption of Fe(II)(aq) and surface precipitation allows electron transfer (between Fe(II) ↔ Fe(III)) and subsequent atom exchange to occur at the surface as well as within the bulk HTLC structure. For the Al-based HTLCs (Mg–Al–SO4/CO3), this surface adsorption of Fe(II)(aq) and surface precipitation still occurs but electron transfer is limited to the precipitated surface phase due to the redox inactivity of the Al(III) groups in the HTLC structure.

1. Introduction

Hydrotalcites (HTLCs) are made up of hydroxycarbonates of Mg(II) and Al(III) with the common formula Mg6Al2(OH)16CO3·4H2O. This family of compounds can be described by the general formula [M(II)1−xM(III)(OH)2] (An)x/nmH2O, where M(II) and M(III) are di- or tri-valent metals, An is an interlayer anion, and x is the M(III)/M(III) + M(II) ratio. For example, pyroaurite is a variety of HTLC where Fe(III) occurs in the HTLC structure instead of Al(III). Many other cation–anion sequences (e.g., Mg(II) ↔ Co(II), Ni(II), Zn(II), Fe(II), Cu(II), Mn(II), Al(III) ↔ Fe(III), Cr(III) and CO3(-II) ↔ SO4(-II), NO3(-I) ↔ Cl(-I)) can exist in synthetic or natural systems.1–11 Since their discovery in 1842, HTLCs have attracted much attention in many multidisciplinary research fields (such as catalysis,1,4,7,12–15 surface science,1,9,10 organic-bio and inorganic synthesis,1,8,10–12 electrochemistry,10 mineralogy,1,5,6,11 soil science,1,2,6 and environmental engineering/science1,3,7,9,16–25) and been translated into industrial applications (chemical manufacturing, concrete production, pharmaceuticals and Uranium mining companies) because of their: (i) adsorption capacity; (ii) the cation-exchange ability of the brucite layer; (iii) the anion-exchange ability of the interlayer space; (iv) the tunable basicity of the surface, and (v) the control on toxic aqueous metals (e.g., As, Ni, Se) and radio-nucleotides in natural and anthropogenic (e.g., mine tailings) environments.

To date, the dominant research focus has been on improving understanding of the formation mechanism of HTLCs with mixed M(II)–M(III)–An ion solutions in compositional varieties (e.g., Ni(II)–Fe(III), Mg(II)–Fe(III), Zn(II)–Al(III), SO4(-II)–CO3(-II), CO3(-II)–Cl(-I))5,8,26,27 and/or HTLC formation from simple Al(III)/Fe(III) oxides/hydroxides (e.g., AlOH3, FeOH3, AlOOH, FeOOH).28,29 To the best of our knowledge, the phase transformation and abiotic anoxic reductive dissolution of HTLC phases under the influence of environmentally important metal ion species (e.g., Fe(II)(aq)) under anoxic geochemical conditions is not known. This is in contrast to the well-studied multi-element (e.g., As) control phases, including ferrihydrite (FH) and other Fe-oxy/hydroxides (e.g., lepidocrocite, LP; magnetite, MG; goethite, GT; hematite-HT) or Al-oxy/hydroxides (e.g., gibbsite, GB; alumina, AL).30–36 Recently, extended X-ray absorption fine structure (EXAFS) was used to show that Fe(II)–Al(III) layered double hydroxides can be formed at near neutral pH from Al2O3, clay (mica-montmorillonite), and amorphous silicate but not HTLC substrates.37,38 Thus, the objectives of this study were to investigate Fe(II)(aq) sorption onto the surface of Mg(II)–Al(III)/Fe(III)–SO4/CO3 HTLCs in alkaline abiotic anoxic environments and characterize any Fe(II)–Mg(II)–Al(III)/Fe(III)–SO4/CO3 phases that form. An additional objective was to investigate how the metal composition of the HTLC phase (Al ↔ Fe) and interlayer (SO4 ↔ CO3) ions affect the type of Fe(II)–Mg(II)–Al(III)/Fe(III)–SO4/CO3 phases formed via different types of formation mechanisms.

2. Experimental

2.1 Synthesis of Mg(II)–Al(III)/Fe(III)–SO4/CO3 hydrotalcites

Samples of Mg(II)–Al(III)/Fe(III)–SO4/CO3 HTLCs were prepared at room temperature (21 °C) using the co-precipitation method.9 In the case of the MgAlCO3 HTLC, for example, this involved adding a solution (via a peristaltic pump, rate 1000 mL h−1) containing MgCl2·6H2O and AlCl3 (in molar proportions to yield an M(II)/M(III) molar ratio of 2) to a solution containing 3.5 M NaOH and 0.95 M NaCO3 and mixing. The final pH of these solutions from which the solids precipitated was 13.4. In the case of MgFeCO3, MgAlSO4, and MgFeSO4 HTLCs, chemical grade reagents were used following the same procedure as described above.

The wet solids produced by precipitation were washed in deionized water (pH 5.5) five times to remove Cl impurities, then air dried for 24 h at ambient temperature. These solids were then characterized using inductively coupled plasma mass spectrometry (ICP-MS), X-ray diffraction (XRD), and micro-Raman spectroscopy to confirm the Mg(II)–Al(III)/Fe(III)–SO4/CO3 HTLC phases (Fig. S1a and Table S0). Dried samples from this batch were transferred to a glove box (UNIlab station from MBraun, Germany; 100% N2) for abiotic reduction tests (discussed below). For comparative purposes, GR, LP, GT, FH, MG, GB, boehmite (Bo[thin space (1/6-em)]:[thin space (1/6-em)]AlOOH), Mg(II)–Al(III)–Fe(III) containing-SO4–CO3 HTLCs (see Fig. S1b), and amorphous AlOH3 were also synthesized using published methods.30,36,39–41 Reagent grade MgO, MgOH2 (brucite), MgAl2O4, and Al2(SO4)3 from Sigma-Aldrich were also used as reference materials.

2.2 Abiotic batch reactions

Abiotic anoxic Fe(II) redox reactions of Mg(II)–Al(III)/Fe(III)–SO4/CO3 HTLCs were conducted in duplicate and in some cases triplicate (for phase confirmation) using Fe(II)SO4·7H2O (Fisher Scientific) as the Fe(II)(aq) catalyst. Fe(II)(aq) concentrations of 0.5 and 10 mM were chosen for further study (discussed below). The Fe(II)(aq) stock solution was made by dissolving the Fe(II)SO4·7H2O salt in deoxygenated deionized water (pH ∼6) to yield a 10 mM stock solution. Prior to using this stock solution to make the 0.5 mM solution, it was inspected after sitting overnight (12 h) to confirm the absence of any yellow colour (indicative of Fe(II) oxidation).42 A final confirmation that Fe(II)(aq) was active in solution was done using Fe+2 Quant Test Strips (Sigma-Aldrich). The presence of red and the degree of color saturation in the strip is indicative of the Fe+2–cyano complex that forms and the approximate concentration range, respectively; red colour was confirmed for both the 0.5 and 10 mM solutions and the degree of saturation was greater in the latter case. Fe(II)(aq) concentrations were inferred from measurements of the total Fe in solution via ICP-MS. In our initial reaction solutions, we assumed the amount of Fe(II)(aq) and the measured total Fe were the same; the solutions were prepared in the glove box where no Fe(III) was present and pure ferrous sulfate hydrated salt was used as the Fe(II)(aq) source. In the final solutions from the reactions, both Fe(III)(aq) and Fe(II)(aq) could exist due to the dissolution of the Mg(II)–Al(III)/Fe(III)–SO4/CO3 HTLCs and/or lack of total Fe(II)(aq) adsorption; thus, Fe(II)(aq) content could not be assumed from the total Fe content. Preliminary tests conducted using only the aqueous Fe(II) solutions (no Mg(II)–Al(III)/Fe(III)–SO4/CO3 HTLC solids) demonstrated the formation of undesirable precipitates (likely Fe(OH)2(s)) at concentrations >10 mM Fe(II)(aq) at pH 8 and >0.5 mM Fe(II)(aq) at pH 10 (Fig. S2). As such, subsequent experiments were only conducted at Fe(II)(aq) concentrations of 0.5 and 10 mM at pH 8 and 0.5 mM at pH 10. These pH values can be typical of natural and anthropogenic (e.g., mine tailings) environments but do not include the lower and neutral pH ranges.

The Mg(II)–Al(III)/Fe(III)–SO4/CO3 HTLCs, Fe(II)SO4·7H2O, and Ca(OH)2 (Sigma-Aldrich) as well as deoxygenated–deionized water (produced by bubbling with N2(g) for 2 h) were placed in the glove box for 3 days to scrub adsorbed or dissolved oxygen from solids or solutions prior to use. After this 3 days period, saturated lime water (our base) was created in the glove box by dissolving 10 g of solid reagent grade Ca(OH)2 (Sigma-Aldrich) in 1000 mL of the deoxygenated deionized water. To create the test solutions, 40 mL of the Fe(II)(aq) solution were transferred into 150 mL glass beakers, the pH adjusted with the lime water to the target pH (8 or 10 ± 0.1), and 400 mg of the desired Mg(II)–Al(III)/Fe(III)–SO4/CO3 HTLC solid then added. The pH was again measured and adjusted each day (if necessary) of the 7 days reaction period to maintain the target pH of 8 or 10. The reactions were allowed to proceed for 7 days to ensure completion of the reduction reactions and to emulate a Toxicity Characteristic Leaching Procedure (TCLP)-like leachability test on Fe, Al, and Mg.43 Similar reactions for Fe(III)/Al(III)-oxide/hydroxides occur in hours30,42 and, as such, a 7 days period was considered sufficient for our purposes. Reported pH ranges are the mean of duplicate tests.

One mL of aqueous sample was collected from each reaction vessel using a 10 cm3 syringe with a 0.02 μm filter (Whatman Inc.) on day 1, 2, 4, and 7 of the experiment and analyzed for total Fe, Mg, and Al via ICP-MS. All solution data reported here represent the total element concentration and are not partitioned into the possible redox states that may occur in solution (e.g., Fe(II) and Fe(III)). Concentrations or percentages reported for elements of interest in solution represent the mean of duplicate tests. After aqueous sample collection on day 7, the remaining solution was separated from the solid via decantation and the solid left inside the glove box to dry. Solids samples were then powdered using a mortar and pestle in the glove box and subsamples collected and stored for analysis using the elemental, molecular, and structural techniques described below. All experiments were conducted at ambient temperature.

Separate reactions at a target pH of 8 and 10 mM Fe(II)(aq) were conducted on the Mg(II)–Al(III)/Fe(III)–SO4/CO3 HTLCs and stopped after day 1 of the reaction period to characterize the solids in detail and the mechanism of formation of the reacted phases observed after day 7.

2.3 Analytical methods

Ambient X-ray diffraction and inert atmosphere (N2(g)) micro-Raman spectroscopic analyses were conducted on the initial and final (day 7) reacted solids (Mg(II)–Al(III)/Fe(III)–SO4/CO3 HTLCs). For XRD measurements, methanol (600 μL) was added to the ground dried powder subsamples to create a thin paste. This paste was then dropped onto a flat glass sample holder, evenly distributed, and allowed to dry. Measurements were conducted using a PANalytical Empyrean instrument with a rotating anode (2.7 kW) and a Co target (λ Co Kα = 1.7902 Å) using a graphite monochromator, operating at 40 kV and 45 mA. Scanning took place between 10 and 80 degrees 2θ with a 0.01 degree step and scan step time of 85 s. All XRD measurements were collected under ambient conditions as no inert environment cell was available. Phase detection limits for lab-based XRD generally range from 1–5 wt%.44

Phase identification was conducted using the Phase-ID function in X'pert HighScore Plus software and the corresponding Joint Committee on Power Diffraction Standards (JCPDS) database reference data for FH (PDF 98-007-6750 and 98-011-1017), LP (PDF 98-001-2041), GT (PDF 98-003-4786), MG (98-011-7729), fougerite/GR(CO3) (PDF 98-011-2393), and HT (PDF 98-011-9589). In addition, XRD analyses were conducted on commercial reagent grade GT (CAS no. 1310-14-1), LP (CAS no. 12022-37-6), and MG (CAS no. 1309-38-2).

Inert atmosphere micro-Raman spectroscopic analysis was conducted using a Renishaw InVia Raman microscope equipped with a polarized argon laser operating at 785 nm. The laser delivered 25 mW at the laser exit and 8 mW at the sample using the 20× long distance objective (pot size of ∼1 μm). Reacted samples as well as air-sensitive reference samples remained under inert anoxic conditions by placing them inside the Renishaw THMS 600 hot–cold cell with N2(g) sparged continuously during data collection at 25 °C (Fig. S3a). The high quality of the inert atmosphere Raman data was confirmed by the quality of data for our synthetic GR in comparison to literature Raman data.45,46 Five scans were collected from 150 to 1400 cm−1 and the average taken to improve the resolution and the statistics of the collected data; some data remained noisy irrespective of how many scans were taken or the duration of time over which they were acquired. The energy resolution was 4 cm−1 at the full width half maximum of the internal Si reference peak. The scans were collected at 10% of the laser output at the microscope exit to minimize radiation damage or local induced heat transformation of FH to HT or MG.47 The system was calibrated to the 520 cm−1 Si peak (for position and intensity) before data collection. Phase detection limits for micro-Raman are typically on the order of 1 wt%.48 Data collection and spectral treatment were performed with WiRE 2.0 software from Renishaw. For all samples, three to five random areas were probed to ensure that the phase(s) were consistent throughout the sample. The Raman data presented represent two spectra from the various spots probed in the final reacted 7 days samples that reflect the mixture of phases found throughout the reacted sample. Additional inert Raman data were collected on the reacted Mg(II)–Al(III)/Fe(III)–SO4/CO3 HTLCs at a target pH of 8, Fe(II)(aq) concentration of 10 mM, and after 1 day of reaction time.

Fe L-edge, Mg K-edge, and Al K-edge inert atmosphere X-ray absorption near edge structure (XANES) spectra were collected at the Canadian Light Source (CLS) on the spherical grating monochromator (SGM)49 11ID-1 beamline (ΔE/E: ∼10−4). To ensure our samples remained under anoxic conditions during testing, all powders (reacted and reference samples) were pressed onto carbon tape inside an anaerobic (N2(g)) glove box attached to the SGM X-ray absorption end station (Fig. S3b). XANES spectra were recorded using the medium and high energy gratings along with the surface sensitive total electron yield (TEY) and bulk sensitive fluorescence yield (PFY) detectors under high vacuum (5 × e−8 Torr). The entrance and exit slits were set at 50 × 50 μm. Note that the raw un-calibrated energy XANES data are presented in the text for relative energy comparison purposes whereas the energy calibrated data are presented in the ESI. The energy calibration was accounted for in our work to ensure that any shifts in the energy of the XANES data being interpreted were real and not due to beamline energy differences of samples analyzed on different dates (which at SGM-CLS can be up to ∼1 eV). Fe L-edge spectra were normalized using a single normalization method and the energy scale of our compounds calibrated to the main L3 peak of ferrihydrite occurring at 710.5 eV.50 Fe L-edge spectra were obtained from 696 to 740 eV using a coarse step size of 0.5 eV before the first edge and a smaller step of 0.1 eV at the main absorption edge(s). The same procedure and step size were followed for the Mg and Al K-edges but using energy ranges of 1290 to 1355 eV and 1555 to 1610 eV, respectively. Because the standards and reacted samples were run on different dates, the Al K-edge of AlSO4, AlOOH, AlOH3(GB), and AlOOH (Bo) were calibrated to the first intense peak of boehmite (AlOOH) at 1567.8 eV.51 Al K-edges of the reacted samples and Mg(II)–Al(III)–Fe(III) containing-SO4–CO3 HTLC standard were calibrated to the first intense peak of Mg–Al–CO3 HTLC at 1567.7 eV.51 Similarly, the Mg K-edges of the MgOH2, MgO, and MgAl2O4 standards were calibrated to the first intense peak of MgO at 1296.9,52 and the reacted samples and the Mg(II)–Al(III)–Fe(III) containing-SO4–CO3 HTLC standard were calibrated to the first peak of Mg–Al–CO3 HTLC at 1310.0 eV.53 To determine if the oxidation/redox and coordination states at the local Fe, Mg, and Al molecular environments of the reacted Mg(II)–Al(III)/Fe(III)–SO4/CO3 HTLCs changed,52–64 the Mg(II)–Al(III)/Fe(III)–SO4/CO3 HTLC reacted at the target pH of 8, for 7 days, and using 10 mM Fe(II)(aq) were analyzed using XANES surface (total electron yield, TEY) and bulk (fluorescence yield, FY; as partial fluorescence yield, PFY) sensitive analysis at the Fe L-edge, Mg K-edge, and Al K-edge. TEY is more surface sensitive than FY (even as PFY) because the sampling depth of TEY is ∼5–10 nm from the surface whereas that of FY is deep inside the bulk (≥50 nm) of the solids.65,66 This local sub-micron detection of elements of interest (e.g., Fe, Al, Mg) cannot be achieved by bulk micro techniques such as micro-Raman and XRD due to their inherently longer range wave probes and micro-scale penetration depths.

Bulk elemental analysis of all aqueous and solid samples was conducted using a Perkin-Elmer NexION 300D ICP-MS instrument with a relative standard deviation (RSD) of ±10%. Solid samples were digested in an acidic media (HF–HNO3), left overnight (12 h) to dissolve, and diluted accordingly for analysis of total Fe, Al, and Mg.67,68 All concentrations or percentages reported represent the mean of duplicate tests. For all tests, the Al leachability throughout the 7 days reaction period was always ≤0.3 mg L−1 (i.e., <0.002% of Al dissolved). As a result, Al leachability was deemed unimportant and is not discussed further. The percentage of Mg(II)(aq) released into solution from the solid and the remaining amount in the solid (100% – Mg(II)(aq) released) were calculated from the average greatest concentration of Mg(II)(aq) released in the solution for the 7 days period and the initial amount of Mg(II) in the solid (Tables S0–S3). A similar computation was performed for the percent Fe(II)(aq) remaining in solution after the 7 days reaction period (Tables S1–S3). Individual leachability data for all reaction conditions investigated are available in the ESI (Tables S4–S6).

3. Results and discussion

This section outlines the 7 days reaction behavior in terms of pH, total Fe adsorption, and Mg release as well as phase transformation characteristics of the Mg–Fe–CO3, Mg–Al–CO3, Mg–Fe–SO4, and Mg–Al–SO4 HTLCs under the three reaction conditions: a target pH of 8 and 10 mM Fe(II)(aq) [§3.1], a target pH of 8 and 0.5 mM Fe(II)(aq) [§3.2], and a target pH of 10 and 0.5 mM Fe(II)(aq) [§3.3]. We further probe the HTLCs via inert XANES analysis under the most aggressive phase changing conditions: a target pH of 8, 10 mM Fe(II)(aq), and a 7 days reaction time [§3.4]. Finally, we discuss the phase transformation mechanisms that arise as a result of the Fe(II)(aq) uptake [§3.5].

3.1 Reactions at pH 8 using 10 mM Fe(II)(aq)

In the reaction vessel containing only Mg–Fe–CO3 HTLC, the pH increased from the target of 8, resulting in an average pH range of 8.0 to 8.9 throughout the experiment (Fig. 1a). The majority (98%) of the total Fe concentration in solution (as Fe(II)(aq)) was removed within the first day of the reaction period; by day 7, an average of 99% had been removed (Fig. 1b and Table S1). Mg(II)(aq) release (similar to the Fe(II)(aq) uptake) was almost complete after the first day of reaction, increasing slightly during day 2 before remaining constant to the end of the reaction period. A total of 1.42% of the Mg(II) present in the initial solids was released into solution by day 7 (Fig. 1c). Powder XRD data and phase analysis using X'pert Highscore of the reacted greenish Mg–Fe–CO3 HTLC solid phase at day 7 (Fig. 2 and S4) indicated a considerable mass of unreacted Mg–Fe–CO3 HTLC as well as the presence of MG, GR, GT, LP, and lesser amounts of FH (always ≤5% within the error of the search match). Inert atmosphere micro-Raman analysis (Fig. 2 and S5) confirmed the presence of GR, MG, and the remaining Mg–Fe–CO3 HTLC. The presence of a GR phase was supported by Raman spectra that showed typical Fe+2–O and Fe+3–O stretches at 400–500 cm−1; MG was evident by the presence of a band at 665 cm−1.45,46 The pH range measured here for the formation of GR and MG (8.0–8.9) is consistent with literature values for Fe-oxy/hydroxides.45,46,69,70 This observed pH range is important because it provides a pH formation range for Mg(II)–Al(III)/Fe(III)–SO4/CO3 HTLC structures that have been unknown to date and demonstrates another family of structures from which GR and MG can precipitate.
image file: c4ra08802f-f1.tif
Fig. 1 Profiles of pH and leachability of the total aqueous Fe and Mg as a function of time for tests conducted at pH 8 for 7 days with 10 mM Fe(II)(aq). Time 0 days represents conditions before Mg(II)–Al(III)/Fe(III)–CO3/SO4 HTLC solids were added. Concentration units for (Fe) and (Mg) are mg L−1. Values reported are the average and standard deviation (error bars) of duplicate tests. Individual test data are provided in the ESI.

image file: c4ra08802f-f2.tif
Fig. 2 Powder X-ray diffraction spectra (left) and inert micro-Raman spectra (right) of Mg(II)–Al(III)/Fe(III)–CO3/SO4 solid products reacted at a target pH of 8 for 7 days with 10 mM Fe(II)(aq). Spectra of relevant standard materials (LP, GT, MG, FH, GR(SO4), Mg(II)–Al(III)–Fe(III) containing-SO4/CO3) are shown for comparison. For each reacted sample, two Raman spectra are presented to show the mixture of phases found in the reacted sample. This figure shows the observed bulk phase changes that occur upon the adsorption of Fe(II)(aq) ions on the Mg(II)–Al(III)/Fe(III) CO3/SO4 HTLC substrates at the noted reacting condition.

For the Mg–Al–CO3 HTLC, the pH deviated from the target of 8 (Fig. 1a and Table S1), but to a lesser extent than its Fe counterpart (Mg–Fe–CO3) discussed above. Although the final Fe(II)(aq) removal efficiency (at the end of the reaction period) was 99%, the amount of Fe(total) remaining in solution after the reaction period for Mg–Al–CO3 was greater than observed for Mg–Fe–CO3 (Fig. 1b). The relative amount of Mg(II)(aq) released was only 0.3% by day 7 (Fig. 1c) despite a significant amount of Fe(II)(aq) being removed from solution onto the Mg–Al–CO3 HTLC. The reason for the high Fe(II)(aq) removal and low corresponding release of Mg(II)(aq) observed under this reacting condition for the Mg–Al–CO3 is not known. The Mg(II)(aq) release behavior for the Mg–Al–CO3 HTLC differed from the Fe-based HTLC counterpart, with substantially less (64 vs. 343 mg L−1 at 7 days) Mg(II)(aq) released into solution (Fig. 1c and Table S1). Powder XRD of the final light green solids (Fig. S4) was dominated by the presence of the remaining Mg–Al–CO3 HTLC (Fig. 2). X'pert HighScore phase analysis showed the presence of MG, GR, GT, LP, and lesser amounts of FH. These phases were less obvious than in the Mg–Fe–CO3 HTLC counterpart. Micro-Raman analysis of the reacted samples showed the remaining unreacted Mg–Al–CO3 HTLC but also the presence of GR (Fig. 2 and S5). In this case, the GR phase was identified from an additional SO4 band in the reacted sample of the Mg–Al–CO3 HTLC that was not present in the starting material (Fig. 2 and S5). We attribute our observation of a GR(SO4) type as part of the reacted Mg–Al–CO3 HTLC product to our reacting Fe(II)(aq) solution being derived from a soluble sulfate salt (Fe(II)SO4·7H2O). Moreover, the inert micro-Raman data contained additional CO3 bands not derived from the starting Mg–Al–CO3 HTLC. We attribute this to the presence of a GR(CO3) phase (i.e., GR with CO3 and SO4 in the interlayer).

As observed in the Fe-based carbonate HTLC, the pH increased from the target of 8 to 8.2–8.9 for the Mg–Fe–SO4 HTLC (Fig. 1a and Table S1). Most of the Fe(II)(aq) was removed from solution by day 1, with 99% removed by day 7 (Fig. 1b). The total Mg(II)(aq) released into solution was 1.36% (Fig. 1c and Table S1). The Mg(II)(aq) release mostly occurred within the first day of reaction and slightly increased to a constant concentration by the end of the reaction period. This observation was consistent with its carbonate counterpart Mg–Fe–CO3. Powder XRD analyses showed the presence of the remaining unreacted HTLC as well as additional MG peaks (Fig. 2). A phase analysis search showed the presence of MG, GR, GT, LP, and lesser amounts of FH (always ≤5%). Inert micro-Raman analysis of the blue-greenish (Fig. 2 and S5) Mg–Fe–SO4 HTLC solids showed the presence of GR and MG (again, similar to its Fe carbonate counterpart). Literature values for the pH of formation for GR and MG were within our measured average range of 8.2–8.9 based on available Fe-oxy/hydroxide data45,46,69,70 and are consistent with the Mg–Fe–CO3 HTLC data above.

Finally, the measured average pH range for the Mg–Al–SO4 HTLC (7.5 to 7.7) was the lowest with respect to the target of 8 and the other HTLCs tested (Fig. 1a and Table S1). The amount of Fe(II)(aq) removed from solution for the Mg–Al–SO4 HTLC was also the lowest (81%) observed over the course of the 7 day experiment (Fig. 1b). Notably, in the case of the Mg–Fe–SO4 HTLC, the majority (99%) of the Fe(II)(aq) was removed from solution and the pH never fell below 8. As such, the decrease in pH observed in our reactions is attributed to the remaining Fe in solution forming acidic protonated aqueous Fe–SO4 complexes.71 Further evidence of this comes from a comparison of the Mg–Al–CO3 and Mg–Al–SO4 HTLCs; little to no Fe exists in solution to form these acidic aqueous Fe–SO4 complexes in the former and, as a result, the pH throughout the reaction period is ∼8 or above (Fig. 1 and Table S1). The Mg(II)(aq) release (0.2%) from the Mg–Al–SO4 HTLC was similar to its carbonate counterpart; this indicates that although the Fe(II)(aq) uptake can be large (99% for Mg–Al–CO3 and 81% for Mg–Al–SO4), the corresponding Mg(II)(aq) release for the Al-based HTLCs (CO3 or SO4) is low compared to the Fe-based HTLCs (CO3 or SO4). It is noted that although the Mg(II)(aq) release for the Al-based HTLCs (CO3 or SO4) is similar (0.2–0.3%, see Fig. 1c and Table S1), in the case of the MgAlSO4 here, the low Fe(II)(aq) removal (81%) maybe one reason for the observed low Mg(II)(aq) release. The Mg–Al–SO4 solids at the end of the reaction period took on a darker-bluish-green color on the surface than the lighter green solids observed for the Mg–Al–CO3 HTLC (Fig. S4). XRD analysis of samples from the end of the 7 day reaction period showed the presence of the remaining Mg–Al–SO4 HTLC but also an additional shoulder at 40° from MG (Fig. 2). Our XRD phase search again indicated the presence of MG, GR, GT, LP, and lesser amounts of FH in our reacted sample. Inert atmosphere micro-Raman analysis of the reacted samples showed the remaining unreacted Mg–Al–SO4 HTLC but also the presence of GR from the additional SO4 band (Fig. 2 and S5) not present in the starting Mg–Al–SO4 HTLC.

3.2 Reactions at a target pH of 8 using 0.5 mM Fe(II)(aq)

Tests discussed in this section used “trace” Fe(II)(aq) concentrations (0.5 mM). The lower concentrations of Fe(II)(aq) ions in solution resulted in a total Fe (as Fe(II)(aq)) uptake of 99% by all of the solid Mg(II)–Al(III)/Fe(III)–SO4/CO3 HTLCs after day 1, and this was maintained to the end of the 7 days reaction period.

For the Mg–Fe–CO3 HTLC, the measured average reaction pH was greater than the target of 8 and ranged from 9.0 to 9.1 (Fig. 3a and Table S2). Mg(II)(aq) release into solution was 0.21%, which is almost an order of magnitude less than for 10 mM Fe(II)(aq) (1.42%) despite both conditions yielding a 99% Fe(II)(aq) uptake (Fig. 2b and c, 3b and c and Tables S1 and S2). The difference in Mg(II)(aq) release was attributed to fewer Fe(II)(aq) ions available to exchange with the surface Mg(II) ions of the Mg–Fe–CO3 HTLC solids under trace Fe(II)(aq) conditions (Fig. 3b). This is in contrast to tests conducted at 10 mM in which more Fe(II)(aq) ions were available to exchange with the surface Mg(II) groups of the Mg–Fe–CO3 HTLC (Fig. 2 and 3). Phase analysis of the reacted Mg–Fe–CO3 HTLC using XRD and inert micro-Raman spectroscopy (Fig. 4) was dominated by the presence of the remaining Mg–Fe–CO3 HTLC, but an XRD peak at 35° suggested the presence of MG. Phase analysis via X'pert HighScore indicated the presence of unreacted Mg–Fe–CO3 HTLC along with MG, GT, LP, and FH (≤5%).


image file: c4ra08802f-f3.tif
Fig. 3 Profiles of pH and leachability of the total aqueous Fe and Mg as a function of time for tests conducted at pH 8 for 7 days with 0.5 mM Fe(II)(aq). Time 0 days represents conditions before Mg(II)–Al(III)/Fe(III)–CO3/SO4 HTLC solids were added. Concentration units for (Fe) and (Mg) are mg L−1. Values reported are the average and standard deviation (error bars) of duplicate tests. Individual test data are provided in the ESI.

image file: c4ra08802f-f4.tif
Fig. 4 Powder X-ray diffraction spectra (left) and inert micro-Raman spectra (right) of Mg(II)–Al(III)/Fe(III)–CO3/SO4 solid products reacted at a target pH of 8 for 7 days with 0.5 mM Fe(II)(aq). Spectra of relevant standard materials (LP, GT, MG, FH, GR(SO4), Mg(II)–Al(III)–Fe(III) containing-SO4/CO3) are shown for comparison. For each reacted sample, two Raman spectra are presented to show the mixture of phases found in the reacted sample. This figure shows the observed bulk phase changes that occur upon the adsorption of Fe(II)(aq) ions on the Mg(II)–Al(III)/Fe(III) CO3/SO4 HTLC substrates at the noted reacting condition.

The greatest pH deviation from the target of 8 using trace Fe(II)(aq) was observed for the Mg–Al–CO3 HTLC (average pH 9.0 to 9.7; Fig. 3a and Table S2). Consistent with the tests employing 10 mM Fe(II)(aq) and Mg–Al–CO3 HTLC, little to no Mg(II)(aq) was released into solution. The order of magnitude lower release of Mg(II)(aq) (Fig. 3b and c and Table S2) under trace Fe(II)(aq) conditions was also attributed to fewer ions available for exchange with surface Mg(II) of Mg–Al–CO3 HTLC. However, the Mg(II)(aq) release was always lower for Mg–Al–CO3 versus its Mg–Fe–CO3 counterpart for Fe(II)(aq) concentrations of both 0.5 and 10 mM. XRD and inert micro-Raman analysis (Fig. 4) of the final Mg–Al–CO3 HTLC only showed the presence of unreacted Mg–Al–CO3 HTLC with no evidence of any other common phases (e.g., MG, GR). Phase analysis with X'pert HighScore indicated the presence of MG, GT, LP, and FH but these were less evident than in the Mg–Fe–CO3 HTLC counterpart. This lack of sensitivity in the macro-bulk (XRD and micro-Raman) analysis was attributed to the small amount of Fe(II)–Fe(III)–SO4/CO3 phases that formed under trace Fe(II)(aq) conditions. In future studies, nano-techniques such as transmission electron microscopy (TEM)35 will be used to confirm these phase transformations.

In the case of the Mg–Fe–SO4 HTLC, the measured average pH range was 9.0 to 9.5 and 0.44% of Mg(II)(aq) was released into solution by the end of day 7 (Fig. 3 and Table S2). This behavior is very similar to its Mg–Fe–CO3 HTLC counterpart. Again, powder XRD and micro-Raman data showed only the presence of the remaining unreacted Mg–Fe–SO4 HTLC.

For the Mg–Al–SO4 HTLC (Fig. 3 and Table S2), the pH increased from 9.0 to 9.2 under trace Fe(II)(aq) conditions; this is in contrast to its behavior at high Fe(II)(aq) concentrations (10 mM), where it exhibited the greatest pH drift (to lower values) compared to all other HTLCs tested. After the 7 days reaction period, 0.02% of the Mg(II)(aq) was released from the reacted solid. This was one order of magnitude less than its Fe counterpart (Mg–Fe–SO4) but similar to its CO3 equivalent (Mg–Al–CO3) under the same reaction conditions. Powder XRD of the reacted sample was dominated by the presence of the remaining Mg–Al–SO4 HTLC (Fig. 4). In addition, MG peaks at 35° (weak shoulder) and 41° (shoulder) were detected. X'pert HighScore analyses indicated the presence of unreacted Mg–Al–SO4 HTLC, MG, GT, LP, and FH (≤5%) whereas inert micro-Raman analysis of the final reacted product showed only the presence of the unreacted Mg–Al–SO4 HTLC.

3.3 Reactions at a target pH of 10 using 0.5 mM Fe(II)(aq)

At the target pH of 10 and 0.5 mM (trace) concentrations of Fe(II)(aq), the solid Mg(II)–Al(III)/Fe(III)–SO4/CO3 HTLCs tested removed 99% of the initial Fe(II)(aq) during day 1 of the reaction period with no additional release by the end of day 7. These observations were consistent with those at the target pH of 8 and trace Fe(II)(aq).

The measured average reaction pH for the Mg–Fe–CO3 HTLC was below the target pH of 10 and ranged from 9.2 to 9.7 (Fig. 5a and Table S3) along with complete Fe(II)(aq) removal (Fig. 5b). Mg(II)(aq) release into solution was almost complete during day 1 of reaction (0.1%) after which it was removed (i.e., readsorbed by the reacted solid) to the end of day 7 (Fig. 5c). Approximately 10 times the mass released into solution on day 1 was adsorbed back onto the solid at later times. This Mg(II)(aq) readsorption behavior was not observed in any other test conducted. The XRD and inert micro-Raman data from day 7 only show the presence of the remaining unreacted Mg–Fe–CO3 HTLC (Fig. 6). These analyses were not sensitive enough to show phase transformation to other minerals (e.g., MG, GR), likely due to the small amount of Fe(II)–Fe(III)–SO4/CO3 phases formed under 0.5 versus 10 mM Fe(II)(aq) conditions regardless of pH.


image file: c4ra08802f-f5.tif
Fig. 5 Profiles of pH and leachability of the total aqueous Fe and Mg as a function of time for tests conducted at pH 10 for 7 days with 0.5 mM Fe(II)(aq). Time 0 days represents conditions before Mg(II)–Al(III)/Fe(III)–CO3/SO4 HTLC solids were added. Concentration units for (Fe) and (Mg) are mg L−1. Values reported are the average and standard deviation (error bars) of duplicate tests. Individual test data are provided in the ESI.

image file: c4ra08802f-f6.tif
Fig. 6 Powder X-ray diffraction spectra (left) and inert micro-Raman spectra (right) of Mg(II)–Al(III)/Fe(III)–CO3/SO4 HTLCs reacted solids at a target pH of 10 for 7 days with 0.5 mM Fe(II)(aq). Spectra of relevant standard materials (LP, GT, MG, FH, GR(SO4), Mg(II)–Al(III)–Fe(III) containing-SO4/CO3) are shown for comparison. For each reacted sample, two Raman spectra are presented to show the mixture of phases found in the reacted sample. This figure shows the observed bulk phase changes that occur upon the adsorption of Fe(II)(aq) ions on the Mg(II)–Al(III)/Fe(III) CO3/SO4 HTLC substrates at the noted reacting condition.

For the Mg–Al–CO3 HTLC (Fig. 5 and Table S3), the average measured reaction pH ranged from 9.9 to 10.0. As also observed at the target pH of 8 and 0.5 mM Fe(II)(aq), Fe removal efficiency was 99% for the Mg–Al–CO3 HTLC at a target pH of 10; in addition, the corresponding Mg(II)(aq) release was again substantially less for the Mg–Al–CO3 HTLC than its Mg–Fe–CO3 counterpart.

Similar to the Fe-based carbonate HTLC, the pH decreased from the target pH of 10 to 9.2–9.5 (Fig. 5 and Table S3) in the Mg–Fe–SO4 HTLC. Again, the decrease in pH was attributed to the remaining Fe in solution forming acidic protonated aqueous Fe–SO4 complexes.71 The Mg(II)(aq) released into solution was greater (0.27%) for the Mg–Fe–SO4 HTLC in comparison to its carbonate counterpart. Moreover, the Mg(II)(aq) released into solution for the Mg–Fe–SO4 HTLC remained in solution for the duration of the reaction period and was not readsorbed back onto the reacted solid phase as observed for the carbonate counterpart. Powder XRD analysis (Fig. 6) of the final reacted Mg–Fe–SO4 HTLC was dominated by the remaining unreacted Mg–Fe–SO4 HTLC. Similarly, inert micro-Raman analyses of the reacted sample (Fig. 6) showed only the presence of the remaining Mg–Fe–SO4 HTLC.

Finally, for the Mg–Al–SO4 HTLC (Fig. 5 and Table S3), the measured average pH (9.7 to 10.1) was close to the target of 10, similar to the carbonate counterpart (Mg–Al–CO3 HTLC). The pH behavior of the Al HTLC under these more alkaline conditions was again consistent with the suggestion that remaining Fe in solution is the main cause of the pH decrease from the target pH. The Mg(II)(aq) released in solution from the Mg–Al–SO4 HTLC was very low to insignificant (0.001%), analogous to its carbonate equivalent. Both XRD and micro-Raman analysis of the final reacted samples were dominated by the presence of the remaining Mg–Al–SO4 HTLC (Fig. 6).

3.4 XANES analysis of HTLCs at a target pH of 8 and 10 mM Fe(II)(aq)

The reaction tests described above show that the phase transformation behavior and the corresponding uptake of Fe(II)(aq) from solution and release of Mg(II)(aq) into solution from the surface of the HTLCs are a function of pH, Fe(II)(aq) concentration, and the type of Mg(II)–Al(III)/Fe(III)–SO4/CO3 HTLC. The most dramatic change in terms of phase transformation and corresponding uptake of Fe(II)(aq) and Mg(II)(aq) release into solution for all Mg(II)–Al(III)/Fe(III)–SO4/CO3 HTLCs occurred at a target pH of 8 with 10 mM Fe(II)(aq) (§3.1). While ∼99% of the Fe(II)(aq) was removed from solution after day 1 for all of the Mg(II)–Al(III)/Fe(III)–SO4/CO3 HTLCs, only solids for the final (day 7) reaction products were characterized. Therefore, we needed to clarify if the observed phase transformation to GR and MG occurred immediately upon removal of Fe(II)(aq) from solution (after day 1) and if the same phase(s) remained after day 7. Inert micro-Raman analyses (Fig. 7) show the formation of both GR and MG after day 1 of the reaction period for all Mg(II)–Al(III)/Fe(III)–SO4/CO3 HTLCs. This observation suggests that the reaction products form on day 1 and remain stable through to the end of the reaction period.
image file: c4ra08802f-f7.tif
Fig. 7 Inert micro-Raman spectra of the Mg(II)–Al(III)/Fe(III)–CO3/SO4 HTLCs reacted at a target pH of 8 for 0 days, 1 day, and 7 days with 10 mM Fe(II)(aq) compared to standard green rust (SO4) and magnetite. The squares and circles in the reacted Mg–Al–CO3/SO4 HTLCs highlight the sulfate and carbonate bands, respectively.

For the reacted Mg–Fe–SO4/CO3 HTLCs, the presence of GR, MG, and unreacted Mg–Fe–SO4/CO3 HTLCs was clearly evident from the bulk inert micro-Raman and XRD data. However, such data for the reacted Mg–Al–SO4/CO3 HTLCs were less definitive. Macro-bulk techniques (e.g., XRD and micro-Raman) provide data that represent a combination of all phases present within the probing spot of the laser or X-ray source. Therefore, TEY and PFY Fe L-edge XANES were employed to gain insight into the local Fe molecular environment in the Mg(II)–Al(III)/Fe(III)–SO4/CO3 HTLCs under abiotic reductive dissolution.

The surface sensitive TEY Fe L-edge of the 7 day reacted Mg–Fe–SO4/CO3 HTLCs indicated the presence of Fe(III) and Fe(II) characters, as expected from the combination of GR, MG and unreacted Mg–Fe–SO4/CO3 HTLCs (Fig. 8). Moreover, the sharp pre-peak at low energy (∼705 eV) typical of an octahedral low spin Fe(III) compound61,72 was not present in the reacted Mg–Fe–SO4/CO3 HTLCs. These data suggest that the Fe(III) of the reacted Mg–Fe–SO4/CO3 HTLCs remains in a paramagnetic high spin state with an octahedral crystal field.59,60 Thus, electron repulsions should dominate ligand field effects and a weak field with a small Δo should exist. In addition, Fe(III) in the reacted Mg–Fe–SO4/CO3 HTLCs should have an anti-ferromagnetic character as observed for hematite.73 Based on the above observations, the Fe(III) metal–ligand coordination of the reacted Mg–Fe–SO4/CO3 HTLCs should remain in a six-fold environment as it does in unreacted HTLCs.11,74,75 We confirmed the presence of an Fe(II) environment in the reacted samples (as GR), but detailed information on its specific coordination and electronic state could not be determined as readily as for the Fe(III) species based on the Fe L-edge XANES spectral structure. However, the confirmed formation of GR in the reacted Mg–Fe–SO4/CO3 HTLCs along with the inert micro-Raman and Fe L-edge TEY XANES data allow us to presume that the Fe(II) cations should have an octahedral hydroxyl coordination as found in the GR (SO4 and CO3) crystal structure.76–78 No clear evidence of Fe(II) tetrahedral ions was noted for the Mg–Fe–SO4/CO3 HTLC reacted products, as has been observed in CaBaFe4O7 mixed-valent transition metal oxides.64 PFY Fe L-edge XANES measurements (Fig. 8) suggest that the spectra of the reacted Mg–Fe–SO4/CO3 HTLCs had more of a Fe(III) character and did not exhibit clear evidence of Fe(II) as noted in the surface sensitive TEY measurements. The Fe(III) character evident in the more bulk range analyses was attributed to the unreacted Mg–Fe(III)–SO4/CO3 HTLCs left over at the end of the reaction period (consistent with the longer range bulk XRD data). Although the macro-bulk (micro-Raman and XRD; Fig. 2) data of the reacted Mg–Al–SO4/CO3 HTLCs showed some presence of GR/MG in addition to the unreacted Mg–Al–SO4/CO3 HTLCs, evidence of surface Fe(II)–Fe(III)–SO4/CO3 phases is required. Fe L-edge TEY measurements show the presence of an Fe phase on these Mg–Al–SO4/CO3 HTLCs (Fig. S6). The Fe phase observed for the reacted Mg–Al–SO4/CO3 HTLCs exhibited an Fe(III) character as well as some Fe(II) character, similar to that observed for the reacted Mg–Fe–SO4/CO3 HTLCs (Fig. 8 and S6). Finally, reference Fe L-edge XANES spectra of GR are rare57 despite its wide occurrence. To date, only one report of XANES spectra of GR similar to our surface sensitive TEY measurements has been published57 with no consideration given to the nature of its bulk structure. From Fig. 8, the bulk spectra of GR is clearly very distinct from its surface TEY counterpart. In particular, the Fe L3-edge (∼708 eV) of the bulk PFY XANES GR spectra exhibited only Fe(III) characteristics while the smaller Fe L2-edge (∼721 eV) showed only Fe(II) characteristics. This suggests that, although the GR surface is rich in Fe(II) characteristics, the bulk of its structure has a mixed Fe(III)–Fe(II) character; this observation has not been reported to date via redox sensitive XANES analysis. The difference in valency characteristics of the bulk and surface may explain the high reactivity and valency exchange properties at the GR surface.


image file: c4ra08802f-f8.tif
Fig. 8 Fe L-edge (a) TEY (surface) and (b) PFY (bulk) spectra of the MgFeCO3 and MgFeSO4 HTLCs reacted at a target pH of 8 for 7 days with 10 mM Fe(II)(aq) compared to standard green rust (GR) and ferrihydrite (FH).35 The Fe(II) character of the reacted MgFeCO3 and MgFeSO4 HTLCs is highlighted by red circles. The energy scale presented in these spectra is relative.

The Mg and Al K-edge of Mg–Al–CO3 are reported in the literature52–57 and these were compared with spectra from our Mg(II)–Al(III)/Fe(III)–SO4/CO3 HTLCs reaction products (Fig. 9). The Mg K-edge (Fig. 9a and c) of the reference MgAl2O4 sample showed a typical IV-fold Mg(II) coordination environment while our MgO, MgOH2, and Mg(II)–Al(III)–Fe(III) containing-SO4–CO3 HTLCs displayed a typical VI-fold Mg(II) coordination environment. The reacted Mg(II)–Al(III)/Fe(III)–SO4/CO3 HTLCs retained their VI-fold coordination and HTLC-like environment in both the surface (TEY, Fig. 9a) and bulk (PFY, Fig. 9c) measurements. However, the highest Mg K-edge peaks in the reacted Mg–Fe–SO4/CO3 HTLCs were shifted to lower energy and were sharper than those from the reacted Mg–Al–SO4/CO3 HTLCs. This effect is evident in the surface TEY measurements. According to Mg K-edge XANES theory, the absorption at this edge arises from the electron transition from the 1s to 3p orbital and is observed mainly in the near edge. The energy level of Mg 3p in the Mg–O4 tetrahedron (Td) is lower than in the Mg–O6 octahedron (Oh). Furthermore, the energy level of a distorted octahedron becomes greater than a non-distorted Oh octahedron because of broadening and/or splitting of the 3pσ* state. Thus, the Mg K-edge energy position directly reflects the coordination number and/or ionicity (electronic state). As noted above, Mg(II)(aq) release for the Fe-based HTLCs was substantially greater than for the Al-based HTLCs. Therefore, the changes in Mg K-edge XANES (Fig. 9a–c) of the Al- vs. Fe-based HTLCs were attributed to differences in Mg(II) surface dissolution and Fe(II)(aq) uptake. The formation of distorted Mg(II) surface sites on the reacted HTLCs is less pronounced for the Fe-based HTLCs (lower energy Mg K-edge) because the HTLC structure balances the Fe(II)(aq) surface uptake via a corresponding Mg(II)(aq) release into solution. In the Al-based HTLCs, Fe(II)(aq) uptake was great (81–99%) but Mg(II) release from the HTLC surface was not sufficient to alleviate the surface stress of the Fe(II)(aq) uptake. As such, the Mg K-edge of the reacted Mg–Al–SO4/CO3 HTLCs was observed at a higher energy. Although similar trends were observed for the bulk PFY Mg K-edge XANES (Fig. 9c), the effects were more obvious in the surface TEY XANES measurements.


image file: c4ra08802f-f9.tif
Fig. 9 Mg and Al K-edge TEY (a and b, surface) and PFY (c and d, bulk) XANES spectra of the Mg(II)–Al(III)/Fe(III)–CO3/SO4 HTLCs reacted at a target pH of 8 for 7 days with 10 mM Fe(II)(aq) compared with standards: Mg(II)–Al(III)–Fe(III) containing-SO4–CO3 HTLC, MgO, MgOH2 (brucite), MgAl2O4, Al2(SO4)3, AlOOH (Bo: Boehmite), AlOH3 (GB: Gibbsite), and AlOH3 (amorphous). The energy scale presented in these spectra is relative.

Finally, we investigated the Al K-edge XANES of the reacted Mg(II)–Al(III)/Fe(III)–SO4/CO3 HTLCs relative to some reference compounds (Fig. 9b and d). Again, our reference AlOH3(gibbsite), AlOH3(amorphous), AlOOH(diaspore), and Mg(II)–Al(III)–Fe(III) containing-SO4–CO3 HTLCs showed a typical VI-fold Al(III) coordination environment. Although we present an experimental IV-fold Al(III) coordination spectra for albite (NaAlSi3O8), its single sharp peak at lower energies (1566 eV) is recognized and discussed here based on literature data.53–56 In general, the reacted Mg(II)–Al(III)/Fe(III)–SO4/CO3 HTLCs retained their VI-fold Al(III) coordination and HTLC-like environment in both the surface (TEY) and bulk (PFY) measurements with no evidence of any IV-fold Al(III) coordination environment. This was in agreement with the solution measurements in which no significant Al dissolution from any of the Mg–Al–SO4/CO3 HTLCs was observed.

3.5 Adsorption and solid state phase transformation mechanisms (Al vs. Fe HTLCs): environmental implications

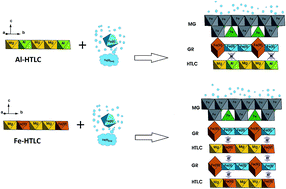
When combined, data from the XANES analyses relating to the local Fe, Mg, and Al redox and coordination environment of the reacted Mg(II)–Al(III)/Fe(III)–SO4/CO3 HTLCs, the bulk phase characterization (XRD and inert micro-Raman), and the solution analysis suggest two types of phase formation mechanisms occur upon the uptake of Fe(II)(aq) (Fig. 10). In the case of the Fe-based HTLCs (Mg–Fe–SO4/CO3), phase formation occurs via adsorption of the Fe(II)(aq) ions (and corresponding Mg(II)(aq) release into solution) on the surface (detected via TEY-XANES) of the Fe-based HTLCs, resulting in layers of Fe(II)–Fe(III) layered double hydroxides in the form of GR (detected via inert micro-Raman and XANES). These Fe(II)–Fe(III) layer phases (i.e., GR) then transfer electrons between Fe(II)–Fe(III) HTLC sites to form the more thermodynamically stable MG phase not only at the surface but also within the bulk structure (as observed in bulk macro characterization techniques such as inert micro-Raman). To date, such processes have only been recorded for Fe(III) hydroxides-oxides.30–32,36,79–83 For Fe(III) hydroxides-oxides, a hypothesized electron transfer and atom exchange (ETAE) between the Fe(II)(aq) ions and the surface of the Fe(III) hydroxide-oxide solids (in our case, Mg–Fe–SO4/CO3 HTLCs) promotes their recrystallization into more crystalline and thermodynamically stable Fe(III)–Fe(III)/Fe(III)–Fe(II) phases (in our case, Fe(II)–Fe(III)–Mg(II)–Fe(III)/Al(III)–SO4/CO3), such as GR, MG, LP, GT, and FH.30–32,36,79–83 In the case of the Al-based HTLCs (Mg–Al–SO4/CO3), the phase formation occurs via Fe(II)(aq) adsorption, likely as double hydroxyl layers of Fe(II)–Fe(III) (i.e., GR) and/or Fe(II)–Al(III)37,38 layered double hydroxides on the surface of the reacted Mg–Al–SO4/CO3 HTLCs. These surface layers of Fe(II)–Fe(III) layered double hydroxides (as GR, detected via inert micro-Raman and XANES) then transform to the more thermodynamically stable MG phase. In this case, because Al(III) is not a readily redox sensitive element (such as Fe(III)), the ETAE between the Fe(II)(aq) ions and the surface of the Mg–Al–SO4/CO3 HTLC does not proceed throughout the bulk and is restricted to the surface deposited Fe(II)–Fe(III) and/or Fe(II)–Al(III) species.
image file: c4ra08802f-f10.tif
Fig. 10 Fe(II)(aq) uptake and phase transformation mechanisms of (a) Mg–Fe–SO4/CO3 and (b) Mg–Al–SO4/CO3 HTLCs under abiotic anoxic conditions. Although both cases have similar first adsorption steps and green rust (GR)/magnetite (MG) phase formation, electron transfer between the redox sensitive elements (Fe(III) vs. Al(III)) in the Mg(II)–Al(III)/Fe(III)–SO4/CO3 HTLCs ultimately determines whether phase transformation occurs only at the surface or deeper into the bulk. All Mg(II)–Al(III)/Fe(III)–SO4/CO3 HTLCs, GR, and MG structures depicted are from literature crystallographic data74,76–78 and for all cases the interlayer ions are omitted from the structures because they do not play a significant role in the mechanisms.

Under the conditions considered, the formation of secondary Fe(II)–Fe(III)/Al(III)–SO4/CO3 HTLC-like phases form as Fe(II)(aq) reacts with Mg(II)–Al(III)/Fe(III)–SO4/CO3 HTLC solids. The findings herein suggest two types of formation phase mechanisms via Fe(II)(aq) uptake. Fe(II)(aq) removal and precipitation is fast (∼99% removal in day 1), and the capacity for Fe(II) sorption is not limited by the available reactive surface sites as is the case for Fe(III)/Al(III)-oxy/hydroxides. The only exception to this was observed for the MgAlSO4 at a target pH of 8 and 10 mM Fe(II)(aq). As such, the formation of Fe(II)–Fe(III)/Al(III)–SO4/CO3 HTLC-like phases will not only affect either Fe(II) speciation and its solubility or, more importantly, retention and speciation of divalent metals (e.g., Zn, and Ni) as well as contaminants (As, Se, Mo, Ni, U) present (e.g., on Mg(II)–Al(III)/Fe(III)–SO4/CO3 HTLC solids).19–22,24,25,84 It is well documented85–89 that Fe(II)/Fe(III) double layer hydroxide species such as GR (fougerite) and other Fe(II)-containing phases such as siderite (FeCO3) can have an effect on the retention and valency of redox sensitive contaminants (e.g., As(V), Cr(VI), and Se(VI)) in the environment. As a result, we can infer that the GR phases formed from our Mg(II)–Al(III)/Fe(III)–SO4/CO3 HTLC substrates may also exhibit some type of valency reactivity of redox sensitive contaminants. To date, only controls on geochemical and environmentally important elements of concern (e.g., As) by Fe(III)-oxy/hydroxide (e.g., ferrihydrite, goethite, hematite) or Al(III)-oxy/hydroxides under anoxic abiotic (via Fe(II)(aq)) reductive dissolution have been reported. However, this study provides evidence for the first time of: (1) the abiotic (via Fe(II)(aq)) anoxic reductive dissolution of Mg(II)–Al(III)/Fe(III)–SO4/CO3 HTLCs, (2) unrecognized secondary Fe(II)–Al(III)/Fe(III)–SO4/CO3 mineral phase formation mechanisms, and (3) GR and MG formation from non Fe-oxide/hydroxide substrates. These mechanisms are dependent upon the metal HTLC substrate (Al vs. Fe) that may in turn strongly influence the biogeochemical cycling of Fe and trace metal(loid)s in (periodically) suboxic and anoxic geochemical systems. Something that remains to be investigated is how the presence of adsorbed ions of elements of concern (e.g., AsO4, MoO4) on HTLCs affects the behavior observed here for a “clean” surface (no adsorbed elements of concern). For example, the presence of As on Fe(III)-oxy/hydroxide (e.g., ferrihydrite, goethite, hematite) and/or Al(III)-doped Fe(III)-oxy/hydroxide inhibits phase transformation and crystallization to more thermodynamic stable phases.30,31,35,42,90–94 However, no such data exist for Mg(II)–Al(III)/Fe(III)–SO4/CO3 HTLCs.

Acknowledgements

Financial support was provided by Cameco Corporation and the Natural Sciences and Engineering Research Council of Canada (NSERC) through a Senior Industrial Research Chair to MJH. Assistance received from F. Nelson, J. Fan, J. Lin, and T. Bonli (Geological Sciences) and the SGM/CLS staff (T. Regier, J. Dynes, and D. Chevrier) is kindly acknowledged.

Notes and references

  1. F. Cavani, F. Trifirò and A. Vaccari, Catal. Today, 1991, 11, 173 CrossRef CAS.
  2. C. Forano, T. Hibino, F. Leroux and C. Taviot-Gueho, Layered double hydroxides, in Handbook of Clay Science, ed. F. Bergaya, B.K.G. Theng and G. Lagaly, Elsevier Ltd., 2006, p. 1021 Search PubMed.
  3. R. L. Frost, A. W. Musumeci, J. T. Kloprogge, M. O. Adebajo and W. N. Martens, J. Raman Spectrosc., 2006, 37, 733 CrossRef CAS.
  4. B. Grégoire, C. Ruby and C. Carteret, Dalton Trans., 2013, 42, 15687 RSC.
  5. W. Li, K. J. T. Livi, W. Xu, M. G. Siebecker, Y. Wang, B. L. Phillips and D. L. Sparks, Environ. Sci. Technol., 2012, 46, 11670 CrossRef CAS PubMed.
  6. C. A. Johnson and F. P. Glasser, Clays Clay Miner., 2003, 51, 1 CrossRef CAS.
  7. P. J. Sideris, U. G. Nielsen, Z. Gan and C. P. Grey, Science, 2008, 321, 113 CrossRef CAS PubMed.
  8. K. Rozov, U. Berner, C. Taviot-Gueho, F. Leroux, G. Renaudin, D. Kulik and L. W. Diamond, Cem. Concr. Res., 2010, 40, 1248 CrossRef CAS PubMed.
  9. S. Paikaray and M. J. Hendry, Appl. Surf. Sci., 2012, 263, 633 CrossRef CAS PubMed.
  10. Q. Wang and D. O'Hare, Chem. Rev., 2012, 112, 4124 CrossRef CAS PubMed.
  11. H. F. W. Taylor, Mineral. Mag., 1973, 39, 377 CAS.
  12. M. R. Sturgeon, M. H. O'Brien, P. N. Ciesielski, R. Katahira, J. S. Kruger, S. C. Chmely, J. Hamlin, K. Lawrence, G. B. Hunsinger, T. D. Foust, R. M. Baldwin, M. J. Biddy and G. T. Beckham, Green Chem., 2014, 16, 824 RSC.
  13. D. P. Debecker, E. M. Gaigneaux and G. Busca, Chem.–Eur. J., 2009, 15, 3920 CrossRef CAS PubMed.
  14. B. F. Sels, D. E. De Vos, M. Buntinx, F. Pierard, A. Kirsch-De Mesmaeker and P. A. Jacobs, Nature, 1999, 400, 855 CrossRef CAS PubMed.
  15. B. F. Sels, D. E. De Vos and P. A. Jacobs, Catal. Rev.: Sci. Eng., 2001, 43, 443 CAS.
  16. L. Yang, Z. Shahrivari, P. K. T. Liu, M. Sahimi and T. T. Tsotsis, Ind. Eng. Chem. Res., 2005, 44, 6804 CrossRef CAS.
  17. L. Cocheci, R. Pode, E. Popovici, E. Dvininov and A. Iovi, Environ. Eng. Manage. J., 2009, 8, 865 CAS.
  18. R. Liu, R. L. Frost and W. N. Martens, Water Res., 2009, 43, 1323 CrossRef CAS PubMed.
  19. K. Grover, S. Komarneni and H. Katsuki, Water Res., 2009, 43, 884 CrossRef PubMed.
  20. T. Türk, Í. Alp and H. Deveci, J. Hazard. Mater., 2009, 171, 665 CrossRef PubMed.
  21. G. B. Douglas, L. A. Wendling, R. Pleysier and M. G. Trefry, Mine Water Environ., 2010, 29, 108 CrossRef CAS PubMed.
  22. M. A. Gomez, M. J. Hendry, J. Koshinsky, J. Essilfie-Dughan, S. Paikaray and J. Chen, Environ. Sci. Technol., 2013, 47, 7883 CrossRef CAS PubMed.
  23. S. Nishimura, A. Tagaki and K. Ebitani, Green Chem., 2013, 15, 2026 RSC.
  24. G. Douglas, M. Shackelton and P. Woods, Appl. Geochem., 2014, 42, 27 CrossRef CAS PubMed.
  25. S. Paikaray, M. J. Hendry and J. Essilfie-Dughan, Chem. Geol., 2013, 345, 130 CrossRef CAS PubMed.
  26. M. Jobbagy, M. A. Blesa and A. E. Regazzoni, J. Colloid Interface Sci., 2007, 309, 72 CrossRef CAS PubMed.
  27. S. Paikaray and M. J. Hendry, Appl. Clay Sci., 2014, 88–89, 111 CrossRef CAS PubMed.
  28. Y. Yang, X. Zhao, Y. Zhu and F. Zhang, Chem. Mater., 2012, 24, 81 CrossRef CAS.
  29. S. Paikaray, M. A. Gomez, M. J. Hendry and J. Essilfie-Dughan, Appl. Clay Sci., 2014, 101, 579–590 CrossRef CAS PubMed.
  30. C. M. Hansel, S. G. Benner and S. Fendorf, Environ. Sci. Technol., 2005, 39, 7147 CrossRef CAS.
  31. L. Yang, C. I. Steefel, M. A. Marcus and J. R. Bargar, Environ. Sci. Technol., 2010, 44, 5469 CrossRef CAS PubMed.
  32. R. M. Handler, B. L. Beard, C. M. Johnson and M. M. Scherer, Environ. Sci. Technol., 2009, 43, 1102 CrossRef CAS.
  33. D. E. Latta, J. E. Bachman and M. M. Scherer, Environ. Sci. Technol., 2012, 46, 10614 CrossRef CAS PubMed.
  34. J. A. Frierdich and J. G. Catalano, Environ. Sci. Technol., 2012b, 46, 1519 Search PubMed.
  35. M. A. Gomez, M. J. Hendry, A. Hossain, S. Das and S. Elouatik, RSC Adv., 2013, 3, 25812 RSC.
  36. G. C. Murray and D. Hesterberg, Soil Sci. Soc. Am. J., 2006, 70, 1318 CrossRef CAS.
  37. E. J. Elzinga, Environ. Sci. Technol., 2012, 46, 4894 CrossRef CAS PubMed.
  38. Y. Zhu and E. J. Elzinga, Environ. Sci. Technol., 2014, 46, 4894 Search PubMed.
  39. R. M. Cornell and U. Schwertmann, Cation substitution, in The iron oxides: structure, properties, reactions, occurrence and uses, VCH, Weinheim, Germany, 1996, pp. 35–52 Search PubMed.
  40. J. Pérez-Ramírez, S. Abelló and N. M. van der Pers, Chem.–Eur. J., 2007, 13, 870–878 CrossRef PubMed.
  41. Y. Liu, D. Ma, R. A. Blackley, W. Zhou, X. Han and X. Bao, J. Phys. Chem. C, 2008, 112, 4124 CAS.
  42. H. D. Pedersen, D. Postma and R. Jakobsen, Geochim. Cosmochim. Acta, 2006, 70, 4116 CrossRef CAS PubMed.
  43. US-EPA, Developments for In Situ Treatment of Metal Contaminated Soils, 1997, http://www.clu-in.org/download/remed/metals2.pdf Search PubMed.
  44. D. L. Bish and S. J. Chipera, Accuracy in quantitative X-ray powder diffraction analyses, Advances in X-ray Analysis, ed. P. Predecki, et al., Plenum Pub.Co., 1995, vol. 38, pp. 47–57 Search PubMed.
  45. I. A. M. Ahmed, L. G. Benning, G. Kakonyi, A. D. Sumoondur, N. J. Terrill and S. Shaw, Langmuir, 2010, 26, 6593 CrossRef CAS PubMed.
  46. L. Legrand, G. Sagon, S. Lecomte, A. Chausse and R. Messina, Corros. Sci., 2001, 43, 1739 CrossRef CAS.
  47. L. Mazzetti and P. J. Thistlethwaite, J. Raman Spectrosc., 2002, 33, 104 CrossRef CAS.
  48. M. L. Franquelo, A. Duran, L. K. Herrera, M. C. Jimenez de Haro and J. L. Perez-Rodriguez, J. Mol. Struct., 2009, 924–926, 404 CrossRef CAS PubMed.
  49. T. Regier, J. Paulsen, G. Wright, I. Coulthard, K. Tan, T. K. Sham and R. I. R. Blyth, AIP Conf. Proc., 2007, 879, 473–476 CrossRef CAS PubMed.
  50. A. Gloter, M. Zbinden, F. Guyot, F. Gaill and C. Colliex, Earth Planet. Sci. Lett., 2004, 222, 947 CrossRef CAS PubMed.
  51. T. H. Yoon, S. B. Johnson, K. Benzerara, C. S. Doyle, T. Tyliszczak, D. K. Shuh and G. E. Brown, Langmuir, 2004, 20, 10361 CrossRef CAS PubMed.
  52. H. Aritani, H. Yamada, T. Nishio, T. Shiono, S. Imamura, M. Kudo, S. Hasegawa, T. Tanaka and S. Yoshida, J. Phys. Chem. B, 2000, 104, 10133 CrossRef CAS.
  53. J. C. A. A. Roelofs, J. A. van Bokhoven, A. J. van Dillen, J. W. Geus and K. P. de Jong, Chem.–Eur. J., 2002, 8, 5571 CrossRef CAS.
  54. J. A. van Bokhoven, J. C. A. A. Roelofs, K. P. de Jong and D. C. Koningsberger, Chem.–Eur. J., 2001, 7, 1258 CrossRef CAS.
  55. C. S. Doyle, S. J. Traina, H. Ruppert, T. Kendelewicz, J. J. Rehr and G. E. Brown Jr, J. Synchrotron Radiat., 1999, 6, 621 CrossRef CAS PubMed.
  56. K.-I. Shimizu, Y. Kato, H. Yoshida, A. Satsuma, T. Hattori and T. Yoshida, Chem. Commun., 1999, 1681 RSC.
  57. C. Pantke, M. Obst, K. Benzerara, G. Morin, G. Ona-Nguema, U. Dippon and A. Kappler, Environ. Sci. Technol., 2012, 46, 1439 CrossRef CAS PubMed.
  58. D. Peak and T. Regier, Environ. Sci. Technol., 2012, 46, 3163 CrossRef CAS PubMed.
  59. F. M. F. de Groot, J. C. Fuggle, B. T. Thole and G. A. Sawatzky, Phys. Rev. B: Condens. Matter, 1990, 42, 5459 CrossRef CAS.
  60. F. M. F. de Groot, Coord. Chem. Rev., 2005, 249, 31 CrossRef CAS PubMed.
  61. E. Otero, R. G. Wilks, T. Regier, R. I. R. Bylth, A. Moewes and S. G. Urquhart, J. Phys. Chem. A, 2008, 112, 624 CrossRef CAS PubMed.
  62. E. C. Todd, D. M. Sherman and J. A. Purton, Geochim. Cosmochim. Acta, 2003, 67, 2137 CrossRef CAS.
  63. J. P. Crocombette, M. Pollal, F. Jollet, N. Thromat and M. Gautier-Soyer, Phys. Rev. B: Condens. Matter Mater. Phys., 1995, 52, 3143 CrossRef CAS.
  64. N. Hollmann, M. Valldor, H. Wu, Z. Hu, N. Qureshi, T. Willers, Y.-Y. Chin, J. C. Cezar, A. Tanaka, N. B. Brookes and L. H. Tjeng, Phys. Rev. B: Condens. Matter Mater. Phys., 2011, 83, 180405 CrossRef.
  65. J. Stőhr, NEXAFS Spectroscopy, Springer, Berlin, 1992 Search PubMed.
  66. P. Kruger, Phys. Rev. B: Condens. Matter Mater. Phys., 2010, 81, 12512 CrossRef.
  67. G. A. Jenner, H. P. Longerich, S. E. Jackson and B. J. Fryer, Chem. Geol., 1990, 83, 133 CrossRef CAS.
  68. H. P. Longerich, G. Jenner, B. Fryer and S. Jackson, Chem. Geol., 1990, 83, 105 CrossRef CAS.
  69. A. Sumoondur, S. Shaw, I. Ahmed and L. G. Benning, Mineral. Mag., 2008, 72, 201 CrossRef CAS PubMed.
  70. M. Usman, K. Hanna, M. Abdelmoula, A. Zegeye, P. Faure and C. Ruby, Appl. Clay Sci., 2012, 64, 38 CrossRef CAS PubMed.
  71. W. Rudolph, M. H. Brooker and P. R. Tremaine, J. Solution Chem., 1997, 26, 757 CrossRef CAS.
  72. N. Huse, T. K. Kim, L. Jamula, J. K. McCusker, F. M. F. de Groot and R. W. Schoenlein, J. Am. Chem. Soc., 2010, 132, 6809 CrossRef CAS PubMed.
  73. P. A. van Aken and S. Lauterbach, Phys. Chem. Miner., 2003, 30, 469 CrossRef CAS.
  74. M. Bellotto, B. Rebours, O. Clause, J. Lynch, D. Bazin and E. Elkaïm, J. Phys. Chem., 1996, 100, 8527 CrossRef CAS.
  75. S. J. Mills, A. G. Christy, J.-M. R. Génin, T. Kameda and F. Colombo, Mineral. Mag., 2012, 76, 1289 CrossRef CAS PubMed.
  76. L. Simon, M. François, P. Refait, G. Renaudin, M. Lelaurain and J.-M. R. Génin, Solid State Sci., 2003, 5, 327 CrossRef CAS.
  77. R. Allman, Acta Crystallogr., 1968, B24, 972 CrossRef.
  78. C. Ruby, C. Upadhyay, A. Gehin, G. Ona-Nguema and J. M. R. Genin, Environ. Sci. Technol., 2006, 40, 4696 CrossRef CAS.
  79. J. R. Lloyd, FEMS Microbiol. Rev., 2003, 27, 411 CrossRef CAS.
  80. R. Schaetzl and S. Anderson, Soils: Genesis and Geomorphology, Cambridge University Press, Cambridge, UK, 2005, p. 817 Search PubMed.
  81. N. R. Posth, F. Hegler, K. O. Konhauser and A. Kappler, Nat. Geosci., 2008, 1, 703 CrossRef CAS.
  82. D. A. Lipson, M. Jha, T. K. Raab and W. C. Oechel, J. Geophys. Res., 2010, 115, 2156 CrossRef.
  83. C. A. Gorski and M. M. Scherer, Fe2+ sorption at the Fe oxide–water interface: A revised conceptual framework, in Aquatic Redox Chemistry, American Chemical Society, 2011, vol. 1071, pp. 315–343 Search PubMed.
  84. R. L. Frost, W. N. Martens and R. Liu, Water Res., 2009, 43, 1323 CrossRef PubMed.
  85. A. G. B. Williams and M. M. Scherer, Environ. Sci. Technol., 2001, 35, 3488 CrossRef CAS.
  86. J. M. R. Genin, P. Refait, G. Bourrie, M. Abdelmoula and F. Trolard, Appl. Geochem., 2001, 16, 559 CrossRef CAS.
  87. S. R. Randall, D. M. Sherman and K. V. Ragnarsdottir, Geochim. Cosmochim. Acta, 2001, 65, 1015 CrossRef CAS.
  88. J. Jonsson and D. M. Sherman, Chem. Geol., 2008, 255, 173 CrossRef CAS PubMed.
  89. Y. Wang, G. Morin, G. Ona-Nguema, F. Juillot, F. Guyot, G. Calas and G. E. Brown, Environ. Sci. Technol., 2010, 44, 109 CrossRef CAS PubMed.
  90. J. J. Erbs, T. S. Berquó, B. C. Reinsch, G. V. Lowry, S. K. Banerjee and R. L. Penn, Geochim. Cosmochim. Acta, 2010, 74, 3382 CrossRef CAS PubMed.
  91. Y. Masue-Slowey, R. H. Loeppert and S. Fendorf, Geochim. Cosmochim. Acta, 2011, 75, 870 CrossRef CAS PubMed.
  92. H. Liu, P. Li, M. Zhu, Y. Wei and Y. Sun, J. Solid State Chem., 2007, 180, 2121 CrossRef CAS PubMed.
  93. H. Liu, P. Li, B. Lu, Y. Wei and Y. Sun, J. Solid State Chem., 2009, 182, 1767 CrossRef CAS PubMed.
  94. J. Jang, B. A. Dempsey, G. L. Catchen and W. D. Burgos, Colloids Surf., A, 2003, 221, 55 CrossRef CAS.

Footnote

Electronic supplementary information (ESI) available: Solid elemental composition and analysis of initial materials before reaction, tables summarizing element release and percentages of X element (X = Fe or Mg) remaining in solution, individual test data, and phase transformation summary observed for all the reaction conditions. XRD, inert XANES, and inert micro-Raman data for selective samples discussed in the text are also presented herein. See DOI: 10.1039/c4ra08802f

This journal is © The Royal Society of Chemistry 2014
Click here to see how this site uses Cookies. View our privacy policy here.