The role of ozone in the ozonation process of graphene oxide: oxidation or decomposition?

Feng Yanga, Meilian Zhaoa, Zhen Wanga, Hongyun Jic, Baozhan Zhenga, Dan Xiaoac, Li Wu*b and Yong Guo*a
aCollege of Chemistry, Sichuan University, Chengdu, 610064, P. R. China. E-mail: guoy@scu.edu.cn; Fax: +86-28-85412907; Tel: +86-28-85416218
bAnalytical & Testing Center, Sichuan University, Chengdu, 610064, P. R. China. E-mail: wuli@scu.edu.cn; Fax: +86-28-85412316; Tel: +86-28-85412956
cCollege of Chemical Engineering, Sichuan University, Chengdu 610064, P. R. China

Received 16th August 2014 , Accepted 29th October 2014

First published on 29th October 2014


Abstract

We took ozonation as an effective method to re-oxidize graphene oxide (GO) and discussed the behaviour of ozone in ozonation process according to the changes of optical properties, compositions and structures. The results indicate that the ozonation process may involve the oxidation stage and decomposition stage. The research would improve the understanding of the ozonation process and promote the future application of ozonized graphene oxide as the precursor.

As the precursor of a multifunctional graphene-based material, the properties of graphene oxide (GO) depend on the composition, dimensions, layer structure, and edge configuration.1–4 The fluorescence properties of graphene oxide can be drastically modified or fine-tuned by atomistic or chemical doping.5 The functional groups, including hydroxyls, epoxies, carbonyls, carboxyls, are primarily arose from different treatment processes.

Currently, the main approaches for modifying the band structure and modulating the oxidation degree of graphene-based materials include plasma treatment,6 cutting graphene into nano-ribbons or dots7,8 and chemical modification.9,10 Oxidation was carried out with strong oxidizing agents such as concentrated HNO3, mixtures of H2SO4 with HNO3, H2O2, or KMnO4, etc.7,9–11 The deficiencies of chemical re-treatment are time-consuming and difficult for purification. The chemical versatility and tunability of GO make it attractive for a wide application. Ozone, which produces hydroxyl radical-based advanced oxidation process, is the traditional method to cleave organic and inorganic pollutants with oxidation for practical applications. Meanwhile, compared with previous reports, ozonation system was employed to simplify the synthesis of fluorescent graphene oxide, the simplified purification and controllable process are the distinct advantages.

Ozone as the oxidizing agent to treat the carbon-based materials has been reported.12–14 Some research works discussed the destructiveness15 and adsorption16 of ozone on graphene or adjustment of the electrical and optical properties.17 Recently, Gao and co-authors18 showed that the chemical modification of GO by ozone to form ozonized GO as the proton-exchange membrane. Our group has taken ozone as the oxidizing agent to treat GO and reduced GO, and discussed the reaction of ozone and active sites, but the details of ozonation process are not clarified.19 Namely, up to now, most research used ozone as the oxidizing agent tuning the oxidation degree or the electrical and optical properties of graphene or graphene-based materials, but little work has been detailed the ozonation process and the behaviour of ozone. What role does ozone play in the process of ozonation – oxidation or decomposition? It is essential to study graphene-based materials for further application.

Herein, we focus on the ozonation process, and the optical properties of O-GO and elucidate patterns of fluorescence based upon the oxidation mechanism. We reported a simple ozonation for re-oxidation GO into surface-functionalized GO. The functionalized GO was found to exhibit yellow fluorescence. The yellow fluorescence and UV-vis absorption bands are directly induced by the molecular-like fluorophores on the basal plane and the sheet edges. As-produced specimens, according to TEM and SEM images, were dominated by micrometer-sized rippled graphene oxide sheets (Fig. S1).

The graphene oxide was produced from graphite via modified Hummers methods,20 then it was re-oxidized by ozone to obtain fluorescent graphene oxide. As-prepared graphene oxide suspension was dispersed in pH = 2.0 acidic system. Emission peaks appeared ∼550 nm with 374 nm excitation at this pH (Fig. 1), which was different from previously reported.6,8,9 As we all know, graphene is a zero-gap semiconductor and controllably modifying the electronic band structure remains a major challenge. We took ozone as oxidizing agent to introduce oxygen-containing functional groups onto sheets, open optical band gap of graphene oxide and enhanced fluorescence. After ozonation, the fluorescence intensity was significantly enhanced and the solutions changed from brown to yellow, and the yellow fluorescence emissions were observed.


image file: c4ra08750j-f1.tif
Fig. 1 Fluorescence spectra of GO (black line) and O-GO (red line) dispersed in water with the detection wavelength of ∼550 nm and fluorescence spectra excited at 374 nm. Insets of the GO (up) and O-GO (down) (0.5 mg mL−1) aqueous solution were taken under visible light and 365 nm UV-light.

Despite it was micrometer-sized, the fluorescent graphene oxide exhibited obvious fluorescence suggesting that the sheets behaved as indirect bandgap materials. And the broadband fluorescence peaks observed in fluorescent GO were attributed to oxygen-containing groups as the molecular-like fluorophores. Namely, the ozonation processes changed the composition and microstructure of graphene oxide. These changes were further confirmed by X-ray photoelectron spectroscopy, Raman spectroscopy and optical spectra. Interestingly, the fluorescence activity can be tuned and enhanced via ozonation to increase the degree of oxidation (as shown in Fig. 1). Hence, it is a facile, simple, economical, efficient and controllable strategy for ozonation graphene oxide with fluorescence properties.

The change of oxidation degree and chemical components of GO was investigated by X-ray photoelectron spectroscopy (XPS) during ozonation process. As shown in Fig. S2, the survey spectra clearly reveals that the intensity of O 1s peak increased significantly for the O-GO compared with GO. It indicated that the percentage of oxygen on the specimens increased from 27.55% to 36.05% after ozonation for 8 h. Strangely, the percentage of oxygen decreased, when the graphene oxide was treated in ozone system for 16 h (Fig. S2c). In the high-resolution XPS spectra, the C 1s peaks at 284.5 eV, 286.5 eV, 287.2 eV and 288.5 eV were assigned to carbon in the form of C–C, C–O or C–O–C, C[double bond, length as m-dash]O and O–C[double bond, length as m-dash]O, respectively (Fig. 2). The functional groups at edges and on the basal plane of GO mainly including hydroxyls and epoxies (47.37%). While for O-GO, some of hydroxyls and epoxies were transformed into carboxyl (19.34%) and carbonyl (20.46%) groups as the molecular-like fluorophores. However, it should be noted that the contribution of –O–C[double bond, length as m-dash]O decreased from 19.34% for O-GO (being ozonized for 8 h, as shown in Fig. 2b) to 4.25% from O-GO-16 (being ozonized for 16 h, as shown in Fig. S3). It indicated that the excessive ozonation treatment would lead to the decomposition of the oxygen-containing functional groups. In addition, we employed the Raman spectra to analyse the structures of GO and O-GO, which gives a better understanding of structural changes in the ozonation process (Fig. S3). The change of R value and width of peaks indicated that oxygen-containing functional groups were introduced to the lattice points along with the decomposition of oxygen-containing functional groups (as shown in Fig. S4), which was consistent with XPS results. The detailed results were discussed in ESI.


image file: c4ra08750j-f2.tif
Fig. 2 The high-resolution XPS spectra of (a) GO and (b) O-GO.

We also employed X-ray diffractions (XRD) to investigate the chemical structure of GO and O-GO, which was impacted by the components of materials. Fig. 3 shows the XRD results for both GO and O-GO. The diffraction peak of GO is at ∼10.904°, and the interplanar distance is 0.811 nm. After ozonation, the diffraction peak of O-GO shifts to ∼6.720°, corresponding to an interplanar gap of 1.314 nm (Fig. 3). It indicates that the GO was further oxidized to be fully exfoliated and hydrated on the sheets surface, which was consistent with XPS and Raman results.


image file: c4ra08750j-f3.tif
Fig. 3 XRD patterns of (a) GO and (b) O-GO.

To further explore the influence of ozonation on the fluorescence properties of graphene oxide and ozonation mechanism, fluorescence and UV-vis absorption spectra were studied (Fig. 4 and 5). GO dispersed systems were ozonized for different time in two system, which was aqueous dispersion without H2O2 being designated as system-I and with H2O2 being designated as system-II. The gradual transformation of GO is confirmed by fluorescence and absorbance measurements (shown in Fig. 4 and 5).


image file: c4ra08750j-f4.tif
Fig. 4 Fluorescence spectra of progressively ozonized GO dispersed in water. The two system were treated for 0 h, 0.2 h, 0.5 h, 1 h, 2 h, 4 h, 6 h, 8 h, respectively. The fluorescence spectra of GO dispersed water solution without H2O2 in system-I (a) and with H2O2 (0.5 mL) in system-II (b) were obtained for excitation at 450 nm; (c) summary plot showing the fluorescence intensity of O-GO as a function of ozonation time in two system. Insets (a and b): photographs of progressively ozonation in GO aqueous solution were taken under visible light (right) and UV light (left) at 254 nm.

image file: c4ra08750j-f5.tif
Fig. 5 Absorbance spectra of progressively ozonized GO dispersed in water. The ozonation time for the two system is 0 h, 0.2 h, 0.5 h, 1 h, 2 h, 4 h, 6 h, 8 h.

As shown in Fig. 4, the fluorescence intensity of O-GO could be enhanced with the reaction time increasing. The general trends in fluorescence intensity with ozonation time are summarized in Fig. 4c. It should be noticed that (i) the fluorescence intensity of O-GO was correlated with the ozonation time; (ii) the enhancement rate of system-II was clearly faster than that of system-I, meanwhile the change trends and enhanced fluorescence intensities were different within the time scale; (iii) the fluorescence intensity could be gradually enhanced and the fluorescence emission peaks always shifted blue within the time scale in system-II. Unlike system-II, the fluorescence intensity was gradually weakened but it continually shifted blue after 4 h in system-I.

At low concentration solution, the GO suspension exhibited brown and the colour gradually changed to yellow with ozonation (insets of Fig. 4a and b). The change of colour may result from a higher degree of oxidation for O-GO compared to GO, which was confirmed by UV-vis (Fig. S5).

Fig. 5 shows the UV-vis absorption of GO and O-GO, a typical absorption peak at ∼230 nm which was assigned to the π–π* transition of aromatic sp2 domains. It gradually showed a blue-shift with prolonging ozonation time. This indicated that the oxygen functionalities reduced the π–π* domains to open the gap. Thus, the increasing accommodation of oxygen functionalities can change the gap of GO. Clearly, the ozonation rate of system-II was faster than system-I, which was consistent with the evolution of fluorescence results.

As discussed above, we speculated that system-I and system-II experienced different reaction mechanism. In system-I, the dissolved ozone directly reacted with GO slowly. When there is hydrogen peroxide as initiator reaction with O3 to generate HO˙ radicals (as shown eqn (1)) in reaction system. The HO˙ radicals are much more reactive than ozone. Hence, indirect reaction reacted much more rapidly than dissolved ozone with GO. The ozone or HO˙ radicals attack active sites mechanism similar with previous study.19

 
2O3 + H2O2 → 2OH˙ + 3O2 (1)

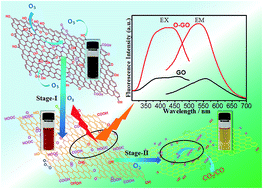
Based on XPS and optical properties, we can propose that the composition of ozonized graphene oxide play an important role on the optical properties. Namely, different ozonation times resulted in the O-GO with different degree of oxidation, being consistent with change of fluorescence and absorbance. The change trends of fluorescence indicate that the ozone plays a different role (oxidation behavior and erosion behavior) in process. Ozonation process undergoes two stage including ozone-oxidation (stage-I, oxidation-dominated) and ozone-decomposition (stage-II, erosion-dominated). Thus, we put forward the conceivable ozonation mechanism, which was based on the results of the fluorescence spectra of O-GO. As mentioned above, the ozone acted as oxidation behavior and erosion behavior. As shown in Fig. 6, stage-I was dominated by oxidation behaviour to introduce oxygen-containing groups to the surface, and stage-II was dominated by erosion behaviour to release CO2/CO and form more defects. That has been verified by the XPS results.


image file: c4ra08750j-f6.tif
Fig. 6 Schematic of the ozonation process for GO.

There are several mechanisms explaining the unique optical characteristics of nano-carbon materials, such as the size distribution of the carbon nano-particles,21 a distribution of different emissive trap sites,22 and the pyrolytic formation of several different polyaromatic fluorophores.23,24 According to the theories, the enhanced fluorescence in nano-carbon materials were due to the passivation that stabilized the surface energy traps of nano-carbon and made them emissive. We discussed the fluorescence properties of O-GO (Fig. S6). Ozonized graphene oxide exhibited strong pH dependent fluorescence that originates from the oxygen-containing functional groups. The results indicated the fluorescence of graphene oxide dispersions is structured and pH dependent, which have been interpreted as evidence of a quasi-molecular origin of the fluorescence. As identified previously, the fluorophores are the oxygenated functionalities associated with the sp3 carbons of graphene oxide.24 More detailed discussions were given in the ESI.

Conclusions

In summary, we described yellow fluorescence chemically derived GO by ozonation and discussed the influence of ozonation time on the optical features, compositions and structure. The optical, XPS and Raman results indicated that ozonation mechanism may involve the oxidation stage and decomposition stage. Clearly, it is a simple, economical, efficient, controllable approach to pre-treated GO for appropriate treatment-time. The discovery of the new ozonation process will have a great help for future applications of graphene-based materials.

Acknowledgements

We greatly appreciate the Natural Science Foundation of China (Grant 21075083, 21345001) for supporting this work.

Notes and references

  1. Y. Liu, X. Dong and P. Chen, Chem. Soc. Rev., 2012, 41, 2283 RSC.
  2. V. Georgakilas, M. Otyepka, A. B. Bourlinos, V. Chandra, N. Kim, K. C. Kemp, P. Hobza, R. Zboril and K. S. Kim, Chem. Rev., 2012, 112, 6156 CrossRef CAS PubMed.
  3. D. Chen, H. Feng and J. Li, Chem. Rev., 2012, 112, 6027 CrossRef CAS PubMed.
  4. H. Bai, C. Li and G. Shi, Adv. Mater., 2011, 23, 1089 CrossRef CAS PubMed.
  5. H. Liu, Y. Liu and D. Zhu, J. Mater. Chem., 2011, 21, 3335 RSC.
  6. T. Gokus, R. R. Nair, A. Bonetti, M. Böhmler, A. Lombardo, K. S. Novoselov, A. K. Geim, A. C. Ferrari and A. Hartschuh, ACS Nano, 2009, 3, 3963 CrossRef CAS PubMed.
  7. D. Pan, J. Zhang, Z. Li and M. Wu, Adv. Mater., 2010, 22, 734 CrossRef CAS PubMed.
  8. G. Eda, Y.-Y. Lin, C. Mattevi, H. Yamaguchi, H.-A. Chen, I. S. Chen, C.-W. Chen and M. Chhowalla, Adv. Mater., 2010, 22, 505 CrossRef CAS PubMed.
  9. J.-L. Chen, X.-P. Yan, K. Meng and S.-F. Wang, Anal. Chem., 2011, 83, 8787 CrossRef CAS PubMed.
  10. Z. Xu and C. Gao, ACS Nano, 2011, 5, 2908 CrossRef CAS PubMed.
  11. H. R. Thomas, C. Valles, R. J. Young, I. A. Kinloch, N. R. Wilson and J. P. Rourke, J. Mater. Chem. C, 2013, 1, 338 RSC.
  12. J. D. Fortner, D. I. Kim, A. M. Boyd, J. C. Falkner, S. Moran, V. L. Colvin, J. B. Hughes and J. H. Kim, Environ. Sci. Technol., 2007, 41, 7497 CrossRef CAS.
  13. W.-L. Yim and J. K. Johnson, J. Phys. Chem. C, 2009, 113, 17636 CAS.
  14. L. V. Liu, W. Q. Tian and Y. A. Wang, J. Phys. Chem. B, 2006, 110, 13037 CrossRef CAS PubMed.
  15. N. Leconte, J. l. Moser, P. Ordejón, H. Tao, A. l. Lherbier, A. Bachtold, F. Alsina, C. M. Sotomayor Torres, J.-C. Charlier and S. Roche, ACS Nano, 2010, 4, 4033 CrossRef CAS PubMed.
  16. G. Lee, B. Lee, J. Kim and K. Cho, J. Phys. Chem. C, 2009, 113, 14225 CAS.
  17. J. Yuan, L.-P. Ma, S. Pei, J. Du, Y. Su, W. Ren and H.-M. Cheng, ACS Nano, 2013, 7, 4233 CrossRef CAS PubMed.
  18. W. Gao, G. Wu, M. T. Janicke, D. A. Cullen, R. Mukundan, J. K. Baldwin, E. L. Brosha, C. Galande, P. M. Ajayan, K. L. More, A. M. Dattelbaum and P. Zelenay, Angew. Chem., Int. Ed., 2014, 53, 3588 CrossRef CAS PubMed.
  19. F. Yang, M. Zhao, B. Zheng, D. Xiao, L. Wu and Y. Guo, J. Mater. Chem., 2012, 22, 25471 RSC.
  20. N. I. Kovtyukhova, P. J. Ollivier, B. R. Martin, T. E. Mallouk, S. A. Chizhik, E. V. Buzaneva and A. D. Gorchinskiy, Chem. Mater., 1999, 11, 771 CrossRef CAS.
  21. H. Liu, T. Ye and C. Mao, Angew. Chem., Int. Ed., 2007, 46, 6473 CrossRef CAS PubMed.
  22. L. Tian, D. Ghosh, W. Chen, S. Pradhan, X. Chang and S. Chen, Chem. Mater., 2009, 21, 2803 CrossRef CAS.
  23. A. B. Bourlinos, A. Stassinopoulos, D. Anglos, R. Zboril, M. Karakassides and E. P. Giannelis, Small, 2008, 4, 455 CrossRef CAS PubMed.
  24. B. Konkena and S. Vasudevan, J. Phys. Chem. Lett., 2013, 5, 1 CrossRef.

Footnote

Electronic supplementary information (ESI) available: The experimental section; morphology, composition and properties of specimens. See DOI: 10.1039/c4ra08750j

This journal is © The Royal Society of Chemistry 2014