Facile and controllable synthesis of carbon-encapsulating carbonate apatite nanowires from biomass containing calcium compounds such as CaC2O4 and CaCO3

Namjo Jeong*ab, Seong Ok Hana, Heeyeon Kima, Kyo-sik Hwangb, SeungCheol Yangb, Kahee Kimc and Sung-kook Honga
aEnergy Materials Research Laboratory, Korea Institute of Energy Research, 71-2, Jang-dong, Yuseong-gu, Daejeon, 305-343, Republic of Korea. E-mail: njjeong@kier.re.kr; sohan@kier.re.kr; heeyeon@kier.re.kr; sungkookhong@kier.re.kr; Tel: +82-42-860-3389
bJeju Global Research Center, Korea Institute of Energy Research, 200, Haemajihaean-ro, Gujwa-eup, Jeju Special Self-Governing Province 695-971, Republic of Korea. E-mail: kshwang@kier.re.kr; pure5258@kier.re.kr; Tel: +82-64-800-2229
cMeasurement and Analysis Team, Korea Advanced Nanofab Center, 960-10, Iui-dong, Yeongtong-gu, Suwon 443-270, Republic of Korea. E-mail: kahee.kim@kanc.re.kr; Tel: +82-31-546-6319

Received 16th August 2014 , Accepted 3rd October 2014

First published on 3rd October 2014


Abstract

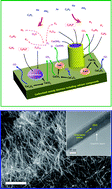
We report the synthesis of carbon-encapsulating carbonate apatite nanowires through vapor–solid growth by heat-treatment of biomass comprising calcium compounds such as CaC2O4 or CaCO3 at 900 °C using both PH3 and C2H2 as the reactants. The thermal decomposition of CaC2O4 or CaCO3 to CaO with increasing temperature (CaC2O4 → CaCO3 + CO → CaO + CO2) is the key to achieving the growth of such core–shell nanowires. First, vapor-phase reactions between the gaseous calcium species generated from the derived CaO and gaseous molecules derived from thermal reactions of the reactants (PH3 and C2H2) lead to the oriented growth of core–shell nanowires along the [001] plane. Second, the CO2 generated during the decomposition of CaCO3 may be primarily responsible for the incorporation of carbonate ions into the apatite structure. Nanowire growth with knots along the growth direction reveals that our approach is very controllable. Additional demonstrations using kenaf fibers further verify that other types of biomass too are usable.

1. Introduction

Apatite is a very important bio-ceramic for biomedical applications such as biomedical implants, bone regeneration, hard tissue engineering, and drug delivery because it is a major constituent of bones and teeth.1 Recently, nano-designed apatite structures have drawn keen attention because of their unique properties, which differ from those of their bulk counterparts.2 One-dimensional (1D) apatite nanostructures such as nanorods, nanotubes, and nanowires are the focus of such studies because their high aspect ratio and unique morphology may help improve bioactivity and mechanical properties of apatite.3–5 Of particular interest is the interplay that exists between bone cells and nanoscale features, suggesting that these morphologies can provide a favorable environment that enables effective bone cell differentiation and growth.6,7 In addition to the geometric design, it is also important to functionalize the apatite nanostructures with reinforcing materials such as carbon nanofibers, carbon nanotubes, and graphene because they provide biocompatibility and nanotopographical incentives.8,9

We have shown in a recent publication that vertically aligned and carbon-encapsulating apatite nanowires are very attractive structures providing excellent bony fusion and nanoscale reinforcement.10 Synthesis of the core–shell nanowires was successfully achieved from glass substrate containing CaO. In this paper, we show that our concept can be extended to substrates including other calcium compounds such as CaC2O4 and CaCO3. Also, we discuss in detail the effect of these calcium compounds on the growth mechanism of such carbon-encapsulating apatite nanowires. For this, we used woody biomass containing CaC2O4 and egg-shell including CaCO3 as starting materials.

Biomass, which is one of the most economical, eco-friendly, and sustainable sources,11 includes various constituent elements such as Ca, Mg, Na, K, P, and S.12 Of particular importance are the calcium compounds such as CaC2O4 and CaCO3 it contains.13 Some studies have provided a tantalizing glimpse of the fabrication of new apatite nanostructures using biomass.14,15 Furthermore, biomass could be used for fabrication of 1D carbonaceous nanomaterials such as carbon nano-anemones, carbon nanohorn–carbon nanotube hybrids, and cone-shaped graphitic whiskers.16–18 Therefore, the search for unique carbon–apatite hybrid nanostructures from such promising renewable sources is a very fascinating and significant challenge that can provide new opportunities for fundamental research and technological development in materials science and nanobiotechnology.

Our work focus on the structural changes on transformation of CaC2O4 or CaCO3 into CaO during carbonization of biomass to understand the primary responsibility for the generation of the gaseous calcium species that are essential for the vapor–solid (VS) growth of the apatite nanowires. Also, we investigate the effect of CO2 derived during the decomposition process of the calcium compounds on the formation of carbonate apatite structure. Some experiments on the effect of synthesis conditions on nanowire growth showed that nanowire growth on the surface of substrates was precipitated when such calcium compounds were decomposed into CaO. Interestingly, as-synthesized apatite crystals grew along the [001] plane, and the controlled nanowire growth with knots along the nanowire growth was possible, which reveals that the chemical reactions responsible for nanowire growth were very controllable. Additionally, we extended this concept to a similar synthesis using different type of woody biomass, thereby verifying that this technique can be used as a general strategy for the fabrication of such hybrid nanostructures that could be used in potential applications.19,20 Here, we denote the apatite–carbon core–shell nanowires as apatite@carbon nanowires.

2. Experimental

2.1. Materials

Woody biomasses containing CaC2O4, such as henequén fibers (Agave fourcroydes) with an average diameter of 150 μm and kenaf fibers (Hibiscus cannabinus) with an average diameter of 80–1000 μm, were prepared as starting materials. Henequén fibers were supplied by DESFITYSA (Desfibradora Yucateca, S.A.) of Mérida Yucatán, México. The average density was about 1.45 g cm−3. Kenaf fibers were supplied from Bangladesh and have the average density of 1.13 g cm−3. Before heat treatment, the fibers were washed with distilled water for 30 min at room temperature and then dried at 100 °C for 1 day. For thermogravimetric analysis (TGA), CaC2O4·xH2O was purchased from Aldrich. The used chicken egg-shell sample was washed several times with deionized water to remove additional residues and impurities from its surface, and then dried at 110 °C for 1 day.

2.2. Synthesis of apatite@carbon nanowires

For synthesis of the apatite@carbon nanowires, the starting materials containing henequén fibers, kenaf fibers, and egg-shell were put in a quartz boat, which was then placed in the center of a quartz reactor. The reactor was rapidly heated at a rate of 45 °C min−1 to the desired temperature, which was controlled between 550 and 900 °C, and then held at the raised temperature for 1 h. During the heat treatment, Ar was supplied as the carrier gas at a flow rate of 1000 cm3 min−1. For growth of apatite@carbon nanowires, the concentration of PH3 (99.999%) was maintained at 0.01% in Ar, and the concentration of C2H2 (99.9%) was controlled between 1 and 5% in Ar. After the growth process, the reactor was cooled to room temperature in Ar only.

2.3. Characterization

The morphology of the apatite core–carbon heterostructures was observed using scanning electron microscopy (SEM: HITACHI S-4700, operated at 10–15 keV) and transmission electron microscopy (TEM: Tecnai F30 Super-twin, operated at 200 keV). To confirm the composition of the core–shell nanowires, energy dispersive X-ray spectroscopy (EDX: Genesis EDAX) analysis was carried out along with scanning TEM (STEM) using a 1 nm beam diameter. Raman spectroscopy was performed using a JY LabRam HR Raman microscope fitted with a liquid-nitrogen-cooled CCD detector. The Raman spectra were recorded using a backscattering geometry and were obtained under ambient conditions using the 514.5 nm line of an Ar-ion laser. The power level was controlled at 5 mW using a focus spot that was 1 μm in size and lasted for 30 s. The X-ray photoelectron spectroscopy (XPS) was performed using an AXIS-NOVA system (Kratos Inc.) with an X-ray source that emitted monochromatic Al-Kα radiation. The area analyzed was 1 mm × 2 mm, and the base pressure was 7.0 × 10⁻⁷ Pa. The TGA was performed in air using a SDT 2960 Simultaneous DTA-TGA system. The temperature was raised to 1000 °C at a rate of 15 °C min−1, and the Ar carrier gas was supplied at a flow rate of 50 mL min−1. The weight of the test samples used for the TGA was approximately 10 mg. Infrared (IR) spectroscopy was recorded using the attenuated total reflection method over the range of 600–4000 cm−1 (HYPERION3000).

Gas chromatograph-mass spectroscopy (GC-MS) analysis was conducted using a 6890 series GC system from Agilent Technologies and a 5973 Network Mass-Selective Detector from Agilent Technologies. The operating parameters were as follows: (a) the columns were 30 m × 320 μm × 0.25 μm 19091J-423 columns for a nitrogen phosphorus detector (NPD, Agilent); (b) the initial temperature of the oven was set to 40 °C, which was maintained for 4 min, and the temperature was increased to a final temperature of 200–300 °C at the rate of 20 °C min−1, which was maintained for 6 min; (c) rubidium beads were used for the NPD; (d) the detector temperature was set to 325 °C; (e) the gas conditions for the NPD were Ar at 5 mL min−1, air at 60 mL min−1, and H2 at 3 mL min−1; (f) the injection volume was 600 μL, and auto injection was performed at a temperature of 250 °C; (g) the run time was 18 min. The detection range for the mass spectrometer was 0–300 m/z, and its scan speed was set at 5.62 s−1. A gas mixture of 0.01% PH3 and 1% C2H2 in Ar was supplied for the GC-MS analysis.

3. Results and discussion

3.1. Structural characterization

The henequén fibers used had smooth surfaces before the heat treatment (Fig. 1(a)). When only Ar was supplied during the heat treatment, a corrugated structure was found along the entire length of the resultant carbon fibers (Fig. 1(b)). The surfaces of the carbon fibers appeared slightly rough, but no remarkable nanostructures were observed. The representative EDX spectrum showed that some additional components such as Ca, Na, Mg, and K were included in the carbon fiber (inset of Fig. 1(b)). When a gas mixture of both PH3 and C2H2 was supplied during the heat treatment, on the other hand, the surfaces of the carbon fibers were completely covered with uniform nanowires (Fig. 1(c)) that grew up to 5 μm in length (inset of Fig. 1(c)).
image file: c4ra08735f-f1.tif
Fig. 1 (a) SEM image and photograph (inset) of raw henequén fibers. (b) SEM image and EDX spectrum (inset) of carbon fiber obtained after the heat treatment of henequén fibers at 900 °C in Ar only. (c) SEM image of nanowire-covered carbon fibers. Inset shows a high-magnification image. (d) HRTEM image showing a nanowire composed of defective graphitic layers and apatite crystal. Inset shows the corresponding FFT image. (e) EDX spectrum of the nanowires. The synthesis was performed for 1 h in a gas mixture of Ar + 0.01% PH3 + 1% C2H2.

A TEM image and the selected area diffraction (SAED) pattern revealed that the measured {002}, {211}, {130}, and {222} families of reflections agree well with those of the hexagonal apatite structure (Fig. 1(d) and (e)).21 Remarkably, a high-resolution TEM (HRTEM) image showed that the nanowire was composed of defective graphitic layers with thicknesses below 2 nm and a 20 nm-diameter apatite nanowire oriented along the (002) plane (Fig. S1(a)). Furthermore, from the fast Fourier transform (FFT) image, the lattice spacings of the core were calculated to be 3.4, 3.1, and 2.3 Å, which can be assigned to the (002), (210), and (212) planes of hexagonal apatite, respectively (inset of Fig. 2(c)). The EDX spectrum clearly showed the expected Ca, P, O, and C components (Fig. S1(b)).


image file: c4ra08735f-f2.tif
Fig. 2 (a) The XPS survey spectrum of samples obtained after 1 h of heat treatment at 900 °C with an Ar only or Ar + PH3/Ar + C2H2 atmosphere, and the detailed scans of (b) C (1s), (c) Ca (2p), (d) P (2p), and (e) O (1s).

No Raman excitation peak was observed from the raw henequén fiber (Fig. S2(a)). The Raman spectra of sample heat-treated in Ar only had two prominent bands: D and G bands at 1350 and 1590 cm−1, respectively. The characteristics of these bands were similar to those of amorphous carbon.22 The Raman spectrum of the sample that was heat-treated under a gas mixture of both PH3 and C2H2 revealed a very weak peak at approximately 960 cm−1 (PO4−3 (ν1)); this peak is a main peak in the Raman spectra of a typical apatite structure (Fig. S2(b)).23 The slight enhancement in the intensity ratio of the D to G bands may reflect the effect of the graphitic layers surrounding apatite nanowire (Fig. S2(c)).

XPS analysis is of great importance in the determination of the surface composition and chemical state of the products. Fig. 2(a) shows the XPS survey spectra of samples obtained after 1 h of heat treatment at 900 °C with an Ar only or Ar + PH3/Ar + C2H2 atmosphere. When Ar only was supplied, Ca, O, and C were observed as the main components, but P was absent in the products. The high intensity of the Ca and O peaks reveals that a large number of calcium compounds are present as compared to carbon fiber. On the other hand, when a gas mixture (Ar + PH3/Ar + C2H2) was supplied, peaks corresponding to P were observed in the spectrum. Also, the C peak intensity significantly increased. These changes confirm the formation of carbon-sheathed apatite nanowires on the surface of carbon fibers.

In the detailed XPS spectrum obtained from samples without nanowire growth, the C (1s) peak was deconvoluted into four components (Fig. 2(b)).24 The main contribution occurred at 284.2 eV, which corresponds to the sp2-hybridized graphite-like carbon atom. The sp3-hybridized carbon atom, which is related to disordered carbon and structural defects in graphite sheet, was assigned at 285.6 eV. The carbon atom related to the C–O species was assigned at 286.5 eV. Remarkably, the component assigned to the carboxyl C[double bond, length as m-dash]O species or carbonate was recorded at a high binding energy of 289.7 eV. These results indicate the presence of CaCO3 in the samples.25

The core-level binding energy (BE) positions of Ca (2p1/2), Ca (2p3/2), and O (1s) were at 350.7, 347.2, 133.0, and 531.0 eV, respectively (Fig. 2(c)–(e)). The doublet separation energy of Ca (2p) was approximately 3.5 eV. After the nanowire synthesis, the intensity of peak corresponding to C[double bond, length as m-dash]C increased significantly, which indicates the formation of graphitic layers on the surface of carbon fibers. Furthermore, P (2p) was observed at the core-level BE positions of 133.0 eV, which is consistent with that of the phosphate ion.26 The core-level BE positions of Ca (2p1/2), Ca (2p3/2), and O (1s) was similar to those of the samples without the nanowires. This strongly supports that the apatite structure was formed on the surface of carbon fibers.27 Furthermore, the weak carbonate peak in C (1s) was noticeable, which indicates the following: decomposition of CaCO3 to CaO and CO2, and the subsequent incorporation of the carbonate ion into the apatite structure during nanowire synthesis.

The IR spectrum of the sample that was heat-treated under a gas mixture of both PH3 and C2H2 was shown in Fig. S3. The pattern of the absorption peaks is typical for carbonate calcium phosphate.28,29 The characteristic bands of phosphate groups were observed at about 960 and 1030 cm−1. The presence of carbonate ions was identified at about 873, 880, 1413, 1458, and 1550 cm−1, which revealed that carbonate ions were substituted into apatite crystals. Additionally, the peaks measured at about 1370 and 1586 cm−1 indicates the D- and G-bands of graphitic layers encapsulating apatite nanowires.

3.2. Growth mechanism

As shown in Fig. 3, the possible mechanism for the formation of carbonate apatite@carbon nanowires can be briefly summarized as follows: nucleation of carbonate apatite crystals, VS growth of carbonate apatite nanowires, and surface graphitization on the radial surfaces of the apatite nanowires.
image file: c4ra08735f-f3.tif
Fig. 3 Schematic representation of the growth mechanism for a carbonate apatite@carbon nanowire from woody biomass containing CaC2O4 crystals.

First, apatite crystals are nucleated on the surface of the carbonized biomass. TGA performed in Ar revealed that the CaC2O4 crystals decompose between 400 and 525 °C according to the chemical formula CaC2O4 (s) → CaCO3 (s) + CO (g). Between 660 and 880 °C, CaCO3 decomposes into CaO (s) and CO2 (g) (Fig. S4).30 In Fig. S5, gas analysis clearly revealed that P4 can be derived from the thermal pyrolysis of PH3 at the set temperature of 900 °C. It is also possible that P4 may react with oxygen in the reactor, resulting in the formation of phosphorus oxides such as P4O10 (g).31 Furthermore, a bioactive substrate containing CaO and P4O10 can provide a favorable environment for the formation of calcium phosphate (xCaO (s) + yP4O10 (g) = Cax(PO4)z (s)), resulting in a transformation to apatite crystal.32 This supports our hypothesis for the initial formation of nanoscale apatite crystals.

Second, once the apatite is completely crystallized, growth should occur along a particular crystal plane in the axial direction. Biological additives can play a key role in the initial nucleation and oriented crystallization of apatite.33 Gas analysis clearly revealed that the supply of both PH3 and C2H2 at 900 °C can generate a variety of gaseous molecules such as aromatic hydrocarbon molecules (g), H2 (g), phosphine radicals (g), P4 (g), and heterocyclic phosphorus compounds such as C5H5P (g). Therefore, it is feasible that the C5H5P (g) may precipitate the nucleation of apatite and lead to the growth of apatite crystals oriented along the [001] plane. Then, oriented apatite crystals start growing along the axial direction. For nanowire growth, calcium- and phosphorus-containing gaseous species should coexist in the reactor. On the other hand, when the reactor temperature rapidly increases to 900 °C, the henequén fibers are carbonized into amorphous carbon fibers. During this process, the decomposition of CaCO3 (s) into CaO (s) generates CO2 (g), and calcium-containing gaseous species can be produced from CaO (s). Previous studies have found that the gaseous species that can be generated from CaO (s) include Ca (g), CaO (g), O2 (g), and O (g), which are formed by sublimation and dissociation, and Ca (g), H2 (g), CaOH (g), and Ca(OH)2 (g), which are formed during heating in H2 (g).34,35 Therefore, we speculate that the specific vapor-phase reactions occurring between these gaseous species, particularly between P4 (g), Ca(OH)2 (g), O (g), and CO2 (g), lead to the VS growth of the apatite nanowire.36 The TGA and IR results clearly revealed the presence of carbonate component in the apatite nanowires. The formation of carbonate is due to the adsorption of CO2 derived during the decomposition of CaCO3 into CaO (Fig. 3).

Finally, the surface graphitization should occur simultaneously along the entire radial surface of the apatite nanowires, which have relatively stable interfacial energies. From typical synthetic routes for substrate-based carbon nanotubes, it is acceptable for the interfaces between the nanoscale apatite crystals and the surfaces of the carbon fibers to act as defect sites for the initial formation of graphitic layers.37 However, the continuous formation of cylindrical graphitic layers is unlikely to be induced through a catalyst-movement-dependent growth mechanism such as the vapor–liquid–solid growth mechanism. A catalyst-movement-growth mechanism is unlikely not only because the crystalline apatite structures remain in a solid state at the considered temperature but also because they have low carbon solubility and poor catalytic activity. Our gas analysis revealed the presence of aromatic hydrocarbon molecules that are thermally cyclized from C2H2 at the set temperature (Fig. S5).38 Hence, we can hypothesize that these graphitic fragments may be precisely arranged along the radial surface of the carbonate apatite crystals, resulting in continuous formation of the graphitic layers.39

3.3. Effect of synthesis conditions on nanowire growth

We performed two tests to obtain a clearer understanding of the growth mechanism. First, we controlled the synthesis temperature while both PH3 and C2H2 were supplied. At 550 °C, nanoparticle formation was observed on the surfaces of the resultant carbon fibers (Fig. S6(a)). The STEM image and its EDX spectrum revealed that the nanoparticles had Ca and P as their primary components (Fig. S6(b) and (c)). The amorphous cores of the nanoparticles were easily vaporized by the short exposure to the electron beam during TEM observations (Fig. S6(d)), resulting in the formation of amorphous hollow carbon nanoparticles (Fig. S6(e)). At the set temperature, the calcium compounds included in the carbon fibers are present as stable CaCO3 (Fig. S4). The decomposition of PH3 into phosphorus and hydrogen begins at approximately 375 °C and is completed at 593 °C,40 while cyclization of C2H2 into aromatic hydrocarbon molecules starts at 650 °C (Fig. S5).38 This implies the absence of C5H5P (g) molecules that were found to be important for the nucleation and oriented growth of apatite crystals, supporting our results.

Gas analysis showed that a variety of gaseous molecules that were derived at 900 °C can also be generated at 750 °C (Fig. S5). Therefore, the formation of nanowires composed of crystalline apatite cores and carbon layers may be possible at 750 °C (Fig. S7(a)). However, the nanowires generated at 750 °C appear short and wavy (Fig. S7(b)). Unlike those synthesized at 900 °C, they were easily damaged during TEM observation (arrows in Fig. S7(c)). These differences may be due to the unstable structural change of the included CaCO3 as the temperature increases (Fig. S4). At 900 °C, the complete transformation of CaCO3 into CaO not only provides a stable site for the nucleation of nanoscale seeds for nanowire growth but also leads to the constant production of calcium-containing gaseous molecules. At 750 °C, on the other hand, CaCO3 does not completely decompose to CaO. This implies that the concentration of the derived calcium-containing gaseous molecules in the reactor is relatively low and continues to change, resulting in the formation of tiny and nonuniform nanowires. This difference may explain why the nanowires were not straight and uniform at 750 °C.

Next, we controlled the supply of reactant gases. When only Ar and PH3 was supplied during the heat treatment, the formation of 100 nm-diameter calcium phosphate nanoparticles was observed on the surface of the carbon fibers (Fig. 4(a) and (b)). After supplying only Ar and C2H2, the nanoparticles with diameter of approximately 20 nm were formed on the surface of the carbon fibers (Fig. 4(c)). There are no 1D nanostructures in the resultant products. The EDX spectrum clearly shows that the nanoparticles were inorganic components such as CaO and MgO (Fig. 4(d)). When both PH3 and C2H2 were supplied together, on the other hand, a dense coverage of uniform nanowires was observed on the carbon fiber surfaces (Fig. 4(e)). The shell thickness of the nanowires was estimated at approximately 2 nm (Fig. 4(f)). These different results strongly indicate that the C5H5P (g) molecules play a key role in the nanowire formation (Fig. S5). Furthermore, when the supplied amount of C2H2 was increased, the diameter of the nanowires increased significantly (Fig. 4(g)) because of the increase in the graphitic layer thickness, not because of the apatite cores (Fig. 4(h)). This demonstrates that the surface graphitization is promoted through the enormous accumulation of aromatic hydrocarbon molecules (Fig. S5).


image file: c4ra08735f-f4.tif
Fig. 4 SEM images of products heat treated at 900 °C with gas mixtures of (a) Ar + 0.01% PH3, (c) Ar + 1% C2H2, (e) Ar + 0.01% PH3 + 1% C2H2, and (g) Ar + 0.01% PH3 + 5% C2H2. (b) and (d) show the EDX spectrum corresponding to (a) and (c), respectively. (f) and (h) show the TEM images corresponding to (e) and (g), respectively. The insets show the high-magnification images.

3.4. Controlled growth

To highlight that our approach is very controllable, we consider the growth of core–shell nanowires with knots along the growth direction. After the 50 min of growth using both PH3 and C2H2, the C2H2 supply was cut off for a short duration. Subsequently, C2H2 was re-supplied for 10 min after the PH3 supply was also cut off. Finally, the reactor was cooled down to room temperature in an Ar atmosphere. As a result, we fabricated nanowires with an enlarged top portion (Fig. 5). The diameter of the nanowires smoothly increased along the neck region. The average diameter of the head was approximately 30 nm and that of the stem was approximately 15 nm. The length of the head was about 50, 100, and 150 nm when the C2H2 supply was cut off for 3, 5, and 10 min, respectively (Fig. 5(a)–(c)). Fig. S8(a) shows the TEM image of nanowires observed at the C2H2 cut-off time for 5 min (yellow arrows). The corresponding HRTEM image reveals that the nanowire was completely covered with graphitic layers (Fig. S8(b)), which was confirmed by a virtual image that highlights the graphitic layers in an area selected by a red square in Fig. S8(b) and (c). In the crystallographic data of both the head and the stem, the lattice spacings of the core had structures that were calculated to be 3.4, 2.8, 3.9, and 4.7 Å, which can be assigned to the (002), (112), (111), and (110) planes of hexagonal apatite (Fig. S8(d) and (e)).
image file: c4ra08735f-f5.tif
Fig. 5 SEM and TEM images of nanowires taken at C2H2 cut-off times of (a) 3, (b) 5, and (c) 10 min.

The SEM images show nanowires synthesized with twice the variation of the supplied amount of C2H2 (Fig. 6(a) and (b)). The synthesis time was 60 min. After 20 min of nanowire growth in the presence of both C2H2 and PH3, the C2H2 supply was stopped for 5 min. This process was repeated once more, and then the PH3 supply was shut off. Finally, only C2H2 was re-supplied for 10 min, and the temperature of the reactor was cooled to room temperature. During all processes, Ar was supplied as the carrier gas. Two knots formed along the axial growth direction of the nanowires (Fig. 6(c)). This result was identified from TEM analysis (Fig. 6(d)–(h)). The growth direction and lattice structure did not change throughout the nanowire. The surface of the nanowire was completely covered with graphitic shells except at its root, which seemed to be pulled out (white circle in Fig. 6(d)). It could be inferred from the above results (Fig. 5) that the sheathing of the first knot by graphitic shells was accomplished during the second “on” stage of C2H2. Fig. 6(f) shows the agreement in growth direction as well as the dislocation in the growth axes of the two stems connected to the first knot. The growth of nanowire was orientated along the (001) lattice plane, with an estimated lattice spacing of 3.44 Å.


image file: c4ra08735f-f6.tif
Fig. 6 Nanowires with two knots formed along the axial growth direction. (a) Low- and (b) high-magnification SEM images. (c) A TEM image of a nanowire obtained by “on” and “off” control of PH3 and C2H2. HRTEM images taken at the (d) root, (e) stem, (f) first knot, (g) neck, and (h) head of the second knot. The white and black arrows in (f) indicate the graphitic shells observed in the first knot and stem from the mismatch of the growth axes, respectively.

We speculate that the mismatch in the growth axes of knot and stem of a nanowire is because of the differences between the lateral growth rate of the knot and the formation rate of the graphitic shells on the radial surface of the knot during the growth process (Fig. 7). As mentioned earlier, the formation of graphitic layers suppresses the lateral growth of the apatite core by preventing gaseous sources from being absorbed into the radial surface of the apatite core. Therefore, when only the C2H2 supply was stopped, only the lateral growth of the apatite core was allowed (Fig. 5).


image file: c4ra08735f-f7.tif
Fig. 7 (a) The growth axes of two stems completely consistent with that of the knot. (b) The growth axis of the upstream stem is consistent with that of a knot; however, the opposite stem was mismatched. (c) The growth axes of two stems completely dislocated from the knot.

If the lateral growth rate stays the same over the entire radial surface of the nanowires, the growth axis of the knots would coincide with that of stem as shown in Fig. 7(a). On the other hand, Fig. 7(b) shows that the second stem grew with a growth axis dissimilar to that of the first knot. This implies that when C2H2 was re-supplied after stopping of knot formation, the formation rate of the graphitic layers depended on the position of the radial surface of the knot. Furthermore, Fig. 7(c) reveals that the growth axes of the two stems are completely dislocated from that of the knot, which indicates an imbalance between the lateral growth rate of the core and the formation rate of the graphitic layers on the core's surface during the change in the reactant supply. Interestingly, it is noteworthy that the growth of all knots and stems of the nanowires was oriented in the [001] direction along the nanowire growth.

3.5. Concept expansion

Additional experiment was performed to establish that our approach is very reliable. Kenaf plants are widely known for their contribution to the global and regional environment because of their significant rate of CO2 accumulation and their high calcium content.41 Fig. 8 shows the results obtained from kenaf fibers through the same synthesis processes as that performed for the henequén fibers. Nanowires with similar structures were formed on the surface of carbonized kenaf fibers (Fig. 8(a)–(d)). An HRTEM image revealed that the apatite nanowire core oriented along the (002) plane was sheathed in carbon layers (Fig. 8(e) and its inset). The TEM elementary distribution map results confirm the core–shell configuration of the nanowires (Fig. 8(f)–(i)). These results confirm that CaC2O4 contained in woody biomass can be very useful in fabricating carbon-functionalized apatite nanostructures.
image file: c4ra08735f-f8.tif
Fig. 8 Photographs of kenaf fibers (a) before and (b) after synthesis for 1 h at 900 °C. SEM images of the products obtained after heat treatments with a gas mixture of (c) Ar + 0.01% PH3 + 1% C2H2. (d) A TEM image of the as-synthesized nanowire. The inset shows the corresponding FFT image. The lattice spacings of the core were calculated to be 3.4 and 2.2 Å, which can be assigned to the (002) and (310) planes of hexagonal apatite. (e) The scanning TEM image and its corresponding elemental mapping images for (f) C, (g) Ca, (h) P, and (i) O.

The growth mechanism revealed that thermal decomposition of CaCO3 to CaO and CO2 is essential for the growth of carbonate apatite@carbon nanowires. To verify this concept, we employed egg-shell that consists of mostly inorganic calcite (ca. 96%).42 Recent studies have shown that the major component of the thermal-treated egg-shell was CaO,43 and an egg-shell waste could be used for apatite formation.42 In this work, we applied the same synthesis process to egg-shell sample. Fig. 9(a) showed photographs of egg-shell before and after the synthesis process. After synthesizing, the color of egg-shell surface changed to black. Low-magnification SEM image showed a typical mammillae structure of egg-shell (Fig. 9(b)).44 High-magnification SEM image revealed that whole surface of egg-shell was covered with thin and straight nanowires (Fig. 9(c) and (d)).


image file: c4ra08735f-f9.tif
Fig. 9 Photographs of egg-shell (a) before and after synthesis for 1 h at 900 °C. SEM images of the products obtained after heat treatments with a gas mixture of (b–d) Ar + 0.01% PH3 + 1% C2H2.

From XRD graphs (Fig. 10(a)), it was clear that the major component of raw egg-shell was CaCO3. After the heat-treatment at 900 °C for 1 h in Ar, the CaCO3 phase was transformed into CaO phase. No peak related to CaCO3 was observed in the XRD graph. When PH3 gas was added into the reactor during the heat-treatment, the formation of apatite with hexagonal structure was additionally identified, but the existence of nanowires was not observed on the heat-treated egg-shell surface. When both PH3 and C2H2 gases was spontaneously supplied into the reactor, on the other hand, the formation of hexagonal apatite structure was remarkable. Fig. 9(d) confirmed that the structure was nanowires with high-yield growth. The Raman spectra supported these results strongly. Furthermore, the characteristics of D- and G-bands of samples obtained after the synthesis process revealed clearly that the nanowires have graphitic structure (Fig. 10(b)).


image file: c4ra08735f-f10.tif
Fig. 10 (a) XRD and (b) Raman spectra of the samples prepared before and after 1 h of heat treatment at 900 °C with an Ar only, Ar + PH3/Ar, or Ar + PH3/Ar + C2H2 atmosphere.

The EDX spectrum clearly showed the expected Ca, P, O, and C components (Fig. S9). These results indicated that the suggested growth mechanism can be generally applied to the synthesis processes of unique nanostructures from raw materials that contain calcium compounds such as CaC2O4, CaCO3, and CaO.

4. Conclusions

The VS growth of carbonate apatite@carbon nanowires was achieved through the heat treatment of woody biomass at 900 °C under a gas mixture of PH3 and C2H2. The results clearly showed that structural changes resulting from the conversion of the CaC2O4 or CaCO3 contained in the biomass to CaO as the temperature increased played an important role in the apatite core growth in the hybrid nanowires. In particular, it is noteworthy that the nucleation and oriented growth of the apatite nanowires was directed by C5H5P (g) molecules, and that the incorporation of carbonate ions into the apatite structure was attributed to CO2 generation during the decomposition of CaCO3 into CaO. The effects of synthesis conditions on the nanowire formation confirmed that the growth mechanism is comparably controllable by changing the temperature or reactants. Similar results were obtained using kenaf fibers and egg-shell. This shows that our approach is very reliable and can be adopted as a general strategy for synthesis of such core–shell nanowires. We anticipate that our concept of using biomass will be developed into an easy method for fabricating new types of nanomaterials in large quantities at low costs and will be a promising avenue for a wide range of potential applications.

Acknowledgements

This work was conducted under the framework of the Research and Development Program of the Korea Institute of Energy Research (KIER: B4-2452).

Notes and references

  1. B. Basu, D. S. Katti and A. Kumar, Advanced biomaterials, John & Wiley, New Jersey, 2009 Search PubMed.
  2. S. Nayak, B. Satpati, R. K. Shukla, A. Dhawan, S. Bhattacharjee and Y. S. Chaudhary, J. Mater. Chem., 2010, 20, 4949 RSC.
  3. J. Zhan, Y. H. Tseng, J. C. C. Chan and C. Y. Mou, Adv. Funct. Mater., 2005, 13, 2005 CrossRef.
  4. Y. Xu, J. Jiang, Y. Lu, R. J. Sun, J. Song, L. Rem and S. H. Yu, Cryst. Growth Des., 2008, 8, 3822 CAS.
  5. D. O. Costa, S. J. Dixon and A. S. Rizkalla, ACS Appl. Mater. Interfaces, 2012, 4, 1490 CAS.
  6. M. M. Stevens and J. H. George, Science, 2005, 310, 1135 CrossRef CAS PubMed.
  7. M. J. Dalby, N. Gadegaard, R. Tare, A. Andar, M. O. Riehle, P. Herzyk, C. D. W. Wilkinson and R. O. C. Oreffo, Nat. Mater., 2007, 6, 997–1003 CrossRef CAS PubMed.
  8. D. Lahiri, V. Singh, A. K. Keshri, S. Seal and A. Agarwal, Carbon, 2010, 48, 3103 CrossRef CAS.
  9. M. Wu, Q. Wang, X. Liu and H. Liu, Carbon, 2013, 51, 335 CrossRef CAS.
  10. N. Jeong, M. Cha, Y. C. Park, K. M. Lee, J. H. Lee, B. C. Park and J. Lee, ACS Nano, 2013, 7, 5711 CrossRef CAS PubMed.
  11. J. A. Melero, J. Iglesias and A. Garcia, Energy Environ. Sci., 2012, 5, 7393 CAS.
  12. S. Saka and D. A. I. Goring, Mokuzai Gakkaishi, 1983, 29, 648 CAS.
  13. M. Jőller, T. Brunner and I. Obernberger, Energy Fuels, 2005, 19, 311 CrossRef.
  14. R. Watanabe, T. Takase and T. Asada, Carbon, 2013, 52, 621 CrossRef CAS.
  15. T. Akaki, H. Maehara and M. Tooyama, J. Wood Sci., 2012, 58, 532 CrossRef CAS.
  16. M. Zabeti, K. Mojet and K. Seshan, Carbon, 2013, 54, 498 CrossRef CAS.
  17. S. A. M. Zobir, Z. Zainal, C. S. Keng, S. H. Sarijo and M. Yusop, Carbon, 2013, 54, 492 CrossRef CAS.
  18. Y. Saito and T. Arima, Carbon, 2007, 45, 248 CrossRef CAS.
  19. A. A. White, S. M. Best and I. A. Kinloch, Int. J. Appl. Ceram. Technol., 2007, 4, 1 CrossRef CAS.
  20. M. R. Elahifard, S. Rahimnejad, S. Hahighi and M. R. Gholami, J. Am. Chem. Soc., 2007, 129, 9552 CrossRef CAS PubMed.
  21. J. C. Elliot, Structure and Chemistry of Apatites and Other Calcium Orthophosphates, Elsevier, Amsterdam, 1994, p. 389 Search PubMed.
  22. P. K. Chu and L. Li, Mater. Chem. Phys., 2006, 96, 253 CrossRef CAS.
  23. M. A. V. M. Grinet, H. Zanin, A. E. C. Granato, M. Porcionatto, F. R. Marciano and A. O. Lobo, J. Mater. Chem. B, 2014, 2, 1196 RSC.
  24. V. Datsyuk, M. Kalyva, K. Papagelis, J. Parthenios, D. Tasis, A. Siokou, I. Kallitsis and C. Galiotis, Carbon, 2008, 46, 833 CrossRef CAS.
  25. J. Jiao, X. Liu, W. Gao, C. Wang, H. Feng, X. Zhao and L. Chen, CrystEngComm, 2009, 11, 1886 RSC.
  26. H. Zeng and W. R. Lacefield, Biomaterials, 2000, 21, 23 CrossRef CAS PubMed.
  27. C. C. Chusuei, D. W. Goodman, M. J. Stipdonk, D. R. Justes and E. A. Schweikert, Anal. Chem., 1999, 71, 149153 CrossRef PubMed.
  28. G. Xu, I. A. Aksay and J. T. Groves, J. Am. Chem. Soc., 2001, 123, 2196 CrossRef CAS PubMed.
  29. K. Lin, J. Chang, Y. Zhu, W. Wu, G. Cheng, Y. Zeng and M. Ruan, Cryst. Growth Des., 2009, 9, 177 CAS.
  30. C. Duval, Inorganic Thermogravimetric Analysis, Elsevier, New York, 2nd edn, 1963, p. 281 Search PubMed.
  31. S. Grimme, J. Chem. Phys., 2006, 124, 034108 CrossRef PubMed.
  32. T. Kokubo, H. Kushitani, C. Ohtsuki, S. Sakka and T. Yamamuro, J. Mater. Sci.: Mater. Med., 1993, 4, 1 CrossRef CAS.
  33. J. Tao, H. Pan, Y. Zeng, X. Xu and R. Tang, J. Phys. Chem. B, 2007, 111, 13410 CrossRef CAS PubMed.
  34. M. Farber, R. D. Srivastava, J. W. Moyer and J. D. Leeper, J. Chem. Soc., Faraday Trans., 1987, 83, 3229 RSC.
  35. I. O. Samoilova and E. K. Kazenas, Metally, 1995, 1, 33 Search PubMed.
  36. C. Frondel and E. L. Prien, Science, 1942, 95, 431 CAS.
  37. A. Magrez, J. W. Seo, V. L. Kuznetsov and L. Forró, Angew. Chem., Int. Ed., 2007, 46, 441 CrossRef CAS PubMed.
  38. I. Shapiro and H. G. Weiss, J. Am. Chem. Soc., 1957, 79, 3294 CrossRef CAS.
  39. J. Y. Dai, J. M. Lauerhaas, A. A. Setlur and R. P. H. Chang, Chem. Phys. Lett., 1996, 258, 547 CrossRef CAS.
  40. A. S. Jordan and A. Robertson, J. Vac. Sci. Technol., A, 1994, 12, 204 CAS.
  41. T. B. T. Lam, K. Hori and K. Iiyama, J. Wood Sci., 2003, 49, 255 CrossRef CAS.
  42. Y. Zhang, Y. Liu, X. Ji, C. E. Banks and W. Zhang, J. Mater. Chem., 2011, 21, 14428 RSC.
  43. T. Witoon, Ceram. Int., 2011, 37, 3291 CrossRef CAS.
  44. Y. C. Chien, M. T. Hincke, H. Vali and M. D. McKee, J. Struct. Biol., 2008, 163, 84 CrossRef CAS PubMed.

Footnote

Electronic supplementary information (ESI) available. See DOI: 10.1039/c4ra08735f

This journal is © The Royal Society of Chemistry 2014
Click here to see how this site uses Cookies. View our privacy policy here.