Polylactide-b-poly(ethylene-co-butylene)-b-polylactide thermoplastic elastomers: role of polylactide crystallization and stereocomplexation on microphase separation, mechanical and shape memory properties

Yongfeng Huang, Pengju Pan*, Guorong Shan and Yongzhong Bao
State Key Laboratory of Chemical Engineering, Department of Chemical and Biological Engineering, Zhejiang University, 38 Zheda Road, Hangzhou 310027, China. E-mail: panpengju@zju.edu.cn; Tel: +86-571-87951334

Received 13th August 2014 , Accepted 15th September 2014

First published on 15th September 2014


Abstract

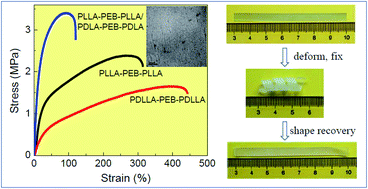
Polylactide-b-poly(ethylene-co-butylene)-b-polylactide (PLA–PEB–PLA) triblock copolymers containing PLA segments with different stereo-regularities such as poly(L-lactide) (PLLA), poly(D-lactide) (PDLA), and poly(D,L-lactide) (PDLLA) were prepared via the ring-opening polymerization of various lactides using α,ω-dihydroxy PEB as the macromolecular initiator. Molecular weight and chemical composition of copolymers were adjusted by changing the monomer-to-initiator ratio. Morphological, thermal, mechanical, and shape memory behaviors of PLA–PEB–PLA were explored. As confirmed by small angle X-ray scattering (SAXS) and transmission electrical microscopy (TEM), PLA–PEB–PLA adopted ordered microphase-separated morphology, depending on the copolymer composition and crystallizability of PLA segments. Spherical, hexagonally packed cylindrical, and lamellar structures were observed in PLA–PEB–PLA upon increasing the volume fraction of PLA. However, the morphological order was diminished in PLLA–PEB–PLLA/PDLA–PEB–PDLA enantiomeric blends, due to the preferential stereocomplexation of PLLA and PDLA segments before microphase separation. PLA–PEB–PLA showed the properties of thermoplastic elastomers. Their Young's modulus and tensile strength increased while the strain at break decreased upon increasing the fraction of PLA hard segments or with the crystallization or stereocomplexation of PLA domains. Interestingly, PLA–PEB–PLA elastomers showed shape memory behavior, which could be controlled by the crystallizability of PLA hard segments.


Introduction

Polylactide or poly(lactic acid) (PLA) is a representative biobased and biodegradable thermoplastic and has been extensively used in biomedical fields, pharmaceutical fields, and traditional commodities.1–3 Since lactic acid is a chiral molecule, the tacticity of PLA can be controlled by the stereoisomeric form of lactic acid or lactide monomer. Thermal and mechanical properties of PLA are strongly influenced by its stereoregularity. Atactic poly(D,L-lactide) (PDLLA) is amorphous while the enantiopure, isotactic poly(L-lactide) (PLLA) and poly(D-lactide) (PDLA) are semicrystalline (Tm ≈ 170 °C).3 Furthermore, stereocomplex crystallization can take place in PLLA/PDLA blends, affording the materials higher melting point and better chemical resistance.4–6

Even though PLA has relatively high mechanical strength and modulus, it is too brittle and subject to break at a low strain. Therefore, toughening of PLA is frequently required in practical applications.7 A common approach to improve the toughness of polymer is the controlled incorporation of other component in polymerization, for example, block copolymerization. Many studies have demonstrated that the incorporation of soft segments is effective to improve the toughness of PLA.8–12 Particularly, ABA triblock copolymers, in which A and B blocks are incompatible and microphase-separated, have improved physical properties (e.g., toughness) and can be used as thermoplastic elastomers (TPEs). The end-block A is a hard, semicrystalline or high Tg thermoplastic, while the midblock B is a soft, rubbery, and low Tg polymer. Because the amorphous, racemic PLA has relatively high Tg and the enantiopure PLA is semicrystalline, they are ideal candidates used as the end-blocks of TPEs.13–24 A lot of soft midblocks such as polyisobutylene,13 poly(dimethylsiloxane),14 poly(1,3-trimethylene carbonate),15 poly(1,5-dioxepan-2-one),16 polyisoprene (PI),18 polymenthide (PM),19,20 and poly(6-methyl-ε-caprolactone) (PMCL)21 have been incorporated into PLA to prepare TPEs, which were demonstrated to be highly effective to overcome the brittleness of PLA. Furthermore, the physical properties of TPEs can be readily modulated through varying the tacticity, crystallizability, and crystalline polymorphs of PLA blocks.15,20

Besides the chemical structures, microphase-separated morphology has been a critical factor governing the physical properties of ABA-type TPEs. At the specific copolymer composition, microphase separation of ABA triblock copolymer results in hard microdomains of A blocks behaving as the physical crosslinks in B soft matrix. This microphase-separated morphology is highly desired for high-performance TPEs. The volume fraction f and the production (χN) of Flory–Huggins parameter χ between blocks and degree of polymerization (N) are predominant factors in determining the microphase separation of block copolymers.25 However, the microphase separation becomes much more complicated when the crystallizable blocks are present.26 In this case, either break-out or confined crystallization of polymer segments takes place during microphase separation, depending on the strengths of crystallization and microphase-separation driving forces. As far as the block copolymers of PLA are concerned, the stereocomplex crystallization between enantiopure low-molecular-weight PLLA and PDLA has stronger driving force than their individual homo-crystallizations, because of the H-bond interactions between PLLA and PDLA segments.27–29 Therefore, the homo and stereocomplex crystallizations of PLA will alter the microstructures and morphology of block copolymers, further leading to the change of physical properties.

In this article, we selected poly(ethylene-co-butylene) (PEB) as the soft midblock and synthesized PLA–PEB–PLA TPEs from the ring-opening polymerization (ROP) of lactide using α,ω-dihydroxy telechelic PEB as a macromolecular initiator. Tacticity and stereostructure of PLA blocks were controlled by the types of lactides. Chemical structure, thermal, morphological, mechanical, and shape memory behaviors of PLA–PEB–PLA copolymers were investigated using 1H NMR spectroscopy, differential scanning calorimetry (DSC), wide-angle X-ray diffraction (WAXD), small-angle X-ray scattering (SAXS), transmission electronic microscopy (TEM), atomic force microscopy (AFM), dynamic mechanical analysis (DMA), and tensile test. Roles of homo and stereocomplex crystallizations of PLA hard blocks on the microphase-separated morphology and physical performances of copolymers were examined and discussed.

Experimental part

Materials

L-lactide and D-lactide (>99.9%) were purchased from Purac Co. (Gorinchem, the Netherlands) and purified by recrystallization from ethyl acetate. α,ω-Dihydroxy-terminated PEB oligomer (HLBH-P 3000, Mn = 3600 g mol−1, Mw/Mn = 1.11) containing 38 wt% ethylene unit and 62 wt% butylene unit were purchased from Krasol. PLLA (Mn = 121 kg mol−1, Mw/Mn = 1.54) was kindly supplied by Shimadzu Co. (Kyoto, Japan). Tin(II) 2-ethylhexanoate [Sn(Oct)2, Aldrich], 4,4′-diphenylmethane diisocyanate (MDI, J&K), and dibutyltindilaurate (DBTDL, Sinopharm Chemical Reagent Co., Ltd.) were used as received. Toluene was dried by sodium and distilled after being refluxed for 48 h.

Synthesis of α,ω-dihydroxy PEB macroinitiator (HO–PEB–OH)

α,ω-Dihydroxy PEB with high molecular weight (HMW) was prepared by coupling PEB oligomers using MDI as a coupling agent and DBTDL as a catalyst (Scheme 1).30 PEB oligomer (25 g, 6.94 mmol), MDI (1.68 g, 6.73 mmol), DBTDL (0.11 g, 0.16 mmol), and 100 ml toluene were added into the flask. The reaction was carried out at 45 °C for 5 h and 90 °C for 7 h under an argon atmosphere. After the reaction, toluene was removed by rotary evaporator and the product was dried at 80 °C in vacuo for 12 h. The as-prepared PEB was marked as PEB-x, where x represented the number-averaged molecular weight (Mn) (in kg mol−1).
image file: c4ra08612k-s1.tif
Scheme 1 Synthesis of PLA–PEB–PLA triblock copolymers.

Synthesis of PLA–PEB–PLA

A typical procedure to synthesize PLA–PEB–PLA copolymer with the expected Mns of PEB of 25 kg mol−1 and PLA blocks of 25 kg mol−1 is described as follow. 10.0 g (69.4 mmol) of L-lactide and 10.0 g of PEB were added into a Schlenk flask, which was then dried in a vacuum line at 50 °C for 0.5 h. After the flask was purged with dry argon, 150 ml of toluene and 0.06 g (0.148 mmol) of Sn(Oct)2 were injected. The dosage of Sn(Oct)2 was 0.6 wt% with respect to the amount of lactide. The polymerization was allowed to proceed at 110 °C for 12 h under an argon atmosphere. After the polymerization, the reaction mixture was precipitated into ethanol and the precipitate was dried in vacuo at 60 °C for 24 h to yield the product (18.4 g, yield: 92%). Other copolymers were synthesized by a similar method. Racemic lactide (equal amounts of L-lactide and D-lactide) was used as the monomer in synthesis of PDLLA–PEB–PDLLA. Copolymers with PLLA, PDLA, and PDLLA end-blocks were referred as L–EB–L xyx, D–EB–D xyx, and DL–EB–DL xyx, respectively, where x and y represented the Mn (in kg mol−1) of each PLA and PEB blocks derived from the NMR data (Table 1).
Table 1 Molecular Characteristics of PLA-PEB-PLA copolymers
Triblocka Yield (%) Mnb (kg mol−1) Mnc (kg mol−1) PDIc mPLAd (%) fPLAe (%) Tg,PEB (°C) Tg,PLA (°C)
a The numerals denote the Mn (in kg mol−1) of corresponding PLA and PEB blocks derived from NMR data.b Mn measured by 1H NMR.c Mn and polydispersity index (PDI) measured by GPC.d Mass fractions of PLA in copolymers derived from 1H NMR.e Volume fractions of PLA in copolymers derived from 1H NMR.
DL–EB–DL 6.6–25–6.6 85 38.2 49.1 1.73 35 26 −48.2 45.2
DL–EB–DL 8.2–25–8.2 77 41.4 52.3 1.64 40 31 −46.4 47.7
DL–EB–DL 16–25–16 73 57.0 56.4 1.54 56 47 −48.1 47.8
L–EB–L 3.6–25–3.6 85 32.2 42.5 1.72 22 16 −47.4 50.4
L–EB–L 6.5–25–6.5 87 38.0 48.2 1.58 34 26 −47.0 52.8
L–EB–L 11–25–11 92 47.0 52.1 1.54 46 37 −47.7 54.1
L–EB–L 15–25–15 83 55.0 56.6 1.37 55 45 −47.8 55.5
D–EB–D 3.4–25–3.4 82 31.8 41.0 1.73 21 16 −47.8 50.5
D–EB–D 6.1–25–6.1 87 37.2 43.2 1.56 33 25 −47.4 52.0
D–EB–D 10–25–10 78 45.0 47.5 1.50 44 35 −48.4 52.9
D–EB–D 15–25–15 81 55.0 54.2 1.38 54 44 −47.2 55.2
L–EB–L 4.3–15–4.3 90 23.6 29.3 1.75 36 28 −47.2 52.3
L–EB–L 10–15–10 87 35.0 42.0 1.31 57 48 −48.4 55.3
D–EB–D 4.5–15–4.5 89 24.0 32.1 1.64 38 29 −48.7 51.6
D–EB–D 11–15–11 89 37.0 45.3 1.31 59 49 −47.8 52.8


Copolymer film with a thickness of 0.6–0.7 mm was obtained by casting its chloroform solutions (5 wt%) on a PTFE dish, followed by evaporation of solvent at 25 °C for 24 h. The film was further dried at 70 °C in vacuo for 24 h. For the L–EB–L/D–EB–D blend film, solutions of L–EB–L and D–EB–D with the similar compositions were mixed in 1[thin space (1/6-em)]:[thin space (1/6-em)]1 (wt%) ratio before casting.

Characterization

1H NMR spectra were measured on a 400 MHz Bruker AVANCE II NMR spectrometer (Bruker BioSpin Co., Switzerland) with CDCl3 as the solvent. NMR peak of solvent was used as the reference (δ = 7.26 ppm). Volume fraction of PLA (fPLA) block was estimated from molar fraction using the published homopolymer densities (ρPLA = 1.27 and ρPEB = 0.86 g cm−3).31,32

Molecular weight and its distribution were measured on a Waters gel permeation chromatography (GPC, Waters Co., Milford, MA, USA) consisted of a Waters degasser, a Waters 1515 isocratic HPLC pump, a Waters 2414 RI detector, and two PL-gel mix C columns. The temperature of column was 30 °C and THF was used as the mobile phase. GPC was calibrated by the polystyrene standards.

Thermal behavior of copolymer was determined on a NETZSCH 214 Polyma DSC (NETZSCH, Germany) equipped with an IC70 intracooler. Sample was loaded into an aluminum DSC pans and initially heated from −70 to 190 °C (or 240 °C) at 10 °C min−1 and held at this temperature for 2 min to erase the thermal history. It was then fast cooled to −70 °C at 100 °C min−1, followed by a reheating to 190 (or 240 °C) at 10 °C min−1 to observe the cold-crystallization and melting behavior. Glass transition temperature (Tg) was obtained from the second heating process.

WAXD and SAXS were measured on the beamline BL16B1 in Shanghai Synchrotron Radiation Facility (SSRF). The wavelength of radiation source is 0.124 nm. The sample-to-detector distances were 0.13 and 2.5 m for WAXD and SAXS measurements, respectively. Scattering patterns were collected by a Rayonix SX-165 CCD detector (Rayonix, Illinois, USA) with a resolution of 2048 × 2048 pixels and a pixel size of 80 × 80 μm2 at room temperature. All the data was corrected from the background and air scattering. The acquisition times in WAXD and SAXS measurements were 30 and 60 s, respectively. Two-dimensional (2D) data was converted into the one-dimensional profile by circularly averaging with a Fit2D software.

TEM images were obtained on a JEM-1230 TEM instrument (JEOL, Tokyo, Japan) operated at an acceleration voltage of 80 kV. The sample was cryo-microtomed at −90 °C on a Leica EM UC7 ultramicrotome (Leica, Germany) and exposed to OsO4 vapors for 1 h at room temperature before measurement.

Viscoelastic properties of copolymers were measured on a DMA (Q800, TA, USA) at a frequency of 5 Hz. The temperature sweep was taken at a heating rate of 3 °C min−1 from −100 to 230 °C. Rectangular sample with a dimension of 30 × 6.3 × 0.6 mm3 was used for measurement.

Uniaxial tensile tests were conducted on a SANS electronic universal testing machine at room temperature. Dumbbell specimen with a length of 50 mm, cross-section width of 4.0 mm, and thinness of ∼0.6 mm was cut from the cast film. The crosshead speed of tensile test is 20 mm min−1. Data analysis was based on at least five measurements on each sample performed at the same conditions.

Results and discussion

Preparation of PLA–PEB–PLA

α,ω-Dihydroxy HMW PEB was prepared through extending PEB oligomers under the presence of MDI coupling agent and DBTDL catalyst (Scheme 1). The chain extension was verified from GPC and 1H-NMR results (Fig. 1). GPC analysis showed that the molecular weight of PEB increased significantly after chain extension. Resonance peaks corresponding to the methyl, methylene, and methine protons of PEB oligomer are seen at 0.83 (peak c) and 1.12–1.37 ppm (peak a, b) in the 1H NMR spectrum (Fig. 1). After the chain extension reaction, the resonance peak of CH2 proton linked to the terminal hydroxyl group of PEB oligomer (peak d of PEB-3.6k) shifted from 3.65 to 4.10 ppm (peak e of PEB-25k) and the characteristic peaks of MDI (peak f, i, j in PEB-25k)33 were presented (Fig. 1). This confirmed the reaction between terminal hydroxyl groups of PEB oligomers and isocyanate groups of MDI. Furthermore, the appearance of 3.65 ppm peak (peak d of PEB-25k) in chain-extended PEB demonstrated that the as-prepared HMW PEB was terminated by hydroxyl functionality. Two kinds of PEBs with different molecular weights, PEB-15k (Mn,GPC = 26.8 kg mol−1, PDI = 1.62, Mn,NMR = 15.1 kg mol−1) and PEB-25k (Mn,GPC = 38.9 kg mol−1, PDI = 1.91, Mn,NMR = 25.3 kg mol−1), were synthesized, in which Mn,GPC was the Mn measured by GPC and Mn,NMR was the Mn calculated by comparing the NMR peak intensities of methyl protons in PEB chains and methylene protons neighboring to terminal hydroxyls.
image file: c4ra08612k-f1.tif
Fig. 1 1H NMR spectra of PEB-3.6k, PEB-25k, and PLA–PEB–PLA in CDCl3. The insets showed enlarged spectrum in 3.4–4.4 ppm.

PLA–PEB–PLA copolymers were synthesized by the ROP of lactide using α,ω-dihydroxyl PEB as the macroinitiator. Copolymer composition and molecular weight were adjusted through varying the lactide-to-macroinitiator feed ratio. ROP of lactide showed relatively high yield (Table 1). The resonance peaks corresponding to the methyl, methine, and terminal methine protons of PLA are seen at ∼1.5 (peak k), 5.1 (peak l), and 4.3 ppm (peak m) in the 1H NMR spectrum of PLA–PEB–PLA (Fig. 1), respectively.34 In the triblock copolymer, the chemical shifts attributed to PEB block were essentially the same as those of PEB macroinitiator. After ROP, the resonance peak for CH2 proton of PEB macroinitiator linked to the terminal hydroxyl group (peak d of PEB-25k) shifted from 3.65 to 4.06 ppm (peak d of PLA–PEB–PLA). The molecular weights of triblock copolymers were measured by GPC and were also calculated by comparing NMR peak intensities of methyl proton of PEB block and methine proton of PLA block (Table 1). Both the molecular weights measured from GPC and NMR increased and its polydispersity index decreased with increasing the PLA block length. These results proved that PLA–PEB–PLA triblock copolymers were successful synthesized.

Thermal and crystallization behavior

Thermal properties of PLA–PEB–PLA copolymers were assessed via DSC. Because of the amorphous nature of PDLLA, the copolymers containing PDLLA end-blocks did not show any melting peak, except for the glass transition (Fig. 2a). As expected, the triblock copolymers, which contained enantiopure PLLA or PDLA blocks and had the similar compositions, exhibited similar melting behavior. The L–EB–L or D–EB–D copolymers containing longer PLLA or PDLA blocks (15k) showed single, prominent melting endotherm at around 160 °C, similar as PLLA homopolymer. However, multiple melting endotherms were observed for the copolymers with the smaller molecular weights (<11k) of PLLA or PDLA blocks. This is possibly attributed to the fractional crystallization of PLA in microdomains formed in solvent casting.35 PLA segments segregated into the microdomains with different sizes would have different nucleation mechanism, crystallization kinetics, and crystalline orderness, resulting in the broad distribution of crystallite sizes and multiple melting endotherms upon heating.35 Thermal behavior of L–EB–L/D–EB–D 1/1 blend was also evaluated. The melting endotherms of blends were close to 220 °C and no endotherm of PLLA or PDLA homo-crystallites was observed (Fig. 2b). This demonstrated that the PLLA/PDLA stereocomplex crystallites were exclusively formed in solvent casting. The relative intensity of melting peak increased with increasing the molecular weight of PLA block.
image file: c4ra08612k-f2.tif
Fig. 2 DSC heating curves for solvent-cast samples of (a) PLA–PEB–PLA, PLLA, PEB and (b) PLLA–PEB–PLLA/PDLA–PEB–PDLA 1/1 blends.

Upon heating of melt-quenched samples (Fig. 3a), all the copolymers showed two different Tgs in −47 to −49 and 45–55 °C, attributed to the PEB- and PLA-rich domains, respectively. Tg of PEB-rich domain was relatively invariant over the composition and molecular weight. However, Tg of PLA-rich domain increased with increasing the length of PLA block (Table 1), in agreement with the results of PLA homopolymers.36 The copolymers bearing PDLLA blocks had lower Tg than those containing enantiopure PLLA or PDLA blocks, because of the amorphous characteristics of PDLLA.37


image file: c4ra08612k-f3.tif
Fig. 3 DSC heating curves for melt-quenched samples of (a) PLA–PEB–PLA, PLLA, PEB and (b) PLLA–PEB–PLLA/PDLA–PEB–PDLA 1/1 blends.

Crystallization behavior of melt-quenched copolymers strongly depended on the molecular weight. Even though the PLA homopolymers with lower molecular weights can crystallize faster,36 no prominent cold-crystallization and melting was observed for the copolymers or enantiomeric blends containing the shorter PLLA or PDLA blocks such as L–EB–L 6.5–25–6.5, D–EB–D 6.1–25–6.1, and L–EB–L 6.5–25–6.5/D–EB–D 6.1–25–6.1 blend (Fig. 3). Confinement and steric effects of PEB domains on the crystallization of PLA blocks could be responsible for this behavior. For the copolymers or enantiomeric blends bearing the longer PLLA or PDLA blocks, a cold-crystallization exotherm was observed between the Tg and melting temperature (Tm) of PLA (Fig. 3), in agreement with the result of PLLA homopolymer. Similar to the solvent-cast enantiomeric blends, PLLA/PDLA stereocomplex crystallites with the higher Tm were exclusively generated during the heating of melt-quenched enantiomeric blends.

Crystalline structure of PLA–PEB–PLA and their enantiomeric blends were examined by WAXD (Fig. 4 and S1). DL–EB–DL copolymers did not show any diffraction peak in WAXD patterns. WAXD patterns of L–EB–L and D–EB–D copolymers were essentially the same as that of PLLA homopolymer. L–EB–L and D–EB–D copolymers formed the α-form homocrystallites and the relative intensity of diffraction peaks increased with increasing the PLA block length (Fig. 4a and S1a). It is notable that the used X-ray had a wavelength of 0.124 nm, which was different from the conventional X-ray (0.154 nm). Therefore, the Bragg angles of WAXD peaks were different from the literatures,36 while the calculated lattice dimensions were the same. The enantiomeric L–EB–L/D–EB–D blends just exhibited diffractions of stereocomplex crystallites in both solvent casting (Fig. 4b) and melt crystallization (Fig. S1b). This is consistent with the reports of Tsuji et al. that the stereocomplex crystallization is preferential in the low-molecular-weight PLLA/PDLA blends, regardless of the crystallization conditions.38,39


image file: c4ra08612k-f4.tif
Fig. 4 WAXD patterns for solvent-cast samples of (a) PLA–PEB–PLA, PLLA and (b) PLLA–PEB–PLLA/PDLA–PEB–PDLA 1/1 blends. The wavelength of X-ray is 0.124 nm. Hc and sc represent the homo and stereocomplex crystallites, respectively.

Morphological characteristic

Microphase-separated morphologies of PLA–PEB–PLA copolymers were assessed via SAXS, TEM, and AFM at room temperature. Fig. 5 shows the one-dimensional SAXS profiles of solvent-cast and melt-quenched PLA–PEB–PLA copolymers. DSC and WAXD data have confirmed that both PLA and PEB blocks were amorphous in melt-quenched samples. No discernable scattering peak was observed in PLLA homopolymer. SAXS profiles of PLA–PEB–PLA showed a broad principal reflection (q*) followed by the higher oscillations at higher scattering angle, indicating the microphase-separated structure with relatively poor orderness. This coincides with the SAXS patterns of PLA–PI–PLA18 and PLA–PM–PLA20 triblock copolymers. The relatively poor microphase-separated structure may be ascribed to the broad molecular weight distribution of PEB block, which leads to the increased compositional heterogeneity in block copolymers.40
image file: c4ra08612k-f5.tif
Fig. 5 SAXS patterns of (a) solvent-cast and (b) melt-quenched PLA–PEB–PLA copolymers and PLLA homopolymer.

On the basis of the principal scattering peak, average spacing of microphase-separated domains (D) was evaluated by D = 2π/q*. Morphological behavior of PLA–PEB–PLA is influenced by its preparation procedure and thermal history. Although most of the solvent-cast and melt-quenched samples showed the similar SAXS patterns and D values (Table 2), several features should be addressed by comparing their scattering patterns (Fig. 5). First, the melt-quenched and solvent-cast DL–EB–DL copolymers exhibited almost the same SAXS profiles and D values, since PDLLA was non-crystallizable and remained the similar amorphous structures in these two kinds of samples. Second, the principal reflections were not observed in the solvent-cast L–EB–L copolymers bearing longer PLLA blocks (e.g., L–EB–L 11–25–11 and L–EB–L 15–25–15) (Fig. 5a), while they could be clearly seen after melt-quenching (Fig. 5b). Third, solvent-cast L–EB–L 3.6–25–3.6 sample showed a shoulder at q = 0.188 nm−1 compared to its melt-quenched analog, indicating the presence of hexagonally packed cylinders of PLLA in a matrix of PEB with a domain spacing of 33.4 nm. All of these results suggested that the crystallization of PLA segments in solvent casting decreased the morphological orderness. During the evaporation of solvent, the crystallization of PLA segments and microphase separation of PLA and PEB blocks occurred simultaneously. When the crystallization driving force is stronger than that of microphase separation, the break-out crystallization of crystallizable segments will span different microdomains and destroy the microphase-separated morphology.26

Table 2 Morphological characteristics of PLA–PEB–PLA copolymers
Sample Morphologya Melt quenched Solvent cast
q* (nm−1) Db (nm) q* (nm−1) Db (nm)
a Morphology was evaluated from the SAXS data.b Domain spacing, D = 2π/q*.
DL–EB–DL 6.6–25–6.6 Cylindrical 0.187 33.5 0.185 33.9
DL–EB–DL 16–25–16 Cylindrical 0.174 36.1 0.171 36.7
L–EB–L 3.6–25–3.6 Spherical 0.293 21.4 0.286, 0.188 21.9, 33.4
L–EB–L 6.5–25–6.5 Cylindrical 0.184 34.1 0.183 34.3
L–EB–L 11–25–11 Lamellar 0.143 43.9
L–EB–L 15–25–15 Lamellar 0.111 56.6
L–EB–L 4.3–15–4.3 Cylindrical 0.285 22.0 0.263 23.9
L–EB–L/D–EB–D blend Disorder


Morphologies of PLA–PEB–PLA copolymers were determined by comparing the followed reflections with the principal reflection using the ratio q/q*. Volume fraction of blocks is a predominant factor in determining the ordered structure of microphase separation. Sample of L–EB–L 3.6–25–3.6 with a low fPLA (0.16) mainly corresponded to the spherical morphology, in which PLA spheres dispersed in the amorphous PEB matrix (Fig. 5b). As the fPLA increased to above 0.37 (e.g., L–EB–L 11–25–11 and L–EB–L 15–25–15), broad scattering peaks at 2, 3, and 4q* were observed in SAXS profiles, indicating the lamellar morphology.41 The copolymers with a medium fPLA (e.g., L–EB–L 6.5–25–6.5, L–EB–L 4.3–15–4.3, and DL–EB–DL 6.6–25–6.6) showed the higher-ordered reflections at √3, √4, and √7q*, consistent with the hexagonally packed cylindrical morphology of PLA in PEB matrix.41,42

Generally, the domain spacing of PLA–PEB–PLA increased with increasing fPLA (Table 2). As fPLA increased from 0.16 (L–EB–L 3.6–25–3.6) to 0.45 (L–EB–L 15–25–15), the domain spacing of melt-quenched L–EB–L increased from 21.4 to 56.6 nm, in agreement with those of PLA–PI–PLA copolymers with the similar fPLA values.18 Even though L–EB–L 6.5–25–6.5 and L–EB–L 4.3–15–4.3 samples had the similar fPLA, the domain spacing of the former is larger, due to the increased molecular weight and segregation length.

Notably, even though the similar copolymer compositions, the DL–EB–DL 16–25–16 (fPLA = 0.47) sample adopted a hexagonally packed cylindrical morphology, while the L–EB–L 15–25–15 sample (fPLA = 0.45) formed a lamellar morphology (Fig. 5 and Table 2). This may be due to the different compatibility of PDLLA/PEB and PLLA/PEB pairs. Generally, the semicrystalline PLLA segments would have worse compatibility with PEB than amorphous PDLLA segments, resulting in the larger χN parameter of L–EB–L than DL–EB–DL under the similar molecular weights. Therefore, lamellar morphology would be favored for L–EB–L copolymer.25 On the other hand, the crystallization of PLLA blocks in L–EB–L copolymer can also drive the preferential separation into a lamellar structure.26

Microphase-separated morphologies of PLA–PEB–PLA copolymers were also confirmed by TEM and AFM (Fig. 7 and 8). Both TEM and AFM results indicated that the copolymers with smaller fPLA (e.g., L–EB–L 3.6–25–3.6) formed the spherical morphology, even though the relatively broad distribution of sphere size. TEM and AFM images of L–EB–L 11–25–11 and L–EB–L 15–25–15 exhibited stripes of alternating contrast or finger print region, which could correspond to the lamellae. The light region of stripes may correspond to the crystalline PLLA domains, while the stained dark regions presumably correspond to the PEB and amorphous fraction of PLA.

Morphological behavior of PLA–PEB–PLA is strongly affected by stereocomplexation of PLLA and PDLA blocks. We cannot observe the distinct principal reflections and other ordered oscillations at higher scattering angle in the SAXS patterns of L–EB–L/D–EB–D blends (Fig. 6), particularly for the solvent-casting samples. This is much different from those observed for L–EB–L and DL–EB–DL (Fig. 5). Even though the melt-quenched blends exhibited several broad scattering peaks, these scattering peaks could not be assigned to a specific ordered structures. With combination of TEM and AFM data (Fig. 7 and 8), we concluded that the microphase-separated morphology of enantiomeric blends lacked of long-range orderness, which was likely due to the preferential stereocomplexation between PLLA and PDLA segments. Because of the H-bond interactions between PLLA and PDLA segments,27–29 the driving force of stereocomplexation would overwhelm that of microphase separation. Previous studies have demonstrated that the stereocomplexation can lead to the aggregation of PLLA/PDLA chains from the solution state.43 Therefore, stereocomplexation would precede the microphase separation upon solvent evaporation when casting the L–EB–L/D–EB–D blends. The stereocomplex crystallites would interrupt the microphase separation and prevent the enantiomeric blends from forming long-range ordered morphology. As seen in Fig. 6, the melt-quenched samples showed more distinct principal reflections than those of solvent-cast sample, indicating the former had relatively more ordered microphase-separated structure. This is due to the fact that the PLLA/PDLA stereocomplex crystallization was partially prevented in the melt-quenching process.


image file: c4ra08612k-f6.tif
Fig. 6 SAXS patterns of (a) solvent-cast and (b) melt-quenched L–EB–L/D–EB–D 1/1 blends.

image file: c4ra08612k-f7.tif
Fig. 7 TEM photographs of PLA–PEB–PLA and L–EB–L/D–EB–D 1/1 blend.

image file: c4ra08612k-f8.tif
Fig. 8 AFM phase images of PLA–PEB–PLA and L–EB–L/D–EB–D 1/1 blend.

Mechanical properties

Mechanical properties of PLA–PEB–PLA copolymers and their enantiomeric blends were measured using uniaxial tensile tests, as shown in Fig. 9 and S2. The results of tensile strength, Young's modulus, and strain at break are summarized in Table 3. A linear response was observed in the stress–strain curves for all the samples at low strain. PLA is a typical stiff and brittle polymer with a tensile strength of >40 MPa, a Young's modulus of >1.4 GPa, and a strain at break of <10%.37,44 In contrast, the triblock copolymers exhibited higher strain at break, lower strength and modulus, corresponding to the characteristics of TPEs. The elastic recovery of DL–EB–DL 6.6–25–6.6 copolymer under repeated stretching cycles was also measured. As the stretching cycles increased, the stress–strain behavior was nearly identical for cycles 3–13 (Fig. S3). The residual strain increased with each cycle and then kept as 4% after 13 cycles, indicating that the copolymer had a good ability of elastic recovery.21
image file: c4ra08612k-f9.tif
Fig. 9 Representative stress–strain curves of PLA–PEB–PLAs and their enantiomeric blends.
Table 3 Tensile properties of PLA–PEB–PLA copolymers and their enantiomeric blends
Sample Tensile strength (MPa) Young's modulus (MPa) Strain at break (%)
DL–EB–DL 6.6–25–6.6 1.45 ± 0.12 2.44 ± 0.19 394 ± 32
DL–EB–DL 8.2–25–8.2 1.56 ± 0.09 3.76 ± 0.18 284 ± 19
DL–EB–DL 16–25–16 1.60 ± 0.05 4.25 ± 0.40 274 ± 21
L–EB–L 3.6–25–3.6 0.80 ± 0.04 2.53 ± 0.25 242 ± 12
L–EB–L 6.5–25–6.5 2.34 ± 0.09 7.62 ± 0.70 291 ± 19
L–EB–L 11–25–11 2.98 ± 0.11 13.4 ± 0.99 215 ± 18
L–EB–L 15–25–15 6.48 ± 0.28 84.1 ± 4.99 97 ± 13
L–EB–L 4.3–15–4.3 2.78 ± 0.09 8.52 ± 0.41 224 ± 7
L–EB–L 3.6–25–3.6/D–EB–D 3.4–25–3.4 1.47 ± 0.01 5.89 ± 0.35 144 ± 6
L–EB–L 6.5–25–6.5/D–EB–D 6.1–25–6.1 3.34 ± 0.12 14.3 ± 0.75 126 ± 8
L–EB–L 4.3–15–4.3/D–EB–D 4.5–15–4.5 3.63 ± 0.06 12.6 ± 0.71 126 ± 10


Mechanical properties of triblock copolymers were strongly dependent on the copolymer composition and crystalline structure of PLA blocks (Fig. 9 and Table 3). For the copolymers containing the same PEB block length, the tensile strength and Young's modulus increased while the strain at break generally decreased as the fPLA increased (Fig. 9 and S2). In the case of L–EB–L copolymers, increasing the PLLA content from 34 (L–EB–L 6.5–25–6.5) to 55 wt% (L–EB–L 15–25–15) led to a 10-fold increase of modulus, a 177% increase of tensile strength, while a 67% decrease of the strain at break. For the triblock copolymers with the similar PEB/PLLA ratio (e.g., L–EB–L 6.5–25–6.5 and L–EB–L 4.3–15–4.3), the tensile strength and Young's modulus increased while the strain at break decreased with the decrease of PEB block length.

Under the similar copolymer compositions, the triblock copolymers exhibited larger strain at break, smaller strength and modulus, and higher transparency when the PEB soft block was connected to the PDLLA glassy end blocks (Fig. 9 and S4). This may be due to the more ductility of PDLLA hard domains than that of PLLA. The best ductility was shown with the strain at break of 394% for DL–EB–DL 6.6–25–6.6 sample, meeting the mechanical properties of TPEs. The good mechanical behavior of PLA–PEB–PLA was attributed to the alternating structure comprised of hard PLA and soft rubbery PEB blocks. The triblock copolymers assembled into the hard and soft domains in microphase separation. The hard block domains acted as physical cross-linking and provided higher strength and modulus, while the soft domains afforded the enhanced ductility. Notably, the strain at break of PLA–PEB–PLA triblock copolymers was lower than that of several PLA-containing TPEs reported in literatures such as PLA–PM–PLA20 and PLA–PMCL–PLA.21 This is likely due to the low molecular weight, broad molecular weight distribution and relatively stiffness of PEB midblock used in this work.

Stereocomplexation of L–EB–L/D–EB–D blend led to different mechanical properties of triblock copolymer. Relative to the DL–EB–DL and L–EB–L copolymers, the 1/1 L–EB–L/D–EB–D blends were difficult to form uniform films in solution casting. Only the blends with smaller PLA fractions (e.g., L–EB–L 3.6–25–3.6/D–EB–D 3.4–25–3.4 and L–EB–L 6.5–25–6.5/D–EB–D 6.1–25–6.1) formed the integrated films, while the solution-cast films of copolymers with higher PLA fractions (e.g., L–EB–L 11–25–11/D–EB–D 10–25–10 and L–EB–L 15–25–15/D–EB–D 15–25–15) ruptured during solvent evaporation (Fig. S4). This demonstrated that stereocomplexation significantly increased the brittleness of materials. The enantiomeric blends had higher modulus and tensile strength while smaller strain at break than the DL–EB–DL and L–EB–L copolymers with similar compositions. An increase in tensile strength of about 43% and an enhancement in Young's modulus of 88% were observed for the L–EB–L 6.5–25–6.5/D–EB–D 6.1–25–6.1 blend when compared to the L–EB–L 6.5–25–6.5 copolymer. The higher tensile strength and modulus of stereocomplex crystallites than homo-crystalline or amorphous PLA were responsible for this behavior.45

Fig. 10 showed the representative storage modulus and loss tangent (tan[thin space (1/6-em)]δ) curves for PLA–PEB–PLA and their enantiomeric blends. We observed the abrupt decrease of storage modulus in the temperature ranges of −50 to −10, 50–90, and >100 °C, corresponding to the glass transitions of PEB, PLA, and melting or softening of PLA, respectively. Two relaxation peaks were detected in the tan[thin space (1/6-em)]δ curves at −50–−10 and 50–90 °C of triblock copolymers, ascribed to the glass transition of PEB and PLA blocks, respectively. Notably, the glass transition of PLA in L–EB–L/D–EB–D blends are less obvious than those observed in DL–EB–DL and L–EB–L (Fig. 10, S5 and S6), which may be due to the high degree of crystallinity of PLLA/PDLA stereocomplex crystallites. The temperatures corresponding to the glass transition peak of PEB segments changed little with varying the PLLA content, indicating that the mobility of soft block was not influenced by the restriction imposed by the hard phase. DMA curves of triblock copolymers varied with the copolymer composition and crystalline structure of PLA segments. Analogous to the results of tensile test, increasing the content of PLA hard segments resulted in an enhancement of storage modulus (Fig. 10, S5 and S6). Compared to the copolymers with amorphous hard block, crystallization of PLA blocks increased the storage modulus and this increase is more remarkable for the stereocomplex crystallized L–EB–L/D–EB–D blends.


image file: c4ra08612k-f10.tif
Fig. 10 Representative DMA curves of (a) storage modulus and (b) tan[thin space (1/6-em)]δ as a function of temperature for PLA–PEB–PLAs and their enantiomeric blends.

Shape memory behavior

As discussed in previous sections, these physically cross-linked PLA–PEB–PLA elastomers had microphase-separated soft and hard domains with distinct Tgs, which could be used as the thermally-induced shape memory materials. Shape memory behavior of PLA–PEB–PLA copolymers and its dependence on crystallization of PLA segments are visually demonstrated in Fig. 11. The solvent-cast PLA–PEB–PLA films with an original rectangular shape (permanent shape) were deformed to a temporary helix shape above the Tg of PLA and then fixed by cooling to room temperature. Since L–EB–L copolymers were more rigid than DL–EB–DL, a higher deformation temperature of 90 °C was used. Because the L–EB–L/D–EB–D blends were too stiff to be deformed under the investigated temperature, their shape memory behavior was not assessed. Interestingly, after reheating the helical-shaped DL–EB–DL copolymers to 70 °C, they can quickly recover to the original shape in 20 s (Fig. 11a and b). The ability of shape recovery was quantitatively assessed by using a stretched temporary shape (Fig. S7). It was found that, after stretching an original rectangular shape from 20 to 27 mm, it resumed to 21 mm after reheating. The recovery ratios of DL–EB–DL 6.6–25–6.6 and DL–EB–DL 16–25–16 were approximately 86%, indicating that they recovered well in this case. However, when the helical-shaped L–EB–L copolymers were reheated, they were not able to recover to the original shape completely. Furthermore, the degree of shape recovery of L–EB–L 15–25–15 was lower than that of L–EB–L 6.5–25–6.5, meaning that the ability of shape memory became worse with increasing the fraction of hard segments (Fig. 11c and d).
image file: c4ra08612k-f11.tif
Fig. 11 Shape memory properties of PLA–PEB–PLA. Left: permanent shape; middle: temporary shape; right: recovered permanent shape.

In PLA–PEB–PLA copolymers, the hard phase formed from PLA segments provided the mechanical strength for the material and was also responsible for the fixation of permanent shape. The change of flexibility of PLA segments above the transition temperature (Tg of PLA) accounted for the shape memory effect of triblock copolymers. The glass transition of PLA in amorphous region was responsible for the shape memory ability of PLA–PEB–PLA copolymers.46,47 In the case of DL–EB–DL, the amorphous PDLLA segments showed entropy elasticity with heating to the deformation temperature above Tg. The entropy increased and decreased at the same quantity during the shape memory, so the amorphous segments would lead the material recovering to its original shape.48 Because the crystallization of PLLA segments decreased the amount of polymer chains in the amorphous glassy regions, the shape memory ability of L–EB–L copolymers was diminished with the crystallization of PLLA blocks.

Conclusion

A series of PLA–PEB–PLA TPEs with varying chemical compositions, molecular weights, and stereo-structures were synthesized and characterized. The HMW α,ω-dihydroxy PEBs were first prepared and used as the macroinitiator for the ROP of lactide. Morphological, thermal, mechanical, and shape memory behaviors of PLA–PEB–PLA can be readily modulated by varying the copolymer composition and tacticity of PLA blocks. PLLA/PDLA stereocomplex crystallites were formed in the L–EB–L/D–EB–D enantiomeric blends, leading to the enhanced melting point. As indicated by SAXS, TEM, and AFM, L–EB–L copolymers changed from spherical, cylindrical, to lamellar morphology with the fPLA increased. Due to the preceding PLLA/PDLA stereocomplexation before microphase separation, L–EB–L/D–EB–D blends exhibited less ordered morphology than the L–EB–L or DL–EB–DL copolymers. The Young's modulus and tensile strength of triblock copolymers increased, while the strain at break decreased with the crystallization or stereocomplexation of PLA hard blocks. The triblock copolymers containing non-crystallizable PDLLA blocks displayed shape memory behavior, which, however, diminished in their semicrystalline analogs. This study has demonstrated that the morphology and physical properties of ABA-type TPEs can be symmetrically tuned through the crystallization or intermolecular interactions between the hard blocks, and also shed light on understanding and controlling the microphase-separated structures of semicrystalline block copolymers.

Acknowledgements

This work was financially supported by the Natural Science Foundation of China (51103127, 21274128) and State Key Laboratory of Chemical Engineering (SKL-ChE-12D06). Synchrotron radiation WAXD and SAXS experiments were performed at the BL16B beamline of Shanghai Synchrotron Radiation Facility (SSRF).

References

  1. J.-M. Raquez, Y. Habibi, M. Murariu and P. Dubois, Prog. Polym. Sci., 2013, 38, 1504–1542 CrossRef CAS PubMed .
  2. H. Y. Tian, Z. H. Tang, X. L. Zhuang, X. S. Chen and X. B. Jing, Prog. Polym. Sci., 2012, 37, 237–280 CrossRef CAS PubMed .
  3. P. J. Pan and Y. Inoue, Prog. Polym. Sci., 2009, 34, 605–640 CrossRef CAS PubMed .
  4. Y. Ikada, K. Jamshidi, H. Tsuji and S.-H. Hyon, Macromolecules, 1987, 20, 904–906 CrossRef CAS .
  5. H. Tsuji, Macromol. Biosci., 2005, 5, 569–597 CrossRef CAS PubMed .
  6. M. Kakuta, M. Hirata and Y. Kimura, Polym. Rev., 2009, 49, 107–140 CrossRef CAS .
  7. R. M. Rasal, A. V. Janorkar and D. E. Hirt, Prog. Polym. Sci., 2010, 35, 338–356 CrossRef CAS PubMed .
  8. L. B. Wu, C. L. Jin and X. Y. Sun, Biomacromolecules, 2011, 12, 235–241 CrossRef CAS PubMed .
  9. M. L. Jiao, K. Yang, W. X. Zhang, W. Pan, R. W. Zhang and S. Xie, J. Macromol. Sci., Part B: Phys., 2011, 50, 2103–2115 CrossRef CAS .
  10. R. M. Michell, A. J. Müller, A. Boschetti-de-Fierro, D. Fierro, V. Lison, J.-M. Raquez and P. Dubois, Polymer, 2012, 53, 5657–5665 CrossRef CAS PubMed .
  11. I. Lee, T. R. Panthani and F. S. Bates, Macromolecules, 2013, 46, 7387–7398 CrossRef CAS .
  12. M. Hirata, K. Masutani and Y. Kimura, Biomacromolecules, 2013, 14, 2154–2161 CrossRef CAS PubMed .
  13. L. Sipos, M. Zsuga and G. Deak, Macromol. Rapid Commun., 1995, 16, 935–940 CrossRef CAS .
  14. S. Zhang, Z. Hou and K. E. Gonsalves, J. Polym. Sci., Part A: Polym. Chem., 1996, 34, 2737–2742 CrossRef CAS .
  15. Z. Zhang, D. W. Grijpma and J. Feijen, Macromol. Chem. Phys., 2004, 205, 867–875 CrossRef CAS .
  16. K. Stridsberg and A.-C. Albertsson, J. Polym. Sci., Part A: Polym. Chem., 2000, 38, 1774–1784 CrossRef CAS .
  17. J.-H. Kim and J. H. Lee, Macromol. Res., 2002, 10, 54–59 CrossRef CAS .
  18. E. M. Frick, A. S. Zalusky and M. A. Hillmyer, Biomacromolecules, 2003, 4, 216–223 CrossRef CAS PubMed .
  19. C. L. Wanamaker, L. E. O'Leary, N. A. Lynd, M. A. Hillmyer and W. B. Tolman, Biomacromolecules, 2007, 8, 3634–3640 CrossRef CAS PubMed .
  20. C. L. Wanamaker, M. J. Bluemle, L. M. Pitet, L. E. O'Leary, W. B. Tolman and M. A. Hillmyer, Biomacromolecules, 2009, 10, 2904–2911 CrossRef CAS PubMed .
  21. M. T. Martello and M. A. Hillmyer, Macromolecules, 2011, 44, 8537–8545 CrossRef CAS .
  22. N.-Y. Kim, Y. S. Yun, J.-Y. Lee, C. Choochottiros, H.-R. Pyo, I.-J. Chin and H.-J. Jin, Macromol. Res., 2011, 19, 943–947 CrossRef CAS .
  23. P. Olsen, T. Borke, K. Odelius and A.-C. Albertsson, Biomacromolecules, 2013, 14, 2883–2890 CrossRef CAS PubMed .
  24. T. Lebarbe, E. Ibarboure, B. Gadenne, C. Alfos and H. Cramail, Polym. Chem., 2013, 4, 3357–3369 RSC .
  25. M. W. Matsen and R. B. Thompson, J. Chem. Phys., 1999, 111, 7139–7146 CrossRef CAS PubMed .
  26. W. N. He and J.-T. Xu, Prog. Polym. Sci., 2012, 37, 1350–1400 CrossRef CAS PubMed .
  27. P. J. Pan, J. J. Yang, G. R. Shan, Y. Z. Bao, Z. X. Weng, A. Cao, K. Yazawa and Y. Inoue, Macromolecules, 2012, 45, 189–197 CrossRef CAS .
  28. J. M. Zhang, H. Sato, H. Tsuji, I. Noda and Y. Ozaki, Macromolecules, 2005, 38, 1822–1828 CrossRef CAS .
  29. J.-R. Sarasua, N. L. Rodríguez, A. L. Arraiza and E. Meaurio, Macromolecules, 2005, 38, 8362–8371 CrossRef CAS .
  30. J. Wu, Q. Ge and P. T. Mather, Macromolecules, 2010, 43, 7637–7649 CrossRef CAS .
  31. U. Siemann, Eur. Polym. J., 1992, 28, 293–297 CrossRef CAS .
  32. L. J. Fetters, D. J. Lohse, D. Richter, T. A. Witten and A. Zirkel, Macromolecules, 1994, 27, 4639–4647 CrossRef CAS .
  33. A. M. de Ilarduya, E. Carvalho, A. Alla and S. Munoz-Guerra, Macromolecules, 2010, 43, 3990–3993 CrossRef .
  34. N. Ding, B. Q. Shentu, P. J. Pan, G. R. Shan, Y. Z. Bao and Z. X. Weng, Ind. Eng. Chem. Res., 2013, 52, 12897–12905 CrossRef CAS .
  35. A. J. Müller, V. Balsamo and M. L. Arnal, Adv. Polym. Sci., 2005, 190, 1–63 CrossRef .
  36. P. J. Pan, W. H. Kai, B. Zhu, T. Dong and Y. Inoue, Macromolecules, 2007, 40, 6898–6905 CrossRef CAS .
  37. P. J. Pan, B. Zhu and Y. Inoue, Macromolecules, 2007, 40, 9664–9671 CrossRef CAS .
  38. H. Tsuji, S.-H. Hyon and Y. Ikada, Macromolecules, 1991, 24, 5651–5656 CrossRef CAS .
  39. H. Tsuji and Y. Ikada, Macromolecules, 1993, 26, 6918–6926 CrossRef CAS .
  40. N. A. Lynd, A. J. Meuler and M. A. Hillmyer, Prog. Polym. Sci., 2008, 33, 875–893 CrossRef CAS PubMed .
  41. C. Shin, D. Y. Ryu, J. Huh, J. H. Kim and K.-W. Kim, Macromolecules, 2009, 42, 2157–2160 CrossRef CAS .
  42. A. K. Schmitt and M. K. Mahanthappa, Macromolecules, 2014, 47, 4346–4356 CrossRef CAS .
  43. D. Portinha, F. Boué, L. Bouteiller, G. Carrot, C. Chassenieux, S. Pensec and G. Reiter, Macromolecules, 2007, 40, 4037–4042 CrossRef CAS .
  44. S. Ghosh, J. C. Viana, R. L. Reis and J. F. Mano, Polym. Eng. Sci., 2007, 47, 1141–1147 CAS .
  45. H. Tsuji and Y. Ikada, Polymer, 1999, 40, 6699–6708 CrossRef CAS .
  46. X. T. Zheng, S. B. Zhou, X. H. Li and J. Weng, Biomaterials, 2006, 27, 4288–4295 CrossRef CAS PubMed .
  47. K. Du and Z. H. Gan, J. Mater. Chem. B, 2014, 2, 3340–3348 RSC .
  48. A. Lendlein and S. Kelch, Angew. Chem., Int. Ed., 2002, 41, 2034–2057 CrossRef CAS .

Footnote

Electronic supplementary information (ESI) available: Figures showing WAXD patterns, transparency, tensile stress–strain curves, DMA profiles, and shape recovery ability of PLA–PEB–PLA. See DOI: 10.1039/c4ra08612k

This journal is © The Royal Society of Chemistry 2014
Click here to see how this site uses Cookies. View our privacy policy here.