Fast determination of phthalate ester residues in soft drinks and light alcoholic beverages by ultrasound/vortex assisted dispersive liquid–liquid microextraction followed by gas chromatography-ion trap mass spectrometry

Mario Vincenzo Russo*a, Ivan Notardonatoa, Pasquale Avinob and Giuseppe Cinellia
aDipartimento Agricoltura, Ambiente e Alimenti, Università del Molise, via De Sanctis, 86100 Campobasso, Italy. E-mail: mvrusso@unimol.it; Fax: +39-0874-404652; Tel: +39-0874-404631
bDIT, INAIL Settore Ricerca, via IV Novembre 144, 00187 Rome, Italy

Received 12th August 2014 , Accepted 20th October 2014

First published on 20th October 2014


Abstract

An ultrasound/vortex assisted dispersive liquid–liquid microextraction (USVADLLME) procedure coupled with gas chromatography–ion trap mass spectrometry (GC-IT-MS) is proposed for the rapid determination of seven phthalate esters in soft drinks and light alcoholic beverages (up to 6% alcohol by volume). Under the optimum conditions, the enrichment factors of the seven phthalate esters ranged from 205-fold to 315-fold for soft drinks and from 172-fold to 285-fold for light alcoholic beverages. The recoveries varied between 94.2% and 99.6% for soft drinks and 95.6% and 99.4% for light alcoholic beverages. The limits of detection were between 0.03 and 0.10 pg μL−1 and the limits of quantification were between 0.11 and 0.28 pg μL−1. The intra-day and inter-day precision expressed as the relative standard deviation varied between 2.9% and 5.1% and between 5.5% and 7.6%, respectively. The proposed USVADLLME-GC-IT-MS method was demonstrated to be simple, reproducible and practical for the determination of trace amounts of seven phthalate esters in soft drinks and light alcoholic beverages.
1. Introduction

Phthalate esters (PAEs), are a group of chemicals which are used to make plastics more flexible and harder to break, and which are a risk to human health because they can accumulate in the body. Chronic poisoning by PAEs can cause serious damage to the liver and reproductive system in humans.1 There is wide exposure to PAEs because vinyl is a ubiquitous plastic used domestically, in medical devices and in children's toys and equipment.2 Humans are also exposed to low levels of PAEs by eating food packaged in plastics containing PAEs. Although PAEs are suspected to be endocrine disruptors,3 their effects on human health are not yet fully known, although they are being studied by several international government agencies, e.g., the US Food and Drug Administration and the National Institute of Environmental Health Sciences. The current levels of seven PAEs [dimethyl phthalate (DMP), diethyl phthalate (DEP), diisobutyl phthalate (DiBP), dibutyl phthalate (DBP), butyl benzyl phthalate (BBP), isobutyl cyclohexyl phthalate (iBcEP) and diethylhexyl phthalate (DEHP)] have been identified as posing “minimal” concern for causing reproductive effects.4–9 It is recognized that high levels of DBP may adversely affect human reproduction or development and that high levels of exposure to DEHP may affect the development of the male reproductive system.10–15 The European Union, USA and several other countries have begun to regulate exposure to PAEs and the maximum allowable limit for any PAE in China and Taiwan is 1 ppm.16

Food may be contaminated with PAEs through migration from packaging materials, via environmental sources, or during processing. Alcoholic drinks in plastic containers are a particular risk because PAEs are soluble in ethanol and can be leached into the alcoholic beverages from the plastic containers. It has been reported previously how the risk of contamination increases in drinks with a high ethanol content.17 However, there is no accepted concentration of PAEs in wine and spirits. At present, EU Regulation 10/2011 of 14 January 2011 is applicable and it is necessary to monitor the presence of these seven PAEs, in particular those listed as the most toxic (BBP, DBP and DEHP), in wines, spirits and soft drinks.

Although there have been numerous studies on the determination of PAEs in water, there are few reported studies relating to the determination of PAEs in alcoholic beverages such as wine.17–21 There is very little published data on the determination of PAEs in soft drinks (defined as beverages containing water – often, but not always, carbonated water – and, usually, a sweetener and a flavoring agent, with an alcohol content <0.5% of the total volume22) and in light alcoholic drinks (defined as beverages with an alcohol content <6% ABV). These data mainly relate to the study of the migration of PAEs from the plastic container into soft drinks and mineral waters.23–25

Different pretreatment methods have been reported for different matrices. Pretreatment of samples usually involves extraction [e.g., liquid–liquid extraction, solid-phase extraction (SPE), solid-phase microextraction (SPME), liquid-phase microextraction,26–37 ultrasonication, centrifugation or filtration] of the target components prior to analysis.1,17 A dispersive liquid–liquid microextraction (DLLME) method has also been reported.38,39 This method is based on the addition of an immiscible liquid and a higher density solvent (usually a chlorinated solvent) to aqueous samples. The dispersive solvent increases the contact between the two immiscible solvents, forming an interface that is crucial in the extraction process. This method has been slightly modified by using ultrasound assisted emulsification or vortex assisted emulsification.40–42 This method results in a reduction of the volume of organic solvent required for extraction and a simultaneous improvement in the extraction efficiency which is obtained without a dispersive solvent.

In this paper an analytical method for the determination of PAEs in soft drinks and light alcoholic beverages (<6% ABV) based on ultrasound/vortex assisted dispersive liquid–liquid microextraction (USVADLLME) is reported and this method is compared with that of SPE. Parameters such as the extraction solvent, homogenization and shaking or ultrasonication were investigated to optimize the determination of PAEs. Microwave assisted extraction was applied before determination by gas chromatography-mass spectrometry (GC-MS). The method was applied to the determination of PAEs in real samples (soda, cola, bitter, tonic, beer and a whisky and cola mix). The method is sensitive, rapid, accurate and covers a wide linear range. It therefore meets the current need for a method for the determination of trace amounts of PAEs in different types of beverage.

2. Materials and methods

2.1. Materials

Standards of DMP [C10H10O4; selected ion monitoring (SIM) 163; molecular weight (MW) 194], DEP (C12H14O4; SIM 149–177; MW 222), di-isobutyl phthalate (DiBP; C16H22O4; SIM 149–205; MW 278), DBP (C16H22O4; SIM 149–205; MW 278), butyl cyclohexyl phthalate (BcEP; C18H24O4; SIM 149–223; MW 304), benzyl butyl phthalate (BBP; C19H20O4; SIM 149–206; MW 312) and DEHP (C24H38O4; SIM 149–167; MW 390) were purchased from Sigma-Aldrich (Milan, Italy). Anthracene (C14H10; SIM 178; MW 178) was used as an internal standard, and was obtained from LabService Analytica (Anzola Emilia, Bologna, Italy). Ethanol, dichloromethane (CH2Cl2), chloroform (CHCl3), tetrachloroethylene (C2H2Cl4) and carbon tetrachloride (CCl4) were of pesticide grade (Carlo Erba, Milan, Italy) and the sodium chloride (NaCl; Carlo Erba) used was of analytical reagent grade. Absolute ethanol was used and acetone, n-hexane, CH2Cl2 and carbon disulfide were distilled before use.

Cross-contamination from chemicals, materials and laboratory equipment is an important consideration in the determination of PAEs. To avoid contamination, the cleaning procedure for all the laboratory equipment was strictly controlled. All glassware used in the study was soaked and washed in acetone, then dried at 140 °C for at least 4 h. All the reagents and glassware were checked for potential PAE contamination by analysis with GC-ion trap (IT)-MS. Particular attention was given to NaCl to minimize the background contamination associated with this reagent. NaCl was first heated for 4 h at 140 °C in a shallow tray and, after cooling, was kept in a tightly sealed glass vial.

Standard PAE solutions (concentration of 0.1 mg mL−1) were prepared by dissolving the compounds in absolute ethanol. This solution was further diluted with ethanol to prepare a final solution for spiking both the hydroalcoholic solutions and the real samples.

2.2. USVADLLME procedure

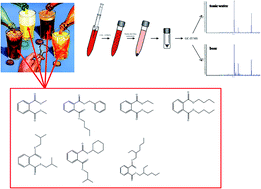
A 10 mL aliquot of each sample (standard solution or real/spiked beverage sample) was transferred into a 10 mL screw cap glass tube with a conical bottom. A mixture of 10 g L−1 NaCl, anthracene (10 μg mL−1 as the internal standard) and 40 μL of CH2Cl2 (as the extraction solvent) was added. The CH2Cl2 solvent should be freshly prepared every day otherwise the interphase between the two solutions becomes cloudy because of the presence of NaCl. The dispersive solvent was unnecessary for the light alcoholic drinks, but was essential for the determination of PAEs in the soft drinks. For the soft drinks, 400 μL of methanol as a dispersive solvent were added to the extraction solvent (1[thin space (1/6-em)]:[thin space (1/6-em)]10 ratio between the extraction solvent and the dispersive solvent). The whole solution was vortex mixed for 20 s and was then placed in an ultrasonic bath for 10 min. The CH2Cl2 layer was sedimented out and was withdrawn using a microsyringe. No centrifugation was necessary to separate the phases as a result of the low alcohol content of the sample solutions. The volume (1–2 μL) collected in a vial was sufficient to determine the PAEs using GC-IT-MS. Fig. 1 shows the different steps in the UVADLLME procedure.
image file: c4ra08574d-f1.tif
Fig. 1 Schematic diagram of the UVADLLME procedure. 1 = sample addition, 10 mL; 2 = addition of internal standard (IS) and extractant solvent; 3 = vortex and ultrasonication operations; 4 = collection of the PAEs extracted into a vial; and 5 = GC-IT-MS analysis.

2.3. GC analysis and quantification

The GC-IT-MS system used for analysis was a Trace gas chromatograph coupled with a PolarisQ mass spectrometer (Thermo Finnigan, Bremen, Germany). Data acquisition and analysis were performed using standard software supplied by the manufacturer (Xcalibur 1.4.1). A fused-silica capillary column with a chemically bonded phase prepared in our laboratory20,43,44 was used (SE-54, 5% phenyl–95% dimethylpolysiloxane column, 30 m × 250 μm id; theoretical plate number, N, 120[thin space (1/6-em)]000 for n-dodecane at 90 °C; capacity factor, K′, 7.3; film thickness, df, 0.25 μm; optimum linear velocity of carrier gas, hydrogen, uopt, 34.5 cm s−1; utilization of theoretical efficiency, 95%). The fused-silica capillary column used was very similar to commercial columns, and it showed very good chromatographic efficiency and was economical to use. A 1–2 μL sample was injected into the programmable temperature vaporization injector in the splitless mode. Thirty seconds after injection the vaporizer was heated from 110 to 310 °C at 800 °C min−1 and cooled after 300 s; the splitter valve was opened after 120 s. The temperature of the GC-IT-MS transfer line was 270 °C and the temperature of the ion source was 250 °C. Helium (IP 5.5) was used as the carrier gas at a flow rate of 1.0 mL min−1. The oven temperature program was as follows: 100 °C, held for 1 min, 10 °C min−1 up to 300 °C, held for 5 min. The IT-MS was operated in the electron ionization mode (70 eV) and the analytes were qualitatively identified in full-scan mode (m/z 45–300) and quantified in the SIM mode. Gas tight syringes of different volumes (Hamilton, NV, USA) were used to measure the volumes of the organic extraction solvents and for the USVADLLME procedure.

The PAE concentrations were obtained from calibration graphs of the ratio Area(PAE)/Area(IS,anthracene) plotted against each PAE concentration (pg μL−1). All the samples were determined in triplicate.

3. Results and discussion

The large amount of diffusion of PAEs from packaging materials into light alcoholic beverages or soft drinks and the health implications of this contamination means that it is important to develop methods for determining the concentrations of PAEs in beverages. The mixed PAE solutions in either a blank solution or an ethanol solution (5% v/v) allowed the simultaneous analysis of beverages ranging from soft drinks to drinks with a low alcohol content (maximum 6% ABV).

From an analytical point of view, the determination of PAEs is not trivial, one of the most important issues is the potential contamination of laboratory glassware. This was extensively studied in previously published work20 and the same considerations have been adopted in this study. Appropriate cleaning of glassware and the distillation of reagents avoided artifacts from PAE contamination in the laboratory.

3.1. Optimization of the USVADLLME procedure

The USVADLLME procedure was optimized using a blank solution and an ethanol solution (5% v/v) spiked with 40 pg μL−1 of PAE. These two solutions allowed us to simulate beverages ranging from soft drinks to those with a low alcohol content (maximum 6% ABV).

As reported previously,21 the use of the dispersive solvent was investigated first. The dispersive solvent plays an important part as a result of its effect at the interphase between the two solvents: it is the connection between the two immiscible phases. The dispersive solvent should, therefore, be miscible in both the sample and the extractive solvent and the extraction process is facilitated by its addition. Experiments were also performed in light alcoholic and soft drinks. In these cases the situation is very different. For light alcoholic drinks (3–40% ABV), a dispersive solvent is unnecessary. Two effects contribute: the co-surfactant effect resulting from the alcohol content and the effect of ultrasonic mixing, which adds sufficient energy to obtain the finely dispersed phase required to quantitatively extract the solute. In this way, vortex mixing is fundamental in dispersing the extracting solvent, if vortex mixing is not used, the dispersive solvent does not form a finely dispersed system, but instead forms a biphasic system in which the phase with the higher density is an emulsion. For soft drinks, however, the dispersive solvent is necessary as a result of the absence of alcohol. Ethanol (4% v/v) was used as the dispersive solvent in these cases.

The preliminary evaluation of the methodology was performed using matrices as close as possible to real samples. The blank solution and the standard ethanolic (5% ABV) solution represent soft drinks and light alcoholic beverages, respectively. The addition of NaCl (10 g L−1) to each solution gives a better representation of the matrix investigated.

The analytical methodology was evaluated through the enrichment factor (EF) and the extraction recovery (ER) for each PAE investigated. The EF is defined37 as the ratio between the concentration of the analyte in the sedimented phase (Csed) and the initial concentration of the analyte (C0) in the sample: EF = Csed/C0. The ER is defined45 as the percentage of the total analyte (n0) extracted into the sedimented phase (nsed), i.e., ER = nsed/n0 × 100 = Csed × Vsed/C0/Vaq × 100, where Vsed and Vaq are the volume of the sedimented phase and the sample solution, respectively. These two parameters are directly influenced by various analytical parameters that were investigated to optimize the extraction conditions.

3.2. Evaluation of the analytical parameters

All the experiments were performed at a constant ionic strength by adding 10 g L−1 NaCl. This addition is important because as NaCl is water-soluble, it modifies the ionic strength of the solution and consequently the solubility of the PAEs decreases (the salting out effect).46 The effect of different concentrations of NaCl was previously tested21 in alcoholic solutions (10–40% ABV) and the PAE recoveries were constant at concentrations >10 g L−1, whereas they decreased at concentrations <10 g L−1. In this case, the effect is the opposite as a result of the very low alcoholic concentrations considered (down to no alcohol in the soft drinks).

The evaluation of the analytical procedure began with a study of the solvent used for the PAE extraction. The discriminating factors considered in choosing the best extraction solvent were the density (higher than that of water), the solubility (lower than in water), a high extraction efficiency and good GC behavior.37 Table 1 shows the recoveries obtained using carbon CCl4, CHCl3, CH2Cl2 and C2H4Cl4 in spiked hydroalcoholic (5% ABV) solutions with 40 pg μL−1 of each PAE.

Table 1 Effect of different solvents on the recovery of phthalatesa
PAE Recovery (%)
CCl4 CHCl3 CH2Cl2 C2H2Cl4
a Data are presented as mean ± standard deviation values.
DMP 20 ± 3 72 ± 2 95 ± 2 73 ± 2
DEP 34 ± 2 77 ± 3 98 ± 1 70 ± 3
DiBP 49 ± 4 81 ± 2 99 ± 2 77 ± 4
DBP 52 ± 3 85 ± 4 99 ± 2 81 ± 1
BcEP 48 ± 4 82 ± 3 96 ± 1 73 ± 1
BBP 59 ± 3 91 ± 2 98 ± 3 79 ± 2
DEHP 47 ± 5 75 ± 2 101 ± 2 74 ± 4


Another fundamental parameter is the effect of the volume of extraction solvent on the recovery of the PAEs. For a good performance, the volume should be as low as possible and this also avoids dilution problems in the GC analysis. The extraction volume simultaneously affects the volume of the sedimented phase and the EFs, in these cases the correlation is inversely proportional. Different extraction volumes of CH2Cl2 (10, 20, 50, 80 and 100 μL) were tested to determine the best extraction conditions. Fig. 2 shows how the EF of each PAE varies with the volume of CH2Cl2 used. Fig. 2a shows the EFs in soft drinks spiked with PAE solutions and Fig. 2b shows the EFs in light alcoholic beverages (beer, 4% ABV) spiked with PAE solutions. As expected, the EFs increase with increasing volume of CH2Cl2. In this case, the matrix is insignificant. Compared with previously reported results,21 the volume required to extract the PAEs is very small as a result of the low levels or absence of alcohol. For the soft drinks, the volume required is 40 μL, whereas for the light alcoholic beverages the volume required is 60 μL. Based on these considerations, the same minimum volume (40 μL) was used for the light alcoholic drinks. This use of a smaller volume compensates for the loss of accuracy and sensitivity. In this way it is possible to use a single analytical procedure to analyze beverages with alcohol contents ranging from 0% to 5% ABV.


image file: c4ra08574d-f2.tif
Fig. 2 Effect of volume of CH2Cl2 on the EFs of the USVADLLME method in (a) soft drinks (0% ABV) and (b) light alcoholic beverages (4% ABV) spiked with PAE solution.

The vortex and ultrasonic mixing times were also investigated as these parameters also influence the recovery of the PAEs. Fig. 3a shows the effect of vortex times of 0, 10, 20 and 40 s on the recovery of PAEs and Fig. 3b shows the effect of ultrasonic mixing times of 0, 1, 5, 10 and 15 min. Both experiments were performed on beverages (0 and 5% ABV) spiked with PAEs. The maximum recoveries (ranging between 90% and 100%) were obtained with 20 s of vortex mixing, whereas 10 min of ultrasonic mixing was sufficient to obtain high recoveries (ranging between 92% and 99%). In both cases, no particular advantage was achieved by using longer time periods.


image file: c4ra08574d-f3.tif
Fig. 3 Effect of different (a) vortex times and (b) ultrasonication times on the analytical evaluation of the USVADLLME procedure for soft drinks (0% ABV) spiked with 40 pg μL−1 of each PAE.

3.3. GC-IT-MS validation

An important issue in the determination of PAEs is contamination from chemicals, materials and laboratory equipment. In addition, this method involves the use of a USVADLLME procedure and a laboratory made SE-54 fused-silica column instead of a commercial column. It is essential to double-check all the equipment and the chemicals used during the whole procedure to avoid possible contamination. Therefore, absolute ethanol was used, and CH2Cl2, CHCl3, C2H2Cl4 and CCl4 were distilled before use, and the cleaning procedures for laboratory equipment were strictly controlled.

Our entire procedure was tested on a soft drink with added NaCl (10 g L−1) and an internal standard before and after spiking with a standard solution of 40 pg μL−1 PAE. The solutions were processed separately using the USVADLLME procedure and GC-IT-MS analysis. Fig. 4a shows the chromatogram obtained before spiking the soft drink. After application of the entire methodology, only the internal standard (anthracene) peak is detected. Fig. 4b shows the same beverage after spiking with a standard solution of PAE. The peaks are well separated and resolved and there is no evidence of contamination.


image file: c4ra08574d-f4.tif
Fig. 4 GC-IT-MS chromatograms of (a) a soft drink sample (0% ABV) with no PAE added and (b) a spiked soft drink sample (40 pg μL−1 of each PAE) (NaCl 10 g L−1). For experimental conditions, see text. Peaks: 1 = DMP; 2 = DEP; 3 = soft drink sample internal standard (anthracene); 4 = iBP; 5 = DBP; 6 = iBcEP; 7 = BBP; and 8 = DEHP.

Table 2 gives the correlation coefficients (R2) calculated in the range 0.5–50 pg μL−1, the limits of detection (LODs), limits of quantification (LOQs) and the inter-day and intra-day repeatability of each of the compounds determined by GC-IT-MS (in SIM mode). The linearity ranges for all the PAEs (using five points at 0.5, 2, 10, 20 and 50 pg μL−1) are >0.923. The LODs and LOQs of each PAE are good and allow the determination of compounds in non-alcoholic or light alcoholic drinks. The LODs range from 0.03 to 0.10 pg μL−1 with a relative standard deviation (RSD) ≤5.1% and the LOQs range between 0.11 and 0.28 pg μL−1 with an RSD ≤7.2%. These values were determined according to the Knoll's definition,47 i.e., an analyte concentration that produces a chromatographic peak equal to three times (LOD) and ten times (LOQ) the standard deviation of the baseline noise. Table 2 also gives the EFs of each PAE in both soft drinks and light alcoholic drinks fortified with 40 pg μL−1 of each PAE and the recoveries (%) with the relative RSD of each PAE. The EFs range between 205 and 315 for soft drinks with PAE recoveries between 94.2% and 99.6% (RSD < 4.2) whereas for the light alcoholic beverages the EFs vary between 172 and 285 with PAE recoveries between 95.6% and 99.4% (RSD < 6.1).

Table 2 Validation of GC-IT-MS procedure
PAE R2 LOD (pg μL−1) LOQ (pg μL−1) Intra-day repeatability (RSD) Inter-day repeatability (RSD) EFa Recovery (%)a
a b a b
a a = soft drink, 0% ABV; b = light alcoholic drink, beer, 4% ABV. Correlation coefficients (R2) calculated in the range 0.5–50 pg μL−1; LODs, LOQs, inter-day and intra-day repeatability, and recovery (%) for each PAE determined by GC-IT-MS in two soft drink samples containing 10 g L−1 NaCl and fortified with PAE standard solution (40 pg μL−1 of each compound). RSD values are given in parentheses.
DMP 0.9235 0.03 (3.5) 0.11 (5.8) 3.7 5.9 290 172 98.2 (1.3) 97.9 (3.5)
DEP 0.9274 0.05 (2.9) 0.14 (5.7) 2.9 6.3 315 285 99.6 (2.5) 98.6 (5.1)
DiBP 0.9695 0.04 (3.1) 0.16 (6.1) 3.2 5.8 232 221 98.2 (2.8) 97.2 (4.7)
DBP 0.9801 0.04 (5.1) 0.18 (7.2) 3.6 5.5 224 194 98.7 (3.1) 96.7 (4.9)
BcEP 0.9775 0.08 (3.9) 0.23 (4.1) 4.2 7.6 205 184 96.9 (2.6) 98.3 (6.1)
BBP 0.9689 0.10 (5.1) 0.28 (6.2) 5.1 7.3 224 199 97.3 (4.2) 99.4 (5.2)
DEHP 0.9959 0.09 (4.4) 0.21 (6.9) 3.9 6.4 249 189 94.2 (2.9) 95.6 (5.6)


To obtain better evidence of the advantages of this analytical procedure, the results of this method was compared with those obtained from SPE (using XAD-2) followed by GC-IT-MS, another routine method used for the determination of PAEs. The SPE-GC-IT-MS method, primarily developed for alcoholic drinks,20,48 was also applied to the determination of PAEs in soft drinks and the results are given in Table 3 together with literature values. It should be noted that the previously published methods were developed to determine PAEs in different matrices (e.g., cosmetics, cigarette packets, drinking water, river water, food packaging bags, steamed breads, plastic food packaging, wine and canned food),19,49–56 whereas no method has yet been reported for the determination of PAEs in soft drinks, apart from the determination of only DBP and DEHP by micro-emulsion electrokinetic chromatography.57 The comparison in Table 3 was performed by considering all the PAEs and some different matrices and drinking water was the nearest matrix to those analyzed in this study. The good analytical parameters obtained using this procedure demonstrate the strength of the USVADLLME-GC-IT-MS method.

Table 3 Comparison of the proposed procedure with previously published analytical methods
Analytical method Matrix Linear range (pg μL−1) LOD (pg μL−1) Recovery (%) Ref.
a mg kg−1. HS-SPME: Headspace solid-phase microextraction; FID: Flame ionization detection; SBSE-LD/LVI: Stir bar absorptive extraction-liquid desorption/large volume injection; TDS: Thermodesorption; MECC: Micellar electrokinetic capillary chromatography; HPLC: High-performance liquid chromatography: DAD: Diode array detection.
USVADLLME-GC/IT-MS Soft/light alcoholic drinks 0.05–50 0.03–0.10 94.2–99.6 This study
SPE-GC/IT-MS Soft/light alcoholic drinks 1–800 0.2–20 95–100 18, 20 and 48
HS-SPME-GC-MS Wine 0.05–10 0.2–1.1   19
SPME-GC-MS Canned food 100–500 0.01a 85–130 55
SPME-GC-MS River water 0.05–300 0.003–0.24   49
SDME-GC-FID Plastic food packaging 100 to 105 10 97–113.9 56
SBSE-LD/LVI-GC-MS Drinking water 1.2–150 0.30–0.60   50
TDS-GC-MS Cigarette package mat   280–290 80–90 51
MECC Food packaging bags 1000–300[thin space (1/6-em)]000 130–380 81.8–118.8 54
HPLC-UV spectroscopy Steamed breads   702–1920 82.7–107.6 53
HPLC-DAD Cosmetics 104 to 106 100–1000 98.6–108.0 51


3.4. Analysis of real samples

This analytical procedure was applied to 11 different commercial beverages: four light alcoholic drinks (6% ABV) and seven soft drinks, all packed in polyethylene terephthalate bottles or aluminum cans. Our main interest was the determination of PAEs in the beverages, it was beyond the scope of this work to determine PAEs in the packaging materials or the route of contamination. Fig. 5 shows chromatograms (in SIM mode) of some of the real samples investigated in this study: Dutch beer (5% ABV), Sprite and tonic water. The determinations were carried out using the USVADLLME-GC-IT-MS method developed in this work and the results obtained were compared with the results obtained for the same samples by SPE-GC-IT-MS and the results are reported in Table 4. The agreement between the two methods is good, the difference between the values obtained from the two analytical methods is <5%, which shows the advantages of this new procedure in terms of ease of use, time and cost of analysis and efficiency/accuracy. DEP, DBP and DEHP were present in all the beverages analyzed, but DMP and BcEP were only present in two beverages (Dutch beer and Italian beer).
image file: c4ra08574d-f5.tif
Fig. 5 GC-IT-MS chromatograms of (a) Dutch beer (5% ABV), (b) Sprite and (c) tonic soft drinks. For experimental conditions, see text. Peaks: 1 = DMP; 2 = DEP; 3 = internal standard (anthracene); 4 = iBP; 5 = DBP; 6 = iBcEP; 7 = BBP; and 8 = DEHP.
Table 4 Concentrations of phthalates (pg μL−1) in different light alcoholic drinks and soft drinks available in Italy. The values in parentheses are the results obtained by analyzing the same samples using SPE-GC-IT-MSa
  A (5% ABV) B (5% ABV) C (4% ABV) D (6% ABV) E F G H I L M
a A = Italian beer; B = Dutch beer; C = German beer; D = Whisky and Coka (Italian light alcoholic beverage); E, F, G = Tonic, Coke, Bitter (Italian soft drinks, same brand); H, I, L = Coke, Sprite, Tonic (Italian soft drinks, same brand); and M = tonic, European soft drink).
DMP — (−) 1.89 (1.89) — (−) — (−) — (−) — (−) — (−) — (−) — (−) — (−) — (−)
DEP 1.05 (0.99) 0.17 (0.16) 0.33 (0.37) 0.39 (0.36) 0.43 (0.43) 0.27 (0.24) 0.14 (0.10) 0.22 (0.23) 0.39 (0.37) 0.15 (0.14) 0.22 (0.21)
DiBP 0.24 (0.25) 0.67 (0.63) 2.38 (2.45) — (−) 0.72 (0.69) 1.31 (1.35) 0.95 (0.92) — (−) 0.77 (0.73) 0.16 (0.14) — (−)
DBP 2.67 (2.58) 4.22 (4.36) 3.65 (3.59) 2.31 (2.30) 3.50 (3.48) 1.99 (1.93) 3.62 (3.57) 4.87 (4.83) 5.70 (5.66) 4.97 (5.06) 2.98 (3.02)
BcEP 0.23 (0.08) — (−) — (−) — (−) — (−) — (−) — (−) — (−) — (−) — (−) — (−)
BBP 0.85 (0.81) — (−) — (−) 0.28 (0.09) 0.31 (0.30) 0.28 (0.08) 0.28 (0.16) 0.28 (0.05) 0.28 (0.07) 0.28 (0.07) 0.28 (0.18)
DEHP 5.15 (5.07) 4.85 (4.71) 3.50 (3.60) 1.18 (1.23) 99.9 (101.5) 6.89 (6.91) 30.11 (29.9) 2.73 (2.70) 4.92 (4.89) 11.5 (11.7) 20.9 (20.5)


4. Conclusion

The consumption of soft drinks is popular among young people, with consequences ranging from behavioral disorders to obesity and the intake of pollutants such as PAEs. In this paper, a valuable and reliable analytical methodology is reported for the determination of these compounds in soft drinks and light alcoholic drinks. The USVADLLME-GC-IT-MS method has very good LOQs (0.11–0.28 pg μL−1) with recoveries between 94.2% and 99.6% for soft drinks and 95.6% and 99.4% for light alcoholic drinks. The method was compared with a method based on SPE using XAD-2 as an adsorbent and with other previously published methods. The analytical parameters obtained (linearity range, LODs and recoveries) are very good and allow the determination of PAEs in different matrices. The entire methodology was applied to 11 real samples (four light alcoholic drinks and seven soft drinks). Five PAEs (DEP, DiBP, DBP, BBP and DEHP) were present in almost all the beverages, whereas DMP and BcEP were present only in two samples. Comparison of the results obtained for the same samples with a well-investigated method (SPE-GC-IT-MS) gave good results, illustrating the applicability of this USVADLLME–GC–IT-MS method in these matrices.

References

  1. D.-P. Xu, S. Li, Y.-H. Chen, H.-B. Li, A.-N. Li and X.-R. Xu, Int. J. Mod. Biol. Med., 2013, 4, 12 Search PubMed.
  2. U.S. Environmental Protection Agency, Phthalates Action Plan, 2012, http://www.epa.gov/oppt/existingchemicals/pubs/actionplans/phthalates_actionplan_revised_2012-03-14.pdf, accessed June 2014.
  3. F. Nakane, M. Kunieda, S. Shimizu, Y. Kobayashi, H. Akane, Y. Akie, A. Saito, M. Noguchi, T. Kadota and K. Mitsumori, J. Toxicol. Sci., 2012, 37, 527 CrossRef CAS.
  4. C. A. Harris, P. Henttu, M. G. Parker and J. P. Sumpter, Environ. Health Perspect., 1997, 105, 802 CrossRef CAS.
  5. A. P. van Wezel, P. Van Vlaardingen, R. Posthumus, G. H. Crommentuijn and D. T. H. M. Sijm, Ecotoxicol. Environ. Saf., 2000, 46, 305 CrossRef CAS PubMed.
  6. D. Gunnarsson, P. Leffler, E. Ekwurtzel, G. Martinsson, K. Liu and G. Selstam, Reproduction, 2008, 135, 693 CrossRef CAS PubMed.
  7. K. L. Howdeshell, J. Furr, C. R. Lambright, C. V. Rider, V. S. Wilson and L. E. Gray Jr, Toxicol. Sci., 2007, 99, 190 CrossRef CAS PubMed.
  8. K. L. Howdeshell, C. V. Rider, V. S. Wilson and L. E. Gray Jr, Environ. Res., 2008, 108, 168 CrossRef CAS PubMed.
  9. K. L. Howdeshell, V. S. Wilson, J. Furr, C. R. Lambright, C. V. Rider, C. R. Blystone, A. K. Hotchkiss and L. E. Gray Jr, Toxicol. Sci., 2008, 105, 153 CrossRef CAS PubMed.
  10. L. E. Gray, J. Ostby, J. Furr, D. N. R. Veeramachaneni and L. Parks, Toxicol. Sci., 2000, 58, 350 CrossRef CAS PubMed.
  11. P. M. D. Foster, R. C. Cattley and E. Mylchreest, Food Chem. Toxicol., 2000, 38, S97 CrossRef CAS.
  12. S. M. Duty, N. P. Singh, M. J. Silva, D. B. Barr, J. W. Brock, L. Ryan, R. F. Herrick, D. C. Christiani and R. Hauser, Environ. Health Perspect., 2003, 111, 1164 CrossRef CAS.
  13. A. K. Hotchkiss, L. G. Parks-Saldutti, J. S. Ostby, C. Lambright, J. Furr, J. G. Vandenbergh and L. E. Gray Jr, Biol. Reprod., 2004, 71, 1852 CrossRef CAS PubMed.
  14. L. E. Gray Jr, V. S. Wilson, T. Stoker, C. Lambright, J. Furr, N. Noriega, K. Howdeshell, G. T. Ankley and L. Guillette, Int. J. Androl., 2006, 29, 96 CrossRef PubMed.
  15. M. A. Kamrin, J. Toxicol. Environ. Health, Part B, 2009, 12, 157 CAS.
  16. J. Chan, Application note Food Safety, Agilent Technologies, 2012, accessed September 2014, http://www.chem.agilent.com/Library/applications/5990-9510EN.pdf Search PubMed.
  17. G. Cinelli, P. Avino, I. Notardonato, A. Centola and M. V. Russo, Food Chem., 2014, 146, 181 CrossRef CAS PubMed.
  18. EU Commission, Determination of bis-(2-ethylhexyl)phthalate (DEHP) in sports drinks by isotopic dilution headspace solid-phase micro extraction gas chromatography mass spectrometry (HS-SPME-GC-MS), 2011, Technical notes, http://www.jrc.ec.europa.eu/.
  19. J. D. Carrillo, C. Salazar, C. Moreta and M. T. Tena, J. Chromatogr. A, 2007, 1164, 248 CrossRef CAS PubMed.
  20. M. V. Russo, I. Notardonato, G. Cinelli and P. Avino, Anal. Bioanal. Chem., 2012, 402, 1373 CrossRef CAS PubMed.
  21. G. Cinelli, P. Avino, I. Notardonato, A. Centola and M. V. Russo, Anal. Chim. Acta, 2013, 769, 2 CrossRef PubMed.
  22. U.S. Government, Electronic code of Federal Regulations. Section # 7.71, paragraphs (e) and (f), http://www.ecfr.gov/, revised May 2, 2013.
  23. J. Bošnir, D. Puntarić, A. Galić, I. Skes, T. Dijani, M. Klarić, M. Grgić, M. Čurković and Z. Šmit, Food Technol. Biotechnol., 2007, 45, 91 Search PubMed.
  24. A. V. Rathore, G. D. Acharya and M. V. Hathi, Pollut. Res., 2010, 29, 53 CAS.
  25. M. V. Russo, Chromatographia, 2005, 62, 331 CAS.
  26. J. Zhu, S. P. Phillips, Y.-L. Feng and X. Yang, Environ. Sci. Technol., 2006, 40, 5276 CrossRef CAS.
  27. Y. Cai, Y. Shi, J. Liu, S. Mou and Y. Lu, Microchim. Acta, 2007, 157, 73 CrossRef CAS.
  28. S. Jara, C. Lysebo, T. Greibrokk and E. Lundanes, Anal. Chim. Acta, 2000, 407, 165 CrossRef CAS.
  29. N. Casajuana and S. Lacorte, Chromatographia, 2003, 57, 649 CAS.
  30. K. Kato, S. Shoda, M. Takahashi, N. Doi, Y. Yoshimura and H. Nakazawa, J. Chromatogr. B: Anal. Technol. Biomed. Life Sci., 2003, 788, 407 CrossRef CAS.
  31. M. V. Russo, Chromatographia, 2000, 52, 93 CAS.
  32. M. F. Alpendurada, J. Chromatogr. A, 2000, 889, 3 CrossRef CAS.
  33. A. Penalver, E. Pocurull, F. Borrull and R. M. Marce, TrAC, Trends Anal. Chem., 1999, 18, 557 CrossRef CAS.
  34. M. V. Russo, A. De Leonardis and V. Macciola, J. Food Comp. Anal., 2005, 18, 617 CrossRef CAS PubMed.
  35. M. Polo, M. Llompart, C. Garcia-Jares and R. Cela, J. Chromatogr. A, 2005, 1072, 63 CrossRef CAS PubMed.
  36. E. Psillakis and N. Kalogerakis, TrAC, Trends Anal. Chem., 2003, 22, 565 CrossRef CAS.
  37. K. E. Rasmussen and S. Pedersen-Bjergaard, TrAC, Trends Anal. Chem., 2004, 23, 1 CrossRef CAS.
  38. M. Rezaee, Y. Assadi, M. R. M. Hosseini, E. Aghaee, F. Ahmadi and S. Berijani, J. Chromatogr. A, 2006, 1116, 1 CrossRef CAS PubMed.
  39. A. Zgola-Grzéskowiak and T. Zgola-Grzéskowiak, TrAC, Trends Anal. Chem., 2011, 30, 1382 CrossRef PubMed.
  40. H. Yan, X. Cheng and B. Liu, J. Chromatogr. B: Anal. Technol. Biomed. Life Sci., 2011, 879, 2507 CrossRef CAS PubMed.
  41. X.-Z. Hu, J.-H. Wu and Y.-Q. Feng, J. Chromatogr. A, 2010, 1217, 7010 CrossRef CAS PubMed.
  42. S.-Y. Wei, M.-I. Leong, Y. Li and S.-D. Huang, J. Chromatogr. A, 2011, 1218, 9142 CrossRef CAS PubMed.
  43. G. P. Cartoni, G. Goretti, B. Neri and M. V. Russo, J. Chromatogr., 1989, 475, 145 CrossRef CAS.
  44. M. V. Russo, G. Goretti and A. Soriero, Ann. Chim., 1996, 86, 115 CAS.
  45. S. Sathyanarayana, C. J. Karr, P. Lozano, E. Brown, A. M. Calafat, F. Liu and S. H. Swan, Pediatrics, 2008, 121, 260 CrossRef PubMed.
  46. M. V. Russo, G. Goretti and A. Liberti, Chromatographia, 1993, 35, 290 CAS.
  47. J. K. Knoll, J. Chromatogr. Sci., 1985, 23, 422 CAS.
  48. M. V. Russo, I. Notardonato, P. Avino and G. Cinelli, Anal. Methods, 2014, 6, 7030 RSC.
  49. X. Li, M. Zhong, S. Xu and C. Sun, J. Chromatogr. A, 2006, 1135, 101 CrossRef CAS PubMed.
  50. P. Serôdio and J. M. F. Nogueira, Water Res., 2006, 40, 2572 CrossRef PubMed.
  51. Y. Hou, Q. E. Cao, X. G. Xie, B. X. Wang, Y. Yang, J. C. Xu, Y. Yang and J. Liu, Chin. J. Spectrosc. Lab., 2006, 23, 1022 CAS.
  52. Y. W. Yang and Y. Zhu, J. Environ. Health, 2006, 23, 360 CAS.
  53. L. X. Wang and M. L. Wang, Chin. J. Anal. Lab., 2007, 26, 13 CAS.
  54. H. Chen, R. Jia, L. Jia, R. H. Zhu and Y. Wang, J. Anal. Sci., 2007, 23, 21 CrossRef.
  55. L. Z. Wang, R. L. Wang, Y. N. Liu, J. C. Zheng, E. H. Fang and Z. G. Zhang, Phys. Test. Chem. Anal., Part B, 2008, 44, 502 CAS.
  56. C. M. Zhang, J. Food Sci. Biotechnol., 2011, 30, 863 CAS.
  57. S.-Y. Hsieh, C.-C. Wang and S.-M. Wu, Food Chem., 2013, 141, 3486 CrossRef CAS PubMed.

This journal is © The Royal Society of Chemistry 2014