Electro-active phase formation in PVDF–BiVO4 flexible nanocomposite films for high energy density storage application

Subrata Sarkar, Samiran Garain, Dipankar Mandal* and K. K. Chattopadhyay*
Department of Physics, Jadavpur University, Kolkata-700032, India. E-mail: dipankar@phys.jdvu.ac.in; kalyan_chattopadhyay@yahoo.com

Received 9th August 2014 , Accepted 22nd September 2014

First published on 22nd September 2014


Abstract

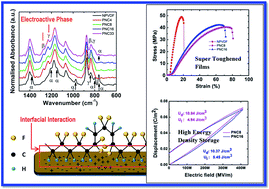
In this work we report on the preparation of polymer nanocomposite (PNC) films, consisting of poly(vinylidene fluoride) and bismuth vanadium oxide nanoparticles (BiVO4-NPs), and its electroactive phase (β- and γ-phase) formation. It was found that BiVO4-NPs can yield up to 98% of the electroactive phases in PVDF. Fourier transform infrared spectroscopy (FTIR) results reveal that electrostatic interactions are present at the interface between surface charges of BiVO4-NPs and –CH2/CF2– molecular dipoles of PVDF favoring and stabilizing the electroactive phases. The electrostatic interaction is further confirmed by X-ray photoelectron spectroscopy (XPS) analysis. Compared to the neat PVDF film, a significantly increased dielectric constant (ε ∼ 44) and a low loss factor (tan[thin space (1/6-em)]δ ∼ 0.02) were observed in the PNC films. In addition, PNC films exhibit a high electrical energy density up to 11 J cm−3 with a breakdown electric field higher than 400 MV m−1. Furthermore, a dramatic improvement of the toughness (460%) was also noticed for the PNC films. These results underline the high potential of such films for their use as flexible high energy density capacitors and flexible piezoelectric based power sources as well.


1. Introduction

Poly(vinylidene fluoride) (PVDF) and its composites with nanoparticles of different materials have been studied for several years because of their excellent ferro-, piezo-, pyro-, and dielectric properties.1–10 These properties of the semi-crystalline PVDF are principally associated with crystalline regions within the material. PVDF exists in at least three main crystalline forms, designated as α-, β-, and γ-phases and at least in one minor phase, designated as the δ-phase. Among all these phases, the α-phase is the most common one and it is an electrically inactive nonpolar phase while the others are electro-active polar phases. Among the electro-active crystalline phases, the β- and γ-phases are more attractive because of their spontaneous polarization giving rise to ferroelectric properties. This ferroelectric PVDF, once electrically poled, is able to transfer mechanical to electrical energy and vice versa (piezoelectric), and thermal to electrical energy (pyroelectric).1,3,6 In addition, the γ-phase exhibits high energy storage properties due to the non-early saturation of polarization under a high electric field.11,12 Therefore, several attempts have been made to achieve both the electroactive β- and γ-phases in PVDF by numerous methods, such as mechanical stretching,13 melt quenching,14 addition of hydrated salts,15 blending with other polymers,16,17 applying electric field,18 spin coating,3,19 electro spinning,20,21 and preparing nanocomposites.2,22–25 Due to their multifunctional properties (i.e., optical, electrical, thermal, mechanical) PVDF-nanocomposites gained special attention over the last few decades.

In particular, tremendous attention has been paid to enrich the dielectric permittivity in PVDF films4–10,26–28 by the incorporation of nanoparticles due to potential applications in energy storage applications. The general research trend indicates that ferroelectric,4,6–8,27 semiconducting,10 insulating6 and in a few cases conducting fillers26,28 are chosen to improve the dielectric property in PVDF. However, it has been found that conducting fillers reduce the electrical breakdown strength significantly and subsequently increase the dielectric losses. Hence, nano-ceramics are the alternative fillers of choice due to their typical non-conducting properties resulting in low dielectric losses.6,7 An other advantage of using this type of fillers is their potential to substantially improve the toughness and the electrical energy density of the composite films, which may have tremendous applications in the field of paper based flexible capacitor fabrication.

In this work, we have chosen a semiconducting nano-material, namely, bismuth vanadate nanoparticles (BiVO4-NPs) as filler material for the preparation of PVDF nanocomposite (PNC) films. It is interesting to note that BiVO4-NPs can preferentially induce the electro-active β- and γ-phases in PVDF. In addition, substantial improvement of dielectric properties (εr = 44 and tan[thin space (1/6-em)]δ = 0.02 at 1 kHz) has been achieved in PNC films. Furthermore, at higher frequency (i.e., 1 MHz) dielectric permittivity of the PNC films is also high (εr = 36 and tan[thin space (1/6-em)]δ = 0.043) with respect to pure PVDF films (εr = 9 and tan[thin space (1/6-em)]δ = 0.104) indicating that the PNC films are suitable for energy storage device in a broad range of frequency domain. In this work, we have also achieved higher energy density (energy discharge: 10.94 J cm−3 and loss: 4.94 J cm−3) in PVDF based PNC film which is one of the best results reported so far in case of polymer nanocomposites.

More reasons behind the choice of BiVO4-NPs in this study29–34 can be found in their potential for versatile applications apart from electronic devices that dealt with the electroactive phases in PVDF, i.e., water splitting,33 O2 evolution30 and organic pollutant removal,34 etc.

2. Experimental section

2.1. Materials

Bismuth oxide (Bi2O3, Finar Reagents: purity >99.9%), vanadium pentaoxide (V2O5, Loba Chemie: purity >99.9%), PVDF (Sigma-Aldrich, USA, Mw: 275[thin space (1/6-em)]000) and N,N-dimethylformamide (DMF, Merck, India).

2.2. Preparation of BiVO4 nanoparticles

BiVO4 powder was prepared by means of a conventional solid state reaction method followed by mechanical ball milling. As starting material, bismuth oxide was mixed and grinded with vanadium pentaoxide in 1[thin space (1/6-em)]:[thin space (1/6-em)]1 molar ratio in a mortar. The stoichiometric mixture was then heated at 800 °C for 8 h to obtain the BiVO4 powder. The BiVO4 powder was further subjected to mechanical ball milling for 10 h to obtain the BiVO4-NPs. The ball and powder weight ratio in the milling process was 6[thin space (1/6-em)]:[thin space (1/6-em)]1. The milling process was carried out in a Fritsch Premium Line Pulverisette ball miller equipped with agate pots and balls, at a speed of 600 rpm in ambient environment.

2.3. Preparation of PNC films

The nanocomposites were prepared by solvent casting techniques from PVDF–DMF solution containing BiVO4-NPs. Different weight fractions (4, 8, 16 and 33 wt%) of BiVO4-NPs with respect to PVDF were used. In prior to casting, the solutions were kept in ultrasonic bath (power 250 watt) for 20 min to get homogeneous mixtures. The PVDF nano-composite films were prepared by spreading the solution on clean glass substrates. Afterwards the films were vacuum dried at 130 °C for 6 h. Finally, the dried films were peeled off from the substrates and named NPVDF, where no BiVO4-NPs were added, PNC4, PNC8, PNC16 and PNC33 according to the BiVO4-NPs loading concentration as given above.

2.4. Characterizations

The morphology of the nanostructures of the synthesized BiVO4-NPs was studied with a field emission scanning electron microscope (FESEM, Hitachi-S4800), while the structures were studied by a high resolution transmission electron microscope (HRTEM, Hitachi-H600) and X-ray diffraction (XRD, Bruker, D8 Advance) using CuKα radiation (λ = 0.15406 nm), operated at 40 kV and 40 mA. The UV-Vis spectrum (Shimadzu, UV-3101PC) was recorded in transmission mode for the determination of the optical band gap. The surface morphology and quality of the polymer PNC films were characterized by FESEM and optical microscope (Lica, DM-750P) images, respectively. The crystalline phase identification was done by X-ray diffraction (XRD) and Fourier transformed infrared spectrometer (FTIR, Jasco FT-IR 300E) operated in attenuated total reflection (ATR) mode to avoid total absorption of incoming IR radiation in transmission mode which often occur in micrometer thick films. The polymer nanocomposite film (PNC8) was analyzed by X-ray photoelectron spectroscopy (XPS) using a monochromatic Al Kα (photon energy ∼ 1486.6 eV) as excitation source with a hemispherical analyzer (SPECS, HAS 3500). Furthermore, neat PVDF (NPVDF) was also employed for comparison. Silver electrodes were printed onto both surfaces of the NPVDF and PNC films for electrical characterizations. The dielectric study was performed with a precision impedance analyzer (Agilent, 4294A) in frequency range of 42 Hz to 5 MHz. All the characterizations have been performed at room temperature. Mechanical properties were evaluated with a universal testing machine (Shimadzu). The DE loop was measured with a Sawyer-Tower circuit. Among the PNC films, PNC8 and PNC16 films were chosen for characterization of mechanical properties and DE loop measurements because of their maximum yield of electro-active phases.

3. Results and discussion

3.1. Characterization of BiVO4 nanoparticles

An X-ray diffraction pattern of the as prepared BiVO4-NPs is shown in Fig. 1a. All the diffraction peaks were indexed to monoclinic BiVO4 (m-BiVO4, JCPDS card no. 75-2480), suggesting the successful single phase synthesis of m-BiVO4. The particle size of the BiVO4-NPs was calculated using Debye–Scherrer equation:
 
image file: c4ra08427f-t1.tif(1)
where ΓFWHM is the full-width-at-half-maximum (FWHM) of the diffraction peaks. The average particle size was found to be 9 nm by considering the three most intense diffraction peaks.

image file: c4ra08427f-f1.tif
Fig. 1 (a) X-ray diffraction patterns of the as prepared BiVO4-NPs. UV-Vis transmittance spectrum is shown in the inset and (b) TEM micrograph of BiVO4 nanoparticles. Particle size distribution curve is shown in the inset.

The average particle size was also calculated from TEM micrographs (Fig. 1b) of the nanoparticles and it comes out to be 7 nm, which matches well with the particle size calculated from aforementioned XRD. The particle size distribution curve of the BiVO4-NPs is shown in the inset of Fig. 1b. The UV-Vis spectrum of the BiVO4-NPs dispersed in DI-water is shown in the inset of Fig. 1a, the steep decrease of the intensity of the transmittance spectrum indicates the optical band gap region. The direct and indirect band gap energies of the BiVO4-NPs are 4.14 and 3.64 eV, respectively, estimated from UV-Vis spectra (ESI, Fig. S1 and S2).

3.2. Identification of crystalline phases of the PNC films by XRD

Fig. 2a shows the X-ray diffraction pattern of NPVDF and PNC films. The two most intense and relatively sharp peaks (‘*’ marked) at 18.6° and 28.8° appeared due to the BiVO4-NP loading within the PVDF matrix. The intensity ratio of these two intense peaks (I18.6/I28.8) of bare BiVO4 (from Fig. 1a) NPs is compared with that of the nanocomposite films as shown in Fig. 2b. It illustrates that I18.6/I28.8 is relatively higher in PNC films, which indicates the interaction of nanoparticles with the PVDF molecules. In other words, the surfaces of the nanoparticles are getting modified. The diffraction peaks at 17.6° (100), 18.2° (202), 19.8° (110) and 26.2° (021) in NPVDF film indicates that the neat PVDF contains predominantly α-crystalline phase. In PNC films, the characteristic diffraction peaks of both PVDF and BiVO4 are illustrated, indicating the presence of BiVO4-NPs within the PVDF matrix. As the nanoparticle content increases, the α-characteristic peaks disappear completely and a new peak of β and γ-crystalline phases appears at 20.2° in the XRD patterns of the PNC films. This phase transformation (α → β and γ) occurs even at the lowest concentration of the BiVO4-NP loading. It should be noted that one of the γ-characteristic peaks (at 2θ ≈ 18.2°) nearly coincides with the second intense diffraction peak of BiVO4-NPs that adversely affects the I18.6/I28.8 intensity ratio (Fig. 2b). The higher intensity ratio of I18.6/I28.8 in PNC4 indicates that it contains relatively larger content of the γ-phase, which is further confirmed by FT-IR results discussed below. The degree of crystallinity (Xc) of the NPVDF and PNC films has been calculated from the XRD data (ESI, Fig. S3) using the method of curve deconvolution (ESI, Table S1). With the addition of BiVO4-NPs, Xc is reducing gradually, for example, the NPVDF film shows 53% of Xc, whereas it reduces to 46% in PNC33 film. The degree of crystallinity (Xc) calculated from XRD data have also been compared with the calculated values from DSC and tabulated in (ESI, Table S2).
image file: c4ra08427f-f2.tif
Fig. 2 (a) X-Ray diffraction pattern of NPVDF and its nanocomposites films. The ‘*’ marked peaks are the signature of BiVO4-NPs. The other signals according to the PVDF matrix are also labeled. (b) Relative intensity of XRD peaks at 2θ = 18.6° and 28.8° of BiVO4 NPs and PNC films (the bar diagram is used for eye guide).

3.3. Estimation of electroactive phase within PNC films by FTIR study

The FTIR spectra of the PNC and neat PVDF films are shown in Fig. 3a. The neat PVDF film exhibits predominantly non-electroactive α-crystalline phase assigned by the characteristic absorption peaks at 976, 796, 763 cm−1 and a small amount of γ-phase is also evident from the 838 cm−1 band.23,35 It is noteworthy to mention that the absorption peak at 763 cm−1 is considered as reference for the quantification of the α-phase content, as due to the even trace amount of α-phase this peak appears.35 With the loading of BiVO4-NPs into PVDF, two new intense peaks at 1276 and 1232 cm−1 appear which are characteristic of electroactive β and γ-phase, respectively.23 In addition, the intensity of 840 cm−1 band gets intensified, which is the dual characteristic of both β- and γ-phases.23–25,35 The α-phase characteristic absorption bands disappeared in PNC films (except in sample PNC33, where trace amount of α-phase exists, indicated from the less intense 763 cm−1 band) revealing the important role of BiVO4-NPs in crystalline phase transformation [α → β and γ] in PVDF films. Therefore, the FTIR results reveal that BiVO4-NP filler can control the crystalline polymorph in PVDF and subsequently improves the electroactive phase content as well. The resultant content of the electroactive phase (FEA) in the nanocomposites film is calculated from,36
 
image file: c4ra08427f-t2.tif(2)
where AEA and ANEA is the absorption intensity at 840 cm−1 and 763 cm−1 respectively. The FEA is plotted as a function of BiVO4-NP loading in PVDF in Fig. 3b. It shows that 8 wt% BiVO4-NP loading yields the higher electroactive phase content (FEA = 0.98) and afterwards it remains almost unchanged. It should be highlighted that even a small amount (8 wt%) of BiVO4 nanoparticles give rise to FEA = 0.98, which is equally impressive in the context of the electroactive phase content.36 The inset of Fig. 3b depicts the changes of α-, β-, and γ-phase contents within the PNC films. The normalized absorption intensities of 763 (α), 1276 (β) and 1232 (γ) cm−1 bands are plotted as a function of BiVO4 wt%. The peak intensity at 1072 cm−1 is selected as a reference band for normalization of FTIR spectra because the intensity of this band is just proportional to the film thickness regardless of the crystalline modifications of PVDF.35 According to this plots, the α-phase content abruptly decreases with the addition of 4 wt% BiVO4 and then slightly increases, whereas the β-phase content is gradually increased up to 8 wt% and then starts decreasing slightly. It also shows the abrupt increase of the γ-phase even for a low weight fraction i.e., 4 wt% of BiVO4-NPs, thereafter the γ-phase content is not changed significantly.

image file: c4ra08427f-f3.tif
Fig. 3 (a) FTIR spectra of NPVDF and PNC4, PNC8, PNC16, PNC33 nanocomposite films in the 600–1500 cm−1 region and (b) variation of electroactive (calculated from eqn (2)) phase in the PNC films with the different wt% loading of BiVO4-NPs. The inset shows the normalized absorption from α (763 cm−1 band), β (1276 cm−1 band), γ (1232 cm−1 band)-crystalline phase as a function of BiVO4 content.

3.4. Morphological study

Fig. 4 shows the FE-SEM images of bare BiVO4-NPs, NPVDF and PNC films. The FESEM image of bare BiVO4-NPs shown in Fig. 4a, exhibits agglomerated nanoparticles as expected in ball milled powder and size/shape of the particles are quite homogeneous, which is consistent with TEM observation, as shown in Fig. 1b. The digital photographic images are shown to compare the transparency of the NPVDF and PNC films at the top-left corner of each FE-SEM image, Fig. 4(b)–(f). They indicate that the transparency of the films is reducing gradually with the loading of BiVO4-NPs. Optical microscopic images of the nanocomposites films are shown at the top-right corner of the FE-SEM images, Fig. 4(b)–(f), indicating that the films are free from any pin hole and crack formation and PNC8 film is much smoother and denser compared to the other composite films. A cross polarized optical image of NPVDF is shown in (ESI, Fig. S4) which indicates that NPVDF film is predominantly α-crystalline. In the other PNC films, the spherulites of γ-phase are not seen clearly, only dark images are observed, which may be due to the fact that the loading of BiVO4-NPs in the PVDF matrix hinders the visibility of the γ-spherulites under the cross polarizer. In the FE-SEM image of NPVDF film (Fig. 4b), only fibril like structures are seen, which is a typical characteristic feature of α-spherulite.3 These features are absent in PNC films, however different surface morphologies (i.e., hollow spheres, leaf like structures, over layer structures) were observed depending on the weight fraction of BiVO4-NPs in PVDF, as it greatly affects the solvent evaporation rate. The PNC4 film (Fig. 4c) shows neither any agglomeration nor any features on the surface, probably due to lower (4 wt%) filler concentration, whereas PNC8 film (Fig. 4d) shows hollow spherical structures over the surface. The hollow spherical structures37 are formed in drying process and subsequent film formation. As we increase the concentration of BiVO4-NPs, the PNC16 film (Fig. 4e) exhibits leaf like structures similar to the observation made by Wang et al.30 This kind of structure may be due to a slower evaporation rate of the solvents, as the concentration of BiVO4-NPs is relatively larger in PNC16 films than PNC8 films. The leaf like morphological structures within the PNC16 film give rise to different types of surface modifications that might directly affect the properties like the dielectric constant of the resulting nanocomposite, as it is related with the surface/interface polarization of the material as well. It has been found that due to higher concentration of BiVO4-NPs (i.e., 33 wt%), the surface of the PNC33 (Fig. 4f) film is covered with over layer type structures.
image file: c4ra08427f-f4.tif
Fig. 4 FESEM images of (a) BiVO4 nanocrystalline powder, (b) NPVDF, (c) PNC4, (d) PNC8, (e) PNC16 and (f) PNC33 nanocomposite films. Optical microscopic images of NPVDF and PNC films are shown at the top-right corner and photographs of each polymer films placed on the Jadavpur university logo (diameter = 12 mm) are shown at the top-left corner of every figure.

3.5. The surface charge and dipole interaction model

In order to study the electroactive phase formation in the PNC films, the FTIR spectra of the films were recorded in the 3100–2900 cm−1 region and are shown in Fig. 5a. This region is mainly attributed to the asymmetric νas (–CH2–) and symmetric νs (–CH2–) stretching vibrational bands which are not coupled with any other vibrational modes. The study of this band is extremely useful to check whether there is any interfacial interaction of the CH2 dipoles with the BiVO4-NPs. The positions of νas (–CH2–) and νs (–CH2–) vibrational bands are shifted toward lower energies ([small nu, Greek, macron]PNC) in the PNC films in comparison to neat PVDF ([small nu, Greek, macron]NPVDF) as indicated by arrows in Fig. 5a, evidencing the interfacial interaction3 between the BiVO4-NPs and PVDF. These shifts are gradually increasing with the increase in concentration of BiVO4-NPs within PVDF up to 16 wt%, afterwards the shift drops down. This phenomenon can be explained by considering the damped harmonic oscillations38 of CH2 dipoles. The electrostatic interactions, between the CH2 dipoles and the charges distributed on the surface of BiVO4-NPs, act as a damping source for the oscillations of CH2 dipoles shifting the related vibrational bands towards lower energy. In this study, we have calculated the damping coefficient based on the shifts at the asymmetric CH2 stretching using the formula
 
rdc = 4πC([small nu, Greek, macron]NPVDF2[small nu, Greek, macron]PNC2)1/2 (3)
where, rdc is the damping co-efficient appearing due to the interfacial interaction between the surface charge of BiVO4-NPs and the CH2 dipoles of PVDF. The variation of rdc with the BiVO4-NPs loading is shown in Fig. 5b. It exhibits that the damping co-efficient is largest in PNC8 film afterwards it starts to reduce slightly and for BiVO4-NPs loadings higher than 16 wt% it decreases more distinctly. This is probably due to the percolation effect of the BiVO4-NPs loading within PVDF matrix. It is noteworthy that the behavior of FEA (shown in Fig. 3b) and rdc as a function of BiVO4-NPs content are similar, indicating the direct relation of the electroactive phase formation in PVDF due to the interfacial interaction of the CH2 dipoles with the surface charges of the BiVO4-NPs. The schematic of semi polar γ-phase formation due to the interaction of the PVDF and BiVO4-NPs is shown in Fig. 5c. Due to the variation of charge distribution on the surface of the BiVO4-NPs, some part of the PVDF chain is attracted while other parts get repelled resulting in the γ-phase formation.

image file: c4ra08427f-f5.tif
Fig. 5 (a) FTIR spectra of NPVDF and PNC# nanocomposite films in the 3100–2900 cm−1 region, (b) variation of damping co-efficient, rdc, with the loading of BiVO4-NPs within the PVDF matrix and (c) schematic representation of the electrostatic interaction between the surface charges of nanoparticles and the CH2/CF2 dipoles of PVDF.

3.6. XPS analysis

In order to appreciate the interfacial electrostatic interaction of the surface charge of the BiVO4-NPs with the molecular dipoles (i.e., CH2 or CF2-dipoles) in the PVDF matrix, high resolution C1s and F1s – XPS spectra of the NPVDF and PNC8 films have been analyzed.3 The two carbon species, CH2 and CF2 are evident from the C1s peaks at 286.5 and 291.0 eV respectively as shown in Fig. 6a. An expected unique peak at binding energy of 688.1 eV is observed in F1s region as depicted in Fig. 6b. In the C1s data, a clear intensity difference (ΔhCF2) between NPVDF and PNC8 film according to a smaller CF2 intensity for the PNC8 sample is observed in the CF2 line when the CH2 line is normalized. The integrated area ratio of CH2 (ACH2) and CF2 (ACF2) peaks is equal in NPVDF, which is consistent with the theory. In contrast, the sample PNC8 exhibits 5.5% reduction of the area due to CF2 species image file: c4ra08427f-t4.tif or in other words, 3.8% increase of the area attributed to the CH2 species image file: c4ra08427f-t5.tif (ESI, Table S3). Taking this into account, the change of CH2 and CF2 area ratio image file: c4ra08427f-t3.tif within the C1s data of the PNC8 film compared to the NPVDF film is about 9.0% (ESI, Table S3), which is very strong evidence of interfacial interaction.3
image file: c4ra08427f-f6.tif
Fig. 6 The high resolution (a) C1s and (b) F1s XPS spectra of NPVDF and PNC8 film. The open dots were used to indicate the asymmetry arises in F1s spectra in PNC8 film.

An adequate behavior is also observed in the F1s spectra of the PNC8 film (Fig. 6b), i.e., a change of the peak area (ΔAF1s) ∼ 5.0% and an asymmetry with line broadening, further supporting of interfacial interaction. Therefore, it can be concluded that XPS can reveal the interfacial interaction in PNC films which is a rich scientific validation of the electrostatic interaction between the surface charge of the NPs and the molecular dipoles in PVDF.

In addition, also weak signals of Bi4f and V2p lines could be detected in high resolution XPS (ESI, Fig. S5) indicating that the BiVO4-NPs are well coated within PVDF and mostly existing well below the escape depth (typically ∼10 nm) of the photoelectrons as the presence of BiVO4-NPs in PNC films were evident from XRD results (Fig. 2a). The surface morphology of the PNC films (Fig. 4) further supports that there are no passivated BiVO4-NPs present over the surface, which is somewhat different to the reported observation in gold-NPs doped PVDF films.22

3.7. Dielectric study

A dielectric study of the PNC films was carried out as a function of the weight fraction of the BiVO4-NPs within the PVDF polymer matrix. The frequency responses of dielectric constant and loss tangent (dielectric loss) are illustrated in Fig. 7a and b, respectively. The dielectric constant of the PNC films increases in comparison to neat PVDF film (NPVDF) over the entire range of frequency (42 Hz to 5 × 10⁶ Hz) domain. It is also observed that the dielectric permittivity of the PNC films exhibit strong frequency dependence. It reduces quickly in the low-frequency range (up to 2100 Hz), followed by a gradual decrease of dielectric constant and increasing trend of ac conductivity (ESI, Fig. S6) in the high frequency range.39 This is due to the fact that the concentration of the BiVO4-NPs fillers influences the resultant polarization in the composites system.4
image file: c4ra08427f-f7.tif
Fig. 7 The frequency dependent (a) dielectric constant and (b) dielectric loss of NPVDF and PNC films. The dielectric constant and loss at 1 kHz and 1 MHz as a function of weight fraction of BiVO4-NPs (c). The dielectric relaxation time as shown in NPVDF and PNC films (d).

In Fig. 7c the relative dielectric constant and loss factor are plotted vs. the BiVO4-NPs load within the PVDF matrix at selected low (1 kHz) and high (1 MHz) frequencies. The dielectric constant reaches to 44 with significantly low loss (at 1 kHz) in PNC8 film. In addition, we have found that the dielectric constant of PNC films in higher frequency range (i.e., 1 MHz) is also adequately higher than that of the neat PVDF (four times for PNC8 sample) accompanied by remarkable low loss, indicating their applicability as energy storage material in a broad frequency range.

The dielectric properties of PNC films at low frequency can be explained by interfacial polarization occurring due to Maxwell–Wagner–Sillars effect.4,6 Due to different relaxation times in PVDF matrix and inorganic phase of BiVO4-NPs, a significant amount of itinerant charge carriers are generated by surface polarization. Furthermore, a large number of dipoles are formed within the BiVO4-NPs as its dimension is of the order of 7 nm. The inertia of the formed dipoles in the PNC films leads to a prolongation of the polarization in comparison to other dielectric process, thus the interfacial polarization occurs at low frequency, and dielectric constant decreases rapidly in the higher frequency region. In contrast, the rapid decrease of dielectric constant is absent in NPVDF film. The frequency dependence of dielectric permittivity is more pronounced over the entire frequency domain in the PNC8 film, which may be attributed to the hollow spherical structures formed in the PNC8 film (Fig. 4d). This kind of frequency dependency of the dielectric constant is similar to core–shell or surface functionalized nanoparticles added PVDF films.

The frequency dependent dielectric loss of NPVDF and PNC films (Fig. 7b) goes through a minimum (dielectric relaxation) and then starts to increase with increasing frequency.40 More interestingly the dielectric loss in all the PNC films is lower than that of the NPVDF films in higher frequency region (>10 kHz). In addition, at 1 kHz, the dielectric loss is very close to that of the pure PVDF film and the loss is significantly lower with respect to its dielectric constant (Fig. 7c), especially if we compare these values with the available literature reports4,6–10,26–28 (ESI, Table S4). As per previous reports,41 the incorporation of nanoparticles can decrease the crystalline size of the PVDF polymer, leading to the reduction of the dielectric loss due to the reversal of dipoles up to a certain percolation limit.42 In our case, we found that the minimum dielectric loss occurs at 8 wt% loading of BiVO4-NPs into PVDF solution.

The relaxation time of the PNC films was also calculated from the relation, τrel = 1/fmin, where τrel is the relaxation time and fmin is the frequency of the lowest dielectric loss. The τrel is reduced from 166 μs (NPDVF) to 35 μs in PNC film (PNC8) as shown in Fig. 7d. It indicates that the dipolar polarization is dominant in this process.43 It should be noted that in temperature dependent dielectric loss exhibits a maxima due to ferroelectric relaxor behavior that occur at lower frequency region (∼1 kHz) at lower temperature (below room temperature) and shifted towards higher frequency regions as temperature increases. This type of behavior can be explained through Vogel-Tammann-Fulcher (VTF) formalism.39

3.8. Mechanical and energy storage properties

Stress–strain curves for selected PNC films and NPVDF are shown in Fig. 8a. The elongation at break reaches to more than 75% in PNC8 and PNC16 films, whereas NPVDF can sustain only 20% elongation.44 As the tensile testing is performed at room temperature, the BiVO4 nanoparticle fillers are allowed to move and align in preferable directions providing an additional energy dissipating mechanism to the PNC films resulting in more elongation compared to the NPVDF film. We have also calculated the toughness of the NPVDF and PNC films from the area under the curve of stress–strain curve. The overall toughness of PNC8 film exhibits 460% increase compared to the NPVDF sample. It should be noted that dramatic improvements in toughness have been reported only in a limited number of works.44,45 Therefore, the substantial improvement of mechanical properties in PNC films may establish innovative applications based on piezoelectric power sources, as the output voltage is governed by the relation V = d33 × stress × t,46 where d33 and t are the piezoelectric co-efficient and thickness of the films.
image file: c4ra08427f-f8.tif
Fig. 8 (a) Mechanical response of NPVDF and PNC films, (b) unipolar DE hysteresis loops of PNC films under DC electric field.

The dielectric displacement versus electric field (DE) loops of the PNC8 and PNC16 films are shown in Fig. 8b. PNC8 and PNC16 films shows maximal polarization of 0.071 and 0.069 C m−2, respectively and the remnant polarization (Dr) values of both films are 0.015 C m−2. The PNC8 and PNC16 films show energy discharge density (Ud = ∫EdD, where E is the applied electric field and D is the dielectric displacement) of 10.94 and 10.37 J cm−3 while the energy loss density (Ul = UcUd, where Uc is the energy charged density45) is 4.9 and 5.4 J cm−3, respectively, which is to date one of the best results in PVDF based nanocomposites films.47 Therefore it can be concluded that PNC films are applicable for high energy density storage and thus potential candidate for the rechargeable battery industry.

4. Conclusion

We have investigated PNC films, consisting of PVDF and BiVO4-NPs and their electroactive phase formation as well as their electroactive and mechanical responses. The highest yield of electroactive phases (FEA = 0.98) have been induced in the PNC films with the addition of 8 wt% BiVO4-NPs into the PVDF matrix. The nucleation of the electroactive phases in PNC films is explained by an electrostatic interaction model verified with FTIR and XPS spectroscopy. The substantial improvement of the dielectric properties have been achieved in PNC films over a broad range of frequency window (i.e., kHz to MHz). In particular, the best dielectric constant, i.e., εr = 44 with significant low loss (i.e., tan[thin space (1/6-em)]δ = 0.02) is observed in PNC films filled with 8 wt% BiVO4-NPs at 1 kHz. In addition, PNC films exhibits high energy density (Ud) up to 11 J cm−3 with significantly lower energy loss (Ul). Thus the PNC films with electroactive phase and superior dielectric properties may meet the requirements of next generation electronic components including high energy density flexible film type capacitors, generators for pulsed power, power conditioning, high k gate passivation layer in field effect transistors and so on. The superior toughness of the electroactive PNC films also indicates their usability for piezoelectric based flexible power sources in portable electronics devices.

Acknowledgements

The authors wish to thank the University Grants commission, the Govt. of India, for the financial assistance under the ‘University with potential for excellence (UPE II)’ scheme. Authors also thank for the support from Dr Karsten Henkel (BTU Cottbus-Senftenberg, Angewandte Physik-Sensorik, K.-Wachsmann-Allee 17, 03046 Cottbus, Germany) and Mr Sujoy Kumar Ghosh (ONPDL, Department of Physics, Jadavpur University, Kolkata 700 032, India) for their valuable suggestions while preparing manuscript.

References

  1. A. J. Lovinger, Science, 1983, 220, 1115–1121 CAS .
  2. X. Xue, P. Deng, S. Yuan, Y. Nie, B. He, L. Xing and Y. Zhang, Energy Environ. Sci., 2013, 6, 2615–2620 CAS .
  3. D. Mandal, K. J. Kim and J. S. Lee, Langmuir, 2012, 28, 10310–10317 CrossRef CAS PubMed .
  4. B. H. Fan, J. W. Zha, D. Wang, J. Zhao and Z. M. Dang, Appl. Phys. Lett., 2012, 100, 012903–012906 CrossRef PubMed .
  5. S. Satapathy, P. K. Gupta and K. B. R. Varma, J. Phys. D: Appl. Phys., 2009, 42, 055402–055408 CrossRef .
  6. K. Yu, Y. Niu, Y. Bai, Y. Zhou and H. Wang, Appl. Phys. Lett., 2013, 102, 102903–102907 CrossRef PubMed .
  7. T. Zhou, J. W. Zha, R. Y. Cui, B. H. Fan, J. K. Yuan and Z. M. Dang, ACS Appl. Mater. Interfaces, 2011, 3, 2184–2188 CAS .
  8. J. W. Zha, Z. M. Dang, T. Yang, T. Zhou, H. T. Song and S. T. Li, IEEE Trans. Dielectr. Electr. Insul., 2012, 19, 1312–1317 CrossRef CAS .
  9. A. C. Lopes, S. A. C. Carabineiro, M. F. R. Pereira, G. Botelho and S. L. Mendez, ChemPhysChem, 2013, 14, 1926–1933 CrossRef CAS PubMed .
  10. H. H. Park, Y. Choi, D. J. Park, S. Y. Cho, Y. S. Yun and H. J. Jin, Fibers Polym., 2013, 14, 1521–1525 CrossRef CAS PubMed .
  11. W. Li, Q. Meng, Y. Zheng, Z. Zhang and W. Xia, Appl. Phys. Lett., 2010, 96, 192905–192908 CrossRef PubMed .
  12. Q. M. Zhang, V. Bharti and X. Zhao, Science, 1998, 280, 2101–2104 CrossRef CAS .
  13. J. B. Lando, H. G. Olf and A. Peterlin, J. Polym. Sci., Part A-1: Polym. Chem., 1966, 4, 941–951 CrossRef CAS .
  14. J. Wang, H. Li, J. Liu, Y. Duan, S. Jiang and S. Yan, J. Am. Chem. Soc., 2003, 125, 1496–1497 CrossRef CAS PubMed .
  15. S. Yoon, A. A. Prabu, K. J. Kim and C. Park, Macromol. Rapid Commun., 2008, 29, 1316–1321 CrossRef CAS .
  16. S. J. Kang, Y. J. Park, I. Bae, K. J. Kim, H. C. Kim, S. Bauer, E. L. Thomas and C. Park, Adv. Funct. Mater., 2009, 19, 2812–2818 CrossRef CAS .
  17. K. J. Kim, Y. J. Cho and Y. H. Kim, Vib. Spectrosc., 1995, 9, 147–159 CrossRef CAS .
  18. J. I. Scheinbeim, B. A. Newman and A. Sen, Macromolecules, 1986, 19, 1454–1458 CrossRef CAS .
  19. S. Ramsundaram, S. Yoon, K. J. Kim and J. S. Lee, Macromol. Chem. Phys., 2008, 209, 2516–2526 CrossRef .
  20. X. Ma, J. Liu, C. Ni, D. C. Martin, D. B. Chase and F. Rabolt, ACS Macro Lett., 2012, 1, 428–431 CrossRef CAS .
  21. Y. L. Liu, Y. Li, J. T. Xu and Z. Q. Fan, ACS Appl. Mater. Interfaces, 2010, 2, 1759–1768 CAS .
  22. D. Mandal, K. Henkel and D. Schmeißer, Mater. Lett., 2012, 73, 123–125 CrossRef CAS PubMed .
  23. B. S. I. Gunduz, R. Alpern, D. Amare, J. Crawford, B. Dolan, S. Jones, R. Kobylarz, M. Reveley and P. Cebe, Polymer, 2010, 51, 1485–1493 CrossRef PubMed .
  24. D. Mandal, K. Henkel and D. Schmeisser, J. Phys. Chem. B, 2011, 115, 10567–10569 CrossRef CAS PubMed .
  25. S. Ramsundaram, S. Yoon, K. J. Kim and C. Park, J. Polym. Sci., Part B: Polym. Phys., 2008, 46, 2173–2187 CrossRef .
  26. F. He, J. Fan and S. Lau, Polym. Test., 2008, 27, 964–970 CrossRef CAS PubMed .
  27. M. D. Rozana, A. N. Arshad, M. H. Wahid, Z. Habibah, L. N. Ismail, M. N. Sarip and M. Rusop, IEEE Symposium on Business, Engineering and Industrial Applications, 2012, 6422866,  DOI:10.1109/ISBEIA .
  28. Y. Zhang, S. Jiang, M. Fan, Y. Zeng, Y. Yu and J. He, J. Mater. Sci.: Mater. Electron., 2013, 24, 927–932 CrossRef CAS .
  29. S. Sarkar and K. K. Chattopadhyay, Phys. E, 2012, 44, 1742–1746 CrossRef CAS PubMed .
  30. Z. Wang, W. Luo, S. Yan, J. Feng, Z. Zhao, Y. Zhu, Z. Li and Z. Zou, CrystEngComm, 2011, 13, 2500–2504 RSC .
  31. L. Zhou, W. Wang, L. Zhang, H. Xu and W. Zhu, J. Phys. Chem. C, 2007, 111, 13659–13664 CAS .
  32. S. Sarkar and K. K. Chattopadhyay, Phys. E, 2014, 58, 52–58 CrossRef CAS PubMed .
  33. J. Su, L. Guo, S. Yoriya and C. A. Grimes, Cryst. Growth Des., 2010, 10, 856–861 CAS .
  34. S. Sarkar, N. S. Das and K. K. Chattopadhyay, Solid State Sci., 2014, 33, 58–66 CrossRef CAS PubMed .
  35. M. Benz and W. B. Euler, J. Appl. Polym. Sci., 2003, 89, 1093–1110 CrossRef CAS .
  36. P. Martins, A. C. Lopes and S. L. Mendez, Prog. Polym. Sci., 2014, 39, 683–706 CrossRef CAS PubMed .
  37. S. S. Dunkle, R. J. Helmich and K. S. Suslick, J. Phys. Chem. C, 2009, 113, 11980–11983 CAS .
  38. S. C. Frank, Berkeley Physics Course: Waves, McGraw-Hill book company, New York, 1968, vol. 3 Search PubMed .
  39. A. C. Lopesa, C. M. Costa, R. Sabater i Serra, I. C. Neves, J. L. Gomez Ribellesc and S. Lanceros-Méndez, Solid State Ionics, 2013, 235, 42–50 CrossRef PubMed .
  40. M. Sharma, G. Madras and S. Bose, Phys. Chem. Chem. Phys., 2014, 16, 14792–14799 RSC .
  41. K. Yu, H. Wang, Y. Zhou, Y. Bai and Y. Niu, J. Appl. Phys., 2013, 113, 034105–034108 CrossRef PubMed .
  42. M. Y. F. Elzayat, S. El-Sayed, H. M. Osman and M. Amin, Polym. Eng. Sci., 2012, 52, 1945–1950 CAS .
  43. L. Zhu and Q. Wang, Macromolecules, 2012, 45, 2937–2954 CrossRef CAS .
  44. D. Shah, P. Maiti, D. D. Jiang, C. A. Batt and E. P. Giannelis, Adv. Mater., 2005, 17, 525–528 CrossRef CAS .
  45. A. Kelarakis, E. P. Giannelis and K. Yoon, Polymer, 2007, 48, 7567–7572 CrossRef CAS PubMed .
  46. H. Yu, T. Huang, M. Lu, M. Mao, Q. Zhang and H. Wang, Nanotechnology, 2013, 24, 405401 CrossRef PubMed .
  47. K. Yu, Y. Niu, Y. Bai, Y. Zhou and H. Wang, Appl. Phys. Lett., 2013, 102, 102903 CrossRef PubMed .

Footnote

Electronic supplementary information (ESI) available: A detailed description of direct and indirect band gap calculation of BiVO4-NPs is given and the concerning results are plotted in Fig. S1 and S2. The calculation of crystallinity in PVDF and PNC films are described and the XRD curve deconvolution is shown in Fig. S3. The % of crystallinity and the ratio of crystalline to amorphous content are tabulated in Table S1. Crystallinity calculated from XRD has been compared with that calculated from DSC in Table S2. The cross polarized optical microscopy image is shown in Fig. S4. The high resolution XPS (V2p and Bi4f region) of the PNC film is provided in Fig. S5. The detailed calculation of % change of CF2/CH2 peak area and ratio between CH2 and CF2 peaks w.r.t. NPVDF films are shown and tabulated in Table S3. Literature values of dielectric constant and loss factor of different PVDF-composites has been compared and tabulated in Table S4. Variation of ac conductivity with frequency is plotted in Fig. S6. See DOI: 10.1039/c4ra08427f

This journal is © The Royal Society of Chemistry 2014
Click here to see how this site uses Cookies. View our privacy policy here.