Analysis of benzoylurea insecticides in water samples with TiO2 nanotube array micro-solid phase extraction coupled to high performance liquid chromatography

Qingxiang Zhou*ab, Wei Wub and Yunrui Huangc
aBeijing Key Laboratory for Oil and Gas Pollution Control, College of Geosciences, China University of Petroleum, Beijing Campus, Beijing 102249, China. E-mail: zhouqx@cup.edu.cn; Fax: +86-10-89732300; Tel: +86-10-89732300
bSchool of Environment, Henan Normal University, Xinxiang 453007, China
cCollege of Chemistry and Pharmacy Engineering, Nanyang Normal University, Nanyang, 473061, China

Received 9th August 2014 , Accepted 12th September 2014

First published on 12th September 2014


Abstract

A rapid, easy to operate, and sensitive method was developed for the trace determination of benzoylurea insecticides based on a micro-solid phase extraction with highly ordered TiO2 nanotube arrays as the adsorbent prior to high performance liquid chromatography. The experimental results indicated that a good linear relationship was achieved between the peak areas and the concentrations of benzoylurea insecticides in the range of 0.1–40 μg L−1. The limits of detection (LODs) of diflubenzuron, chlorbenzuron, triflumuron and chlorfluazuron were 0.082, 0.026, 0.049 and 0.076 μg L−1, respectively. The proposed method was successfully used to determine the benzoylurea insecticides in environmental water samples. The spiked recoveries in the range of 76.5–102.4% were achieved. All these results demonstrated that the proposed method was of great value and would have great potential in the enrichment and determination of trace pollutants in the future.

1. Introduction

Benzoylurea insecticides have played an important role in the protection of crops as powerful insect growth regulators, which interfere with chitin synthesis in target pests and cause death. Benzoylurea insecticides have been included in integrated pest management programs for crops due to their attractive properties such as high selectivity, high biological activity, rapid degradation in soil and water and low acute toxicity, and so benzoylurea insecticides have been widely used in the past years.1,2 The acute mammalian toxicity of these four benzoylurea insecticides are very low and the oral LD50 to rat of diflubenzuron, chlorbenzuron, triflumuron and chlorfluazuron are higher than 5000 mg kg−1, 20[thin space (1/6-em)]000 mg kg−1, 5000 mg kg−1, and 8500 mg kg−1, respectively.3–6 However, interest in the safety of food products has increased, and pesticide residues in food crops have been in the center of increasingly strict regulations.7 Hence it is necessary to develop new monitoring techniques.

Because of their thermolability, benzoylurea residues have generally been analyzed by high-performance liquid chromatography (HPLC) with ultraviolet detector,8–11 fluorescence detector12–14 or mass spectrometry,15–18 etc. Gas chromatography (GC) has scarcely been employed to determine these insecticides, and only diflubenzuron and lufenuron were determined by gas chromatography with electron capture detection (GC-ECD).19,20 Because of the low concentration of analytes, the complexity of the matrices and the necessity to protect the instruments, sample pretreatment step has become critical in the analytical process for obtaining accurate and sensitive results. Up to date, many sample pretreatment techniques have been developed for the sample enrichment and cleanup. Solid-phase extraction (SPE) has become the most effective one of various techniques because of its advantages such as low cost, high enrichment factor and low consumption of organic solvents. As benzoylurea residues were concerned, the commonly used adsorbent for extraction was C18.17,21,22 When nanomaterial was introduced, it had achieved worldwide attention. In the past several years, specific TiO2 nanostructures have absorbed considerable interests due to their unique properties relevant to the applications such as chemical sensing, photoelectrochemical degradation, photocatalysis, and photovoltaics,23–25 etc. Nanometer-sized TiO2 tubules, wires, dots, and pillars were typical nanostructures and these materials could be synthesized by various methods such as anodic oxidation, electrochemical lithography, photoelectrochemical etching, sol–gel, hydrothermal synthesis, and template synthesis methods.26–35 Electrochemical anodization of titanium is a relatively simple process to prepare highly ordered TiO2 arrays with fluorinated electrolytes. In this paper, we prepared highly ordered, vertically oriented TiO2 nanotube arrays by this method. Because of large specific surface area, TiO2 nanotube arrays maybe have great analytical potential as an effective adsorbent for concerned compounds. To the best of our knowledge, there were no reports on the enrichment and separation of benzoylurea insecticides with TiO2 nanotube arrays up to now.

In the present study, a micro-solid-phase extraction (μSPE) was developed for the enrichment and determination of benzoylurea insecticides in water samples prior to high performance liquid chromatography with ultraviolet detector. The possible factors that will influence the extraction are investigated in detail.

2. Experimental

2.1. Reagents and apparatus

Diflubenzuron, chlorbenzuron, triflumuron, chlorfluazuron were purchased from Beijing Henxin Chemical Science and Technology Co., Ltd. (Beijing, China), and their chemical structures were listed in Table 1. The stock solutions were prepared in methanol and storing them at 4 °C in the refrigerator. The stock solutions were further diluted to yield the appropriate working solutions with methanol. HPLC grade methanol was obtained from Jiangsu Guoda Chemical Reagent Co., Ltd. (Huaian, China). Ultrapure water was prepared using a Millipore water generator system (Billerica, MA, USA) and all the other solvents were of analytical reagent grade. 1% (w/v) sodium hydroxide and 1 mol L−1 hydrochloric acid were used for adjusting the sample pH. All glasses used in the experiments were cleaned with pure water, then soaked in 6 mol L−1 nitric acid for 24 h and rinsed with ultrapure water before use.
Table 1 Chemical structure of target analytes
Analyte Chemical structure pKa Log[thin space (1/6-em)]Kow
Diflubenzuron image file: c4ra08399g-u1.tif 3.89
Chlorbenzuron image file: c4ra08399g-u2.tif
Triflumuron image file: c4ra08399g-u3.tif 4.9
Chlorfluazuron image file: c4ra08399g-u4.tif 8.1 5.8


Titanium sheets (99.6% purity) from Beijing Hengli Taiye Co., Ltd. (Beijing, China), Pt electrode was obtained from Shanghai Dianguang Device Factory (Shanghai, China) and 30 V potentiostat was purchased from the Fourth Wearless Factory of Shijiazhuang (JWY-30G, Shijiazhuang, China).

2.2. Preparation of TiO2 nanotube array36

Titanium sheets (0.2 mm thick, 10 × 20 mm size) with 99.6% purity (Beijing, China) were polished with metallographic abrasive paper, and then were degreased by sonicating in acetone, methanol and ultrapure water, and then the sheets were air-dried. The anodic oxidation was accomplished by using titanium sheet as the anode and platinum as the cathode. The distance between two electrodes was 3 cm in all experiments. The electrolyte was composed of 0.14 mol L−1 sodium fluoride and 0.5 mol L−1 phosphoric acid. The anodic oxidation was carried out at 20 V for 1 h. After electrolysis, titanium sheet was washed with ultrapure water and then air-dried.

2.3. μSPE procedure

The TiO2 nanotube array sheet was directly immersed into the 10 mL sample solution and kept a constant depth. After that, the sample vial was sealed. The extraction conditions were as the same of the optimized conditions. A magnetic stirrer was used at 500 rpm. After the equilibrium between adsorption and desorption basically reached, the TiO2 nanotube array sheet was removed, rinsed with ultrapure water, then air-dried, and eluted for desorption of analytes. TiO2 nanotube array sheet was directly immersed in a small amount of dichloromethane in order to make the target analytes desorbed completely. After 10 min, the TiO2 nanotube array sheet was removed, and dichloromethane was dried with a mild stream of nitrogen gas. Then the residues were dissolved in 100 μL methanol. Finally, 20 μL of the solution was injected for HPLC analysis.

2.4. HPLC analysis

A high performance liquid chromatography system, which consisted of two LC-10ATvp pumps and an SPD-10Avp ultraviolet detector (Shimadzu, Japan), was used for the analysis and separation. A reversed-phase SunFireTM C18 column (150 mm × 4.6 mm, particle size, 5 μm) was used for separation at ambient temperature and Chromate Solution Light Chemstation for LC system was employed to acquire and process chromatographic data. The mobile phase was composed of methanol and water (80/20, v/v), and the flow rate was set at 0.8 mL min−1. The injection volume was 20 μL and the detection wavelength was set at 254 nm.

2.5. Water samples

In this work, four environmental water samples such as lake water, wastewater and melted snow water were selected for validating the proposed method. Lake water samples were collected from Donghu Lake in Xinxiang City, Henan province, China, and Shouxihu Lake in Yangzhou City, Jiangsu province, China. Wastewater sample was taken from Luotuowan Wastewater Treatment Factory in Xinxiang City, Henan Province, China. Snow sample was collected from Henan Normal University, Xinxiang, Henan Province. All the collected samples were filtered through 0.45 μm micropore membranes after sampling and were kept in glass containers, then stored at 4 °C.

3. Results and discussion

3.1. Effect of organic solvents on the desorption

A μSPE procedure is very like a SPE procedure, in which the difference is that the μSPE is an equilibrium procedure and the free diffusion is the deriving force, and the SPE is driven by external force. However, the similar part is that they also need an elution step. This step is very crucial because the elution performance determines whether the proposed method is successful or not. So this elution step should be given more attention. Different desorption efficiency will be obtained when different solvents are used because of the physical and chemical properties of the organic solvents and the characteristics of the target analytes. In this experiment, five organic solvents such as methanol, acetonitrile, acetone, n-hexane and dichloromethane were investigated for desorption. The results were exhibited in Fig. 1. From Fig. 1, it was found that the extraction efficiency was the lowest when n-hexane was used, and the extraction efficiency with acetonitrile was better than that with acetone. The extraction efficiency obtained with dichloromethane was the best among the tested solvents. So it was used in the further experiments.
image file: c4ra08399g-f1.tif
Fig. 1 Effect of organic solvents. Spiked sample concentration, 5 μg L−1; sample pH, pH 7; extraction time, 60 min; desorption time, 10 min.

3.2. Effect of equilibrium time

Although the μSPE is an equilibrium extraction procedure, it is obvious to need a certain time to reach an equilibrium state. In this new extraction procedure, it can be considered as the extraction time. So the equilibrium time is an important parameter in the μSPE procedure. In order to achieve a reasonable extraction time, the effect of extraction time was investigated in the range of 20–100 min. The results were shown in Fig. 2. It was obviously that for all analytes the extraction efficiencies were improved significantly with the increase of extraction time up to 60 min, and then the extraction efficiencies had very little change when the extraction time increased further. Hence 60 min was optioned.
image file: c4ra08399g-f2.tif
Fig. 2 Effect of equilibrium time. Spiked sample concentration, 5 μg L−1; sample pH, pH 7; eluant, dichloromethane; desorption time, 10 min.

3.3. Effect of desorption time

Desorption of analytes from the adsorbent is an important step. Desportion performance is related to the elutant and desorption time. These two parameters are the key factors for obtaining best desorption performance. The elutant has been investigated above. The desorption time was investigated in the range of 3–15 min and the results indicated that the desorption efficiencies increased in the first 9 min, and then had no markedly change when the time increased continuously up to 15 min. Hence 9 min was used for desorption of target compounds.

3.4. Effect of sample pH

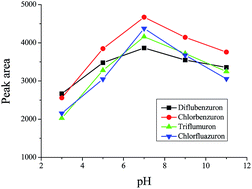
Sample pH is often a key parameter in the sample preconcentration techniques such as liquid–liquid extraction, liquid phase microextraction, solid phase extraction, solid phase microextraction, stirring bar extraction, and so on. It also plays an important role in this developed μSPE procedure because pH value determines the existing form of the analytes, and then affects the extraction efficiency. In this experiment, the effect of sample pH on the enrichment was evaluated in the range of pH 3.0–11.0, and the experimental data were demonstrated in Fig. 3. From the figure, we could see that the extraction efficiencies at pH 7 were the best because the target analytes was not stable in strong acid and alkaline environment, so they were hard to be extracted under strong acid and alkaline environment. Based on these facts, sample pH was adjusted to pH 7.0 in the subsequent experiments.
image file: c4ra08399g-f3.tif
Fig. 3 Effect of pH. Spiked sample concentration, 5 μg L−1; eluant, dichloromethane; extraction time, 60 min; desorption time, 9 min.

3.5. Salting-out effect

The ion strength in the sample will affect the solubility of analytes, and which will play an important role in the sample preconcentration procedure. It is often investigated in the sample preconcentration technique development. In some cases, it will result in several folds increase in the enrichment performance. However, it maybe has no or negative effect on the enrichment based on the properties of the analytes. In this experiment it was optimized in the range of 0–30% (w/v). The results indicated that the results without addition of NaCl were much better than that with addition of NaCl. In order to save time and cost, NaCl was not added in following experiments.

3.6. Analytical performance

As a monitoring method was concerned, the detection limits, precisions and linear ranges were important parameters in evaluating the sensitivity and stability of the proposed method. A series of designed experiments with spiked water solutions have been utilized for obtaining these related parameters. These data were shown in Table 2. It was found that there was excellent linearity between peak areas and the concentrations of diflubenzuron, chlorbenzuron, triflumuron, chlorfluazuron in the range of 0.1–40 μg L−1. The limits of detection (LODs) were in the range of 0.026–0.082 μg L−1 on the basis of signal to noise ratio of 3 (S/N = 3). The reproducibility expressed as the relative standard deviations (RSDs) was obtained by six duplicate experiments with spiked samples. Based on these results, proposed method provided excellent limits of detection and high stability, so it will have a tremendous prospect for the trace analysis of these analytes in real water samples.
Table 2 HPLC Analytical parameters of proposed method
Analyte Linear range (μg L−1) R2 Precisions (RSD, %, n = 6) LOD (μg L−1, S/N = 3)
Diflubenzuron 0.1–40 0.9956 5.7 0.082
Chlorbenzuron 0.1–40 0.9914 4.5 0.026
Triflumuron 0.1–40 0.9926 7.1 0.049
Chlorfluazuron 0.1–40 0.9931 6.4 0.076


3.7. Analysis of real water samples

To demonstrate the applicability of the TiO2 nanotube array for the enrichment of benzoylurea insectcides, the proposed method has been validated with four real environmental water samples and the results were shown in Table 3. The results indicated that no target analytes were found in blank water samples. These samples were then spiked with target analytes at two different concentrations to investigate the effect of sample matrices (Fig. 4). The spiked recoveries were satisfied in the range of 76.5–102.4%. In order to evaluate the merits of proposed method, a comparison was performed and the results were listed in Table 4. Zhang et al. developed a magnetic retrieval-ionic liquid dispersive liquid–liquid microextraction for the extraction of benzoylurea insecticides, in which the LODs of diflubenzuron and triflumuron were 0.05 and 0.14 μg L−1.37 Yang et al. utilized ionic liquid to establish an ionic liquid-assisted liquid–liquid microextraction based on the solidification of floating organic droplets, which provided the LODs for diflubenzuron, triflumuron and chlorfluazuron in the range of 0.03–0.28 μg L−1.38 The reported thin-film microextraction and the DLLME methods exhibited that LODs of mentioned benzoylurea insecticides were in the range of 0.1–0.82 μg L−1.39–41 In contrast, proposed method provided much lower LODs for the selected benzoylurea insecticides except the developed method of ultrasound-assisted ionic liquid dispersive liquid–liquid microextraction coupled to high-performance liquid chromatography with a hybrid triple quadrupole-linear ion trap-mass spectrometer,42 which resulted in LODs lower than proposed method. It was exactly a good tool for the sensitive determination of benzoylurea insecticides, however the cost of high-performance liquid chromatography with a hybrid triple quadrupole-linear ion trap-mass spectrometer was very expensive and the running cost was also very high. Present method achieved a good sensitivity only using the common analytical instrument (HPLC) in combination with a micro-solid phase extraction, which matched the requirement of routine analysis of such pollutants.
Table 3 Spiked recoveries of benzoylurea insecticides from real water samplesa
Analyte Spiked level (μg L−1) Shouxihu Lake Donghu Lake Snow Water Luotuowan Water
a ND-not detectable.b Spiked recovery, mean ± standard deviation (%).
Diflubenzuron BLANK ND ND ND ND
1 83.1 ± 2.7b 78.5 ± 3.4 87.4 ± 3.1 84.3 ± 3.9
10 88.4 ± 2.2 86.7 ± 2.7 95.6 ± 4.1 88.4 ± 4.8
Chlorbenzuron BLANK ND ND ND ND
1 86.2 ± 1.5 85.3 ± 1.4 93.3 ± 2.3 76.8 ± 2.5
10 91.9 ± 3.6 97.2 ± 2.3 102.4 ± 3.1 89.2 ± 2.3
Triflumuron BLANK ND ND ND ND
1 79.5 ± 3.2 84.3 ± 2.1 84.2 ± 2.8 87.2 ± 2.2
10 86.5 ± 2.7 92.4 ± 1.8 94.3 ± 2.9 88.7 ± 1.8
Chlorfluazuron BLANK ND ND ND ND
1 76.5 ± 1.6 84.2 ± 3.5 82.4 ± 1.4 82.3 ± 3.3
10 87.6 ± 1.9 95.3 ± 1.7 101.2 ± 2.6 97.6 ± 0.8


image file: c4ra08399g-f4.tif
Fig. 4 The typical chromatogram of diflubenzuron, chlorbenzuron, triflumuron, chlorfluazuron in Donghu Lake. (A) blank; (B) spiked at 1 μg L−1; (C) spiked at 10 μg L−1; (1) diflubenzuron; (2) chlorbenzuron; (3) triflumuron; (4) chlorfluazuron.
Table 4 A comparison of the reported enrichment methods with present method for benzoylurea insecticides
Benzoylurea Enrichment method Detection technique Sample matrice LODs (μg L−1) Ref.
a Magnetic retrieval-ionic liquid dispersive liquid–liquid microextraction (IL-DLLME).b Ionic liquid-assisted liquid–liquid microextraction based on the solidification of floating organic droplets.c High performance liquid chromatography with a variable wavelength detector.d Thin-film microextraction.e Ultrasound-assisted ionic liquid dispersive liquid–liquid microextraction.f High-performance liquid chromatography with a hybrid triple quadrupole-linear ion trap-mass spectrometer.
Chlorfluazuron MR-IL-DLLMEa HPLC-VWDc Water 0.05 37
Triflumuron 0.14
Diflubenzuron ILSFOD-LLMEb HPLC-VWD Fruit juice 0.28 38
Triflumuron 0.11
Chlorfluazuron 0.03
Diflubenzuron TFMEd HPLC-DAD Water 0.1 39
Triflumuron 0.1
Diflubenzuron US-IL-DLLMEe LC–QqLIT–MS/MSf Wastewater 0.001 40
Triflumuron 0.0005
Diflubenzuron DLLME HPLC-VWD Water 0.24 41
Triflumuron 0.31
Chlorfluazuron 0.82
Diflubenzuron US-IL-DLLME HPLC-VWD Water 0.29 42
Triflumuron 0.45
Chlorfluazuron 0.24
Diflubenzuron μSPE HPLC-VWD Water 0.082 Present work
Triflumuron 0.049
Chlorfluazuron 0.076
Chlorbenzuron 0.026


4. Conclusion

Present study established a simple, rapid, easy to operate and sensitive micro-solid phase extraction method with TiO2 nanotube array for the extraction of diflubenzuron, chlorbenzuron, triflumuron, chlorfluazuron in environmental water samples. The proposed method earned good linear range, precisions and low detection limits. The proposed method was used for analysis of real water samples, and the spiked recoveries were satisfied in the range of 76.5–102.4%. These experimental results demonstrated that TiO2 nanotube array had exhibited high enrichment ability for benzoylurea insecticides, and would have tremendous prospect for the trace analysis of pollutants.

Acknowledgements

This work was financially supported by the National Natural Science Foundation of China (21377167), and Science Foundation of China University of Petroleum, Beijing (KYJJ2012-01-15) and the Special fund of Nanyang Normal University (ZX2012011).

References

  1. C. Tomlin, The pesticide manual, The Royal Society of Chemistry, Cambridge, 10th edn, 1994 Search PubMed.
  2. British Crop Protection Council and The Royal Society of Chemistry, The pesticide manual, British Crop Protection Council and The Royal Society of Chemistry, London, UK, 10th edn, 1994 Search PubMed.
  3. United States Environmental Protection Agency, Reregistration Eligibility Decision (RED) Diflubenauron, Prevention, Pesticides and Toxic Substances (7508w), EPA738-R-97-008, 1997.
  4. http://www.basechem.org/chemical/49174.
  5. http://www.agropages.com/AgroData/Detail-3218.htm.
  6. http://www.basechem.org/chemical/20141.
  7. C. Bicchi, C. Balbo, A. Binello and A. D'Amato, J. High Resolut. Chromatogr., 1996, 19, 105–110 CrossRef CAS.
  8. M. Gamon, A. Saez, R. Pelegri, I. Peris and J. G. de la Cuadra, J. AOAC Int., 1998, 81, 1037–1042 CAS.
  9. A. Balinova, J. Chromatogr. A, 1998, 823, 11–16 CrossRef CAS.
  10. C. Bicchi, C. Balbo, A. D'Amato and O. Panero, Chromatographia, 1996, 43, 439–443 CAS.
  11. M. M. Galera, T. L. López, M. D. G. García, J. L. M. Vidal and P. P. Vázquez, J. Chromatogr. A, 2001, 918, 79–85 CrossRef.
  12. M. D. Gil García, M. M. Galera, D. B. Martínez and J. G. Gallego, J. Chromatogr. A, 2006, 1103, 271–277 CrossRef PubMed.
  13. M. D. G. García, D. B. Martínez, M. M. Galera and P. P. Vázquez, J. Sep. Sci., 2004, 27, 1173–1180 CrossRef PubMed.
  14. K. A. Barnes, R. J. Fussell, J. R. Startin, S. A. Thorpe and S. L. Reynolds, Rapid Commun. Mass Spectrom., 1995, 9, 1441–1445 CrossRef CAS PubMed.
  15. K. A. Barnes, R. J. Fussell, J. R. Startin, M. K. Pegg, S. A. Thorpe and S. L. Reynolds, Rapid Commun. Mass Spectrom., 1997, 11, 117–123 CrossRef CAS.
  16. A. Garrido-Frenich, M. D. Gil-García, F. J. Arrebola, J. L. Martínez-Vida, M. Martínez-Galera and T. López-López, Chromatographia, 2000, 52, 569–574 Search PubMed.
  17. X. Yang, Y. Xia, X. Liao, Y. Zuo, Y. Liao and H. Liu, Talanta, 2006, 70, 75–87 CrossRef CAS PubMed.
  18. H. J. Stan and P. Klaffenbach, Fresenius' J. Anal. Chem., 1991, 339, 40–45 CrossRef CAS.
  19. J. K. Mensah, E. Lundanes, T. Greibrokk and B. Holen, J. Chromatogr. A, 1997, 765, 85–90 CrossRef CAS.
  20. N. M. Brito, S. Navickiene, L. Polese, E. F. G. Jardim, R. B. Abakerli and M. L. Ribeiro, J. Chromatogr. A, 2002, 957, 201–209 CrossRef CAS.
  21. G. E. Miliadis, N. G. Tsiropoulos and P. G. Aplada-Sarlis, J. Chromatogr. A, 1999, 835, 113–120 CrossRef CAS.
  22. L. F. S. Santos, N. R. da Silva Souza, J. A. Ferreira and S. A. Navickiene, J. Food Compos. Anal., 2012, 26, 183–188 CrossRef CAS PubMed.
  23. R. Dommarco, A. Santilio, L. Fornarelli and M. Rubbiani, J. Chromatogr. A, 1998, 825, 200–204 CrossRef CAS.
  24. S. Livraghi, A. Votta, M. C. Paganini and E. Giamello, Chem. Commun., 2005, 4, 498–500 RSC.
  25. A. Hagfeldt and M. Gratzel, Acc. Chem. Res., 2000, 33, 269–277 CrossRef CAS PubMed.
  26. D. W. Gong, C. A. Grimes and O. K. Varghese, J. Mater. Res., 2001, 16, 331–334 CrossRef.
  27. J. Choi, R. B. Wehrspohn, F. Lee and U. Gösele, Electrochim. Acta, 2004, 49, 2645–2652 CrossRef CAS PubMed.
  28. S. Z. Chu, S. Inoue, K. Wada, S. Hishita and K. Kurashima, J. Electrochem. Soc., 2005, 152, B116–B124 CrossRef CAS PubMed.
  29. H. Masuda, K. Kanezawa, M. Nakao, A. Yokoo, T. Tamamura, T. Sugiura, H. Minoura and K. Nishio, Adv. Mater., 2003, 15, 159–161 CrossRef CAS.
  30. J. E. G. L. Wijnhoven and W. L. Vos, Science, 1998, 281, 802–804 CrossRef CAS.
  31. W. Z. Wang, O. K. Varghese, M. Paulose, C. A. Grimes, Q. L. Wang and E. C. Dickey, J. Mater. Res., 2004, 19, 417–422 CrossRef CAS.
  32. D. V. Bavykin, V. N. Parmon, A. A. Lapkin and F. C. Walsh, J. Mater. Chem., 2004, 14, 3370–3377 RSC.
  33. P. L. Chen, C. T. Kuo and F. M. Pan, Appl. Phys. Lett., 2004, 84, 3888–3890 CrossRef CAS PubMed.
  34. P. Hoyer, Langmuir, 1996, 12, 1411–1413 CrossRef CAS.
  35. X. H. Li, W. M. Liu and H. L. Li, Appl. Phys. A, 2005, 80, 317–320 CrossRef CAS PubMed.
  36. H. Liu, X. Cao, G. Liu, Y. Wang, N. Zhang, T. Li and R. Tough, Chemosphere, 2013, 93, 160–165 CrossRef CAS PubMed.
  37. J. H. Zhang, M. Li, M. Y. Yang, B. Peng, Y. B. Li, W. F. Zhou, H. X. Gao and R. H. Lu, J. Chromatogr. A, 2012, 1254, 23–29 CrossRef CAS PubMed.
  38. M. Y. Yang, P. J. Zhang, L. Hu, R. H. Lu, W. F. Zhou, S. B. Zhang and H. X. Gao, J. Chromatogr. A, 2014, 1360, 47–56 CrossRef PubMed.
  39. C. H. Wang, X. X. Ma, C. Wang, Q. H. Wu and Z. Wang, Chin. Chem. Lett., 2014 DOI:10.1016/j.cclet.2014.06.018.
  40. M. M. P. Vázquez, P. P. Vázquez, M. M. Galera and A. U. Moreno, J. Chromatogr. A, 2014, 1356, 1–9 CrossRef PubMed.
  41. Q. X. Zhou, G. Q. Wang and G. H. Xie, J. Sep. Sci., 2013, 36, 2323–2329 CrossRef CAS PubMed.
  42. Q. X. Zhou and X. G. Zhang, J. Sep. Sci., 2010, 33, 3734–3740 CrossRef CAS PubMed.

This journal is © The Royal Society of Chemistry 2014
Click here to see how this site uses Cookies. View our privacy policy here.