DOI:
10.1039/C4RA08201J
(Paper)
RSC Adv., 2014,
4, 53090-53096
Influence of different membrane environments on the behavior of cholesterol†
Received
6th August 2014
, Accepted 30th September 2014
First published on
2nd October 2014
Abstract
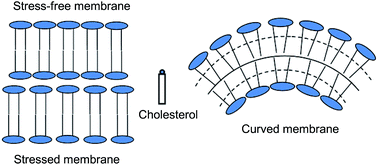
With the aid of molecular dynamics simulations, we study the behavior of cholesterol in several representative membrane environments. Especially, we pay attention to the relation between local lipid packing and the thermodynamic properties of cholesterols in different membranes. It is found that the entropy and enthalpy values of cholesterols in different membranes depend on the membrane lipid packing. Loose lipid packing always corresponds to favorable entropy but disadvantaged enthalpy, while dense lipid packing has an opposite role. We further investigate the transbilayer distribution of cholesterols in curved membrane and find that the cholesterol will adjust its distribution in the two leaflets of curved membrane as the two leaflets have different lipid packing styles. And quantitatively, we present a simple theory model to explain the redistribution of cholesterols in curved membrane and discuss its potential impact on the membrane deformation process.
I. Introduction
Cholesterol is an essential and abundant constituent of mammalian cells.1,2 It is widely distributed in various organelle membranes as well as the plasma membrane. But the levels of cholesterol in these different membranes can vary greatly. For example, it typically accounts for 20–25% of the lipid molecules in the plasma membrane, but only as low as 1% of the total cell cholesterol is present in the endoplasmic reticulum where it is synthesized. Organisms have developed sophisticated mechanisms to maintain the lateral and transbilayer distributions of cholesterol in the plasma membrane and the overall cellular cholesterol levels among cellular organelles.3,4 Disorders in the metabolism and transport of cholesterol can play a key role in some diseases.5–7 For example, excess cholesterol in the cell is associated with atherosclerosis.
Within the class of lipid molecules, cholesterol is rather special. It is comprised of a small 3–OH polar headgroup, and a bulky hydrophobic tetrameric ring followed by a short acyl chain. On the whole, it is much smaller, more rigid and more hydrophobic than the other phospholipid components of the cell membrane. Hence, it can rigidify the fluid membrane and change the permeability and fluidity of the membrane.8–11 When mixed with saturated and unsaturated lipids in vitro, it promotes the phase separation of a liquid-disordered phase and a liquid-ordered phase.12–16 The liquid-disordered phase (ld phase) only has a small quantity of cholesterol, while the liquid-ordered phase (lo phase) is enriched with cholesterol and closely related to the lipid rafts of cellular membranes.17 In addition, many experiments and simulations have indicated that the cholesterol can flip-flop readily between the two leaflets of the membrane,18–21 which may help cholesterol adjust itself quickly to variations in the membrane environment. The unique biophysical properties of cholesterol have made it one of the most important regulators of membrane organization and function. However, the precise mechanism of how cholesterols maintain their specific inter- or intra-membrane distribution and how the specific distribution influences the membrane function is still not well understood. So it is of great importance to do a more detailed investigation on the interactions between cholesterol and lipid molecules.
In this work, we will firstly analyze the thermodynamical properties of cholesterol in membranes under several different conditions and explore some general aspects which can influence cholesterol behavior. Further simulations will focus on the role of membrane curvature in cholesterol’s transbilayer distribution. And a quantitative theory analysis will be presented to help better understand the transbilayer distribution of cholesterol and its potential influence on the membrane deformation process.
II. Methods and models
The Martini force field which was developed by Marrink’s group22,23 is used to perform the molecular dynamics simulations. We mainly construct four different lipid bilayers, i.e., DPPC, DOPC, DPPE and DPPC bilayers under tension. To investigate the condensing effect, they are mixed with cholesterols at different mole fractions from 0% to 60%, with the total number of molecules fixed as 256. As an example, Fig. 1A shows a bilayer with 208 DPPC molecules and 48 cholesterol molecules (∼20% cholesterol content). The equilibrium configuration of DPPC, DOPC or DPPE bilayers with 20% cholesterol content can be found in Fig. S1 in the ESI.† To calculate the free energy for cholesterol partitioning into different pure lipid bilayers, biased simulations are done by using a harmonic potential with a force constant of 1000 kJ mol−1 nm−2 applied between the hydroxyl of cholesterol and the center of mass of the bilayer. Each umbrella sampling window includes two cholesterols which are always spaced 4 nm apart along the bilayer normal (Z direction).20,24 The first umbrella sampling configuration is shown in Fig. 1B with one cholesterol in the bulk water and the other in the center of the bilayer. Consequently, 40 configurations are produced by pulling the two cholesterol molecules in the same direction with 0.1 nm per step within the range from Z = −4.0 nm to Z = 4.0 nm. The weighted histogram analysis method (WHAM)25 is applied to calculate the potential of mean force (PMF) after 480 ns of simulation for each window. To further obtain the entropy and enthalpy contributions, PMFs for three adjacent temperatures (323 K, 333 K, and 343 K) are calculated. The entropy contribution (ΔS) can be calculated by using the centered difference method:
where T is the simulation temperature and G denotes the free energy. Further, the enthalpy contribution (ΔH) can also be estimated by using the formula ΔH = ΔG + TΔS. PMFs for DPPC partitioning into a pure lipid bilayer are obtained in the same way, except that the constraining force acts on the phosphate group of DPPC and the simulation time is increased to 1280 ns.
 |
| Fig. 1 (A) Configuration of a bilayer with 208 DPPC molecules and 48 cholesterol molecules. The left panel shows the side view of the bilayer including cholesterol molecules and phospholipid headgroup beads and the right panel shows the top view including the glycerol ester moieties of the phospholipids and polar hydroxyl groups of cholesterol. (B) First umbrella sampling configuration with one cholesterol in the bulk water and the other in the center of the bilayer, which are separated by 4 nm in the Z direction. The cholesterol molecules are displayed as big green beads. The phospholipid headgroups are displayed as orange beads and the phospholipid tails are displayed as thin green lines. For clarity, water is not shown. | |
To investigate the effect of membrane curvature on the distribution of cholesterol, we push a spherical nanoparticle against an enlarged membrane with moderate force.27 The enlarged membrane consists of 7488 DPPC lipids and 1728 cholesterols (18.8% cholesterol content). The nanoparticle is constructed by a face-center-cubic lattice consisting of Martini nonpolar (Nda) beads.28 It is about 10 nm in diameter and moves as a rigid body during the simulation.29,30 Standard Martini force field input parameters are used here. Enough water molecules are introduced in all the simulation systems. All simulations are performed in the NPT ensembles with a constant temperature (T) of 323 K and a constant pressure (P) of 1 bar unless otherwise stated. A time step of 20 fs is used for our simulations. Notice that the effective time sampled in CG simulations is 4 times as large as that in atomistic simulations,31 so here the effective simulation time step is approximately 80 fs. All simulations and analyses are performed using the GROMACS 4.5.5 software package.32
III. Results and discussion
A. Cholesterol condensing effect
As shown in Fig. 1A, the cholesterol molecule locates itself underneath the polar headgroup of phospholipid molecules and its polar hydroxyl group is surrounded by the glycerol ester moieties of neighboring phospholipid molecules. As it fills the interstitial spaces underneath the phospholipid headgroups, it can induce the well-known condensing effect33–35 (i.e., the averaged cross-sectional area of lipids in the mixed bilayer is reduced). Here, we calculate the acyl chain order parameter Sn and area per lipid as a function of the mole fraction of cholesterol (see Fig. 2A). Notice that only the averaged cross-sectional area of DPPC (or DOPC, DPPE) molecules is calculated, namely, the area per lipid is obtained by dividing the total area of membrane by the total number of phospholipid molecules, excluding cholesterol molecules (the area per lipid including cholesterol molecules is shown in Fig. S2 in the ESI†). In this way, we can focus on the change in the phospholipid’s effective size (mutual interval) upon constant addition of cholesterol. We find that when the mole fraction of cholesterol is low, Sn rises quickly while the size of the phospholipid only increases a little. For example, the area per lipid for a pure DPPC bilayer is about 0.625, and the value is about 0.665 for a DPPC bilayer with 30% cholesterol content (about a 6% expansion). The 30% DPPC bilayer has 180 DPPC molecules, and we can further imagine that if we add less than 76 cholesterol molecules (30% cholesterol content) to the pure bilayer of 180 DPPC molecules, the primary lipid bilayer will only have a very small expansion which should be less than 6%. So cholesterol has chosen to straighten the acyl chains to better intercalate into the limited space under the phospholipid headgroups, instead of enlarging the primary size of phospholipid. This is in accordance with the basic viewpoint of the umbrella model that cholesterol needs the protection of phospholipid’s polar headgroup.36,37 By straightening the acyl tails, the enthalpy will be favorable and some translation entropy may also be obtained as the interstitial space is enlarged, while the configuration entropy of phospholipids is decreased. Generally, the whole process should be energetically favorable. In this sense, the whole process resembles a quasi chemical reaction as the condensed complex model implies.38 However, as the mole fraction of cholesterol increases, the condensing effect will gradually become weak since more and more acyl chains have been straightened, hence the effective size of the phospholipid will enlarge quickly (see Fig. 2A). Starting from the feature of the condensing effect, we can infer that if the type of neighboring lipid varies, the behavior of cholesterol will become different. Take the condensing effect for example, as DOPC has two unsaturated acyl chains which could be more difficult to straighten, the cholesterol condensing effect in DOPC bilayers is less obvious than that in DPPC and DPPE bilayers (see Fig. 2B). Indeed, the distribution of cholesterol in the DOPC bilayer is relatively disordered. The orientation of cholesterol is more random in the DOPC bilayer, and compared with the case of saturated phospholipids (DPPC, DPPE), there are fewer polar hydroxyl groups of cholesterol residing at the level of the glycerol moieties of the phospholipid (see Fig. S1†). In addition, cholesterol may also influence the lateral distribution of lipid molecules in a multi-component membrane, as recent theory and experiments have shown that lipids of multi-component membranes may tend to adopt regular (superlattice-like) lateral distributions at certain component proportions.39,40
 |
| Fig. 2 (A) Profile of order parameter Sn and area per lipid as functions of the mole fraction of cholesterol in a DPPC bilayer. (B) Contrast among DPPC, DOPC and DPPE bilayers. | |
B. Thermodynamics analysis of cholesterol in different membranes
As the lipid environment changes, the thermodynamics properties will also change correspondingly. The free energy profile of cholesterol in a DPPC bilayer as well as the corresponding entropy and enthalpy components are shown in Fig. 3A. And the curves for DOPC and DPPE bilayers can be found in Fig. S3 of the ESI.† The major thermodynamic quantities including desorption energy (ΔGd), entropy (−TΔS) and enthalpy (ΔH) values around the equilibrium position (z), and free energy barrier (ΔGb) for moving cholesterol from equilibrium to the bilayer center are listed in Table 1. We can find that the desorption energy of cholesterol in the three types of lipid membranes only shows a small difference, but the values of entropy and enthalpy can be quite different. For example, the difference in entropy value between DOPC and DPPE bilayers is about 45 kJ mol−1. As shown in Fig. 3B, the entropy and enthalpy contrast curve between DOPC and DPPE bilayers also shows the difference. Since the DOPC bilayer has more loose packing (see Fig. 2B) and therefore more free space among phospholipids, cholesterol obtains more entropy in the DOPC bilayer. However, the loose packing induces more exposure of the nonpolar part of cholesterol to water, which yields an unfavorable enthalpy contribution. In contrast, the DPPE bilayer can provide the best shielding for cholesterol, hence the lowest enthalpy value, but the dense packing of DPPE lipid makes the entropy disadvantaged.
 |
| Fig. 3 (A) PMFs for cholesterol partitioning in DPPC bilayers with three different temperatures, and the corresponding entropy and enthalpy contributions for the PMF of 333 K. (B) Entropy and enthalpy contrast between DPPE and DOPC. | |
Table 1 Thermodynamics properties of cholesterol (rows 2–5) or DPPC molecules (rows 6–7) in different lipid bilayers
System/condition |
z
|
ΔGd |
ΔGb |
−TΔS |
ΔH |
DPPC bilayer |
1.5 |
−91.4 |
12.2 |
62.0 |
−151.5 |
Stressed bilayer |
1.1 |
−90.6 |
11.6 |
40.0 |
−127.4 |
DOPC bilayer |
1.6 |
−91.3 |
9.5 |
43.2 |
−130.0 |
DPPE bilayer |
1.5 |
−95.2 |
15.5 |
135.5 |
−225.2 |
DPPC bilayer |
2.0 |
−99.3 |
79.7 |
|
|
Stressed bilayer |
1.6 |
−109.8 |
59.8 |
|
|
To further investigate the influence of phospholipid headgroups on the behavior of cholesterol in the membrane, we directly apply a large lateral (xy-plane) pressure of −50 bar to the DPPC bilayer, and compare the thermodynamics properties of cholesterol in the expanded and stress-free DPPC bilayers (see Fig. 4A and Table 1). Since the size of the phospholipid (and hence the interstitial spaces) is enlarged under tension, the entropy increases, but the enthalpy is disadvantaged along with greater exposure of cholesterol to water. In contrast, we calculate PMFs for a DPPC molecule partitioning into stress-free or stressed DPPC bilayers (see Fig. 4B). It is obvious that the desorption energy for a bilayer under tension dramatically decreases compared with the stress-free bilayer. As shown in Fig. 4C, if we add one phospholipid into one leaflet of the stress-free membrane, the whole membrane will expand, or if the total membrane area is fixed, the leaflet with the addition of phospholipid will be more crowded, both of which are energy-disadvantaged. When the phospholipid is added to the stressed membrane, it will fit into the interstitial space and the added phospholipid together with the primary phospholipids will adjust their mutual interval, making it closer to the equilibrium value. In this way, adding one phospholipid can effectively relax the stressed membrane. This could be quite different from that in the case of cholesterol, where low levels of cholesterol inserting into the membrane has little effect on the mutual interval of primary phospholipids. In addition, compared with the case in the stress-free membrane, the cholesterol is more exposed to water in the stressed membrane, which makes it very enthalpy-disadvantaged. So when facing a stress-free or stressed membrane, the phospholipid will prefer to go into the stressed one to decrease the whole system’s free energy, while the cholesterol will have its choice depending on the competitive relationship between entropy and enthalpy in the specific neighboring environment. On the basis of the above discussion, the cholesterol may not clearly show the “stress relaxation effect” asserted in ref. 41, as it cannot relax the stressed membrane effectively.
 |
| Fig. 4 (A) Entropy and enthalpy contrast between stress-free and stressed DPPC bilayers. (B) PMFs for DPPC partitioning in stress-free and stressed DPPC bilayers. (C) Schematic diagram of the addition of one cholesterol or phospholipid molecule to the stress-free or stressed bilayer. | |
C. Redistribution of cholesterol in curved membrane and discussion of its implications
Besides the types of lipids and the surface tension, the curvature is another principal element which can influence the cholesterol behavior. Actually, the cell experiences various membrane deformation processes constantly, such as budding, endocytosis, and the vesicular trafficking process.2,42–46 It is of great significance to investigate cholesterol’s transbilayer distribution when the membrane is deformed. In addition, since the barrier for cholesterol flip-flop is rather small, the easy flip-flop of cholesterol may influence its distribution in the two leaflets. Here, in order to generate a curved membrane, we push a spherical nanoparticle to the membrane with a moderate force. The membrane will adjust its shape constantly until the nanoparticle is balanced between the added force and the membrane deformation (see Fig. 5A, and the time sequence of the nanoparticle interacting with the membrane shown in Fig. S4†). Long time simulations (up to 2 µs) are carried out to observe the distribution and flip-flop of cholesterol. The number of cholesterol molecules in each leaflet is counted; in the meantime, three different portions are distinguished according to the mean curvature: H ≈ 2/R (R is the radius of the nanoparticle, about 5 nm), H > 0 and H ≤ 0 portion (see Fig. 5A and Table 2). More details about the partitioning of the three portions and the counting of the number of cholesterol molecules can be found in the ESI.† As shown in Fig. 5A, at the highly curved portion of the membrane, we can find that cholesterol molecules are more “crowded” (enriched) in the inner leaflet (the one closer to the nanoparticle) of the curved membrane. And the detailed counting results (see Table 2) show that in the H ≈ 2/R and H > 0 portions, the mole fraction of cholesterol in the inner leaflet is larger than in the outer leaflet, while in the H ≤ 0 portion, cholesterol is more enriched in the outer leaflet. Both the diffusion and flip-flop of cholesterol can help its redistribution across the bilayer. As shown in Table 2, more cholesterol molecules go into the inner leaflet through flip-flop in the H ≈ 2/R, H > 0 portion and this is reversed in the H ≤ 0 portion. When a membrane is curved, the two leaflets are curved independently. As illustrated schematically in Fig. 5B, the headgroups of the outer leaflet are stretched a little bit, while the tail portions are compressed. On the contrary, the headgroups of the inner leaflet are compressed, but the tails are stretched. On the basis of previous simulation results, we can infer qualitatively that cholesterol can get better protection in the inner leaflet. Thus cholesterol tends to locate in the leaflet where its headgroup size reduces as shown in our simulation (see Table 2). Some other experiments and simulations under different conditions also implied similar distribution characteristics of cholesterol in curved membrane.47–50
 |
| Fig. 5 (A) Final configuration in our simulation. The nanoparticle is in yellow. The phospholipid headgroup is in orange and the cholesterol in green. Water and phospholipid tails are not shown for clarity. The leaflet near the nanoparticle is denoted as the “inner leaflet”, and the opposite as the “outer leaflet”. (B) Schematic diagram of the two leaflets of the membrane bending. | |
Table 2 Transbilayer distribution of cholesterol
|
Position |
H ≈ 2/R |
H > 0 |
H ≤ 0 |
CH/DPPC |
Inner |
23/75 |
89/350 |
730/3319 |
Outer |
26/185 |
80/390 |
781/3169 |
Mole fraction |
Inner |
0.203 |
0.209 |
0.180 |
Outer |
0.123 |
0.170 |
0.198 |
Headgroup size |
Inner |
0.590 |
0.675 |
Outer |
0.845 |
0.652 |
Flip-flop |
Inner → outer |
13 |
95 |
Outer → inner |
27 |
75 |
To better clarify the redistribution behavior of cholesterol, a quantitative analysis should be helpful. From the above simulation results, we can get the following two points: first, low levels of cholesterol molecules locate themselves underneath the polar headgroups of phospholipids and only have a small effect on the primary area per phospholipid. Hence, in a narrow concentration range, we can think that the mutual interval of phospholipid molecules is unchanged upon adding a small quantity of cholesterol molecules. This gives the basis of treating the phospholipid molecules as background. Second, the interactions of cholesterol with the phospholipid molecules in the membrane is closely related to the size of the polar phospholipid headgroup (or the averaged mutual interval of phospholipids). Loose lipid packing always corresponds to favorable entropy but disadvantaged enthalpy, while dense lipid packing has the opposite role. For example, the area per lipid of the DPPE, DPPC and DOPC bilayers increases in sequence (see Fig. 2B), while the enthalpy of cholesterol in those bilayers increases in sequence (see Table 1). What’s more, we know that the enthalpy is closely related to direct intermolecular interactions. Combining the above two points, in a simple way, we can describe the interaction of cholesterol with the phospholipid molecules by a physical quantity ε, which denotes the averaged interaction felt by each cholesterol under the action of the neighboring background phospholipid molecules. Based on the area dependency of the enthalpy, we think that ε is also dependent on the area per phospholipid headgroup. In addition, when a membrane is curved, the volume for the two mutually independent monolayers are both incompressible, so, much different from the case of a stressed membrane, the entropy effect should be small, hence the enthalpy accounts for a major role. Then we can describe the behavior of the cholesterol in the two leaflets just as an ideal gas which is divided into two portions: one with external field ε1, volume V1 and number of cholesterol molecules N1, and the other with ε1, V2 and N2 correspondingly. ε is dependent on the size of the phospholipid headgroup s, which is related to the curvature as s = s0 (1 ± zH) approximation for the two leaflets separately. The total free energy of the two leaflets is expressed as F/kBT = N1ε1+ N2ε2−N1
ln(V1/N1) − N2 ln(V2/N2), we can get the number density ratio (inner/outer) in equilibrium:
Common curved membrane domain has a diameter of 100 nm to several µm. So the membrane curvature is low, we can consider that the volume (or the phospholipid density on the neutral surface) of the two leaflets is equal (V1 = V2 = V). Then the redistribution of cholesterol is completely determined by
and the equilibrium free energy is expressed as Fequil/kBT = N
ln
V − N
ln(eε1 + e−ε2), where N is the total number of cholesterol molecules. If we further suppose that the area-dependence relation of ε can be expanded in series: ε(s) = ε0 + α1(s − s0) + α2(s − s0)2 + …, we can get ε1(H) = ε0 + α1H and ε2(H) = ε0 − α1H by adopting the lowest approximation and using s = s0(1 ± zH) (take z as 1 nm). Here, ε0 is for the initial flat membrane. If a local flat membrane is curved into a bud with uniform curvature H (see Fig. 6A), the equilibrium free energy of cholesterol in the curved membrane and the flat membrane will have the difference:
So now we find that the redistribution of cholesterol can help decrease the free energy of the system.
 |
| Fig. 6 (A) Schematic diagram of a budding domain. (B) Reduced energy difference between budding of lo and ld domains as a function of curvature. | |
However, we know that a membrane resists elastic deformation, moreover, the membrane including cholesterol has a larger bending rigidity than the pure phospholipid membrane. Taking the membrane elastic property into account, we continue to consider the membrane deformation process. More explicitly, as shown in Fig. 6A, the lβ domain is surrounded by the bulk lα domain and it is curved into a bud under the action of line tension (interface energy between the lα and the lβ domain).51 The flat membrane domain’s area is πL2, if it forms a full bud, the bud will have radius
(4πR2 = πL2) and the maximum curvature
Number of cholesterol in the lβ domain is proportional to the membrane area:
where f and A denote separately the mole fraction of cholesterol and the area per lipid (including both phospholipid and cholesterol). In the meantime, the total bending energy of the domain is also proportional to the membrane area. So the membrane bending energy Eb and the free energy difference ΔF due to the redistribution of cholesterol can be written together as:52
Here κ denotes membrane’s bending modulus. The line tension energy is expressed as
where λ denotes the line tension. Then the total energy of system (Elβ) can be written as:
So we find that as the redistribution of cholesterol brings an energy decrease of the system, it can help the budding of the domain. If α1H is rather small, it seems even more clear, as the exponential function can be further expanded:
then,
It can be seen that the effective bending modulus decreases due to the redistribution of cholesterol, which is consistent with the results obtained using molecular theory.53 If higher order terms of the series ε(H) are considered, κeff will be also dependent on H or H2. It reminds us of the work done by Müller et al.,50 where they used a curvature dependent bending modulus: κeff = κ(1 − (dH)2). Other cases when α1H is not very small are discussed in the ESI.† Another interesting thing that deserves to be considered is related to the budding phenomenon of the liquid-order lo phase and liquid-disorder ld phase. Since the lo domain has a rather large bending modulus, it should be unfavorable for budding in most cases. But in certain experimental conditions, the budding of lo phase rather than ld phase is observed.54,55 Considering that the lo domain has more cholesterol than the ld domain, the redistribution of cholesterol in curved membrane should be more prominent, as the redistribution of cholesterol can help decrease the free energy of the system, it may help the budding of the lo domain. We can compare the energy difference of budding lo and ld domains:
(note that line tension energy Eλ is cancelled out). Considering a domain with L = 200 nm and taking representative values of the bending modulus and mole fraction of cholesterol for the two domains: κld = 15, fld = 0.1 and κld = 75, fld = 0.4. Area per lipid can be obtained from the molecular dynamics simulation: Alo = 0.423 and Ald = 0.574. Then the energy difference is drawn as the function of membrane curvature H (state with certain budding extent), which is shown in Fig. 6B. We can find that along with the enlargement of α1Hmax, the energy difference constantly decreases from a positive value to a negative value. So, generally, the ld domain is easier to curve, however, if α1H is large enough, the redistribution of cholesterol may make the budding of the lo phase more favorable than that of the ld phase. In addition, it should be noted that the redistribution of cholesterol will induce the change of mole fraction of cholesterol in each leaflet. In turn, the change of mole fraction of cholesterol will influence the phospholipid’s size. We have omitted this effect in the above discussion, but as the membrane curvature is low, the area change of phospholipid headgroup induced by membrane bending (s = s0(1 ± zH)) is small as well. So a careful analysis of this effect should be investigated, which is also presented in the additional discussion section in the ESI.† Overall, the discussion here is only preliminary, but still it shows that the redistribution of cholesterol upon the two leaflets of the membrane can help decrease the energy cost of membrane bending, and in certain conditions this mechanism may even make the more rigid membrane easier to be curved than the less rigid membrane.
IV. Conclusion
In the present paper, we have investigated the behavior of cholesterol in several representative membrane environments. It is found that different membrane lipid packing can change the thermodynamics properties of cholesterol in different membrane environments, which will in turn influence the inter- or intra-membrane distribution of cholesterol. In particular, we find that loose lipid packing always corresponds to favorable entropy but disadvantaged enthalpy, while dense lipid packing has the opposite role. Besides, we investigate the distribution of cholesterol in the two leaflets of curved membrane and point out that the redistribution of cholesterol can help decrease the energy cost of membrane bending. This work can help better understand the specific inter- or intra-membrane distribution behavior of cholesterol. In the meantime, it sheds some light on the potential implications of the redistribution of cholesterol.
Acknowledgements
This work is supported by the National Natural Science Foundation of China (No. 91027040) and the National Basic Research Program of China (No. 2012CB821500). We are grateful to the High Performance Computing Center (HPCC) of Nanjing University for doing the numerical calculations in this paper on its IBM Blade cluster system.
References
- G. van Meer, D. R. Voelker and G. W. Feigenson, Nat. Rev. Mol. Cell Biol., 2008, 9, 112 CrossRef CAS PubMed.
- E. Ikonen, Nat. Rev. Mol. Cell Biol., 2008, 9, 125 CrossRef CAS PubMed.
- K. Simon and E. Ikonen, Science, 2000, 290, 1721 CrossRef.
- F. R. Maxfield and A. K. Menon, Curr. Opin. Cell Biol., 2006, 18, 379 CrossRef CAS PubMed.
- F. R. Maxfield and I. Tabas, Nature, 2005, 438, 612 CrossRef CAS PubMed.
- P. Linsel-Nitschenke and A. R. Tall, Nat. Rev. Drug Discovery, 2005, 4, 193 CrossRef PubMed.
- E. Ikonen, Physiol. Rev., 2006, 86, 1237 CrossRef CAS PubMed.
- F. de Meyer and B. Smit, Proc. Natl. Acad. Sci. U. S. A., 2009, 106, 3654 CrossRef CAS PubMed.
- J. Pan, T. T. Mills, S. T. Nagel and J. Nagle, Phys. Rev. Lett., 2008, 100, 198103 CrossRef.
- N. Khatizadeh, S. Gupta, B. Farrell, W. E. Brownell and B. Anvari, Soft Matter, 2012, 8, 8350 RSC.
- M. E. Solmaz, S. Sankhagowit, R. Biswas, C. A. Mejia, M. L. Povinelli and N. Malmstadt, RSC Adv., 2013, 3, 16632 RSC.
- S. L. Veatch and S. L. Keller, Phys. Rev. Lett., 2002, 89, 268101 CrossRef.
- T. Baumgart, S. T. Hess and W. W. Webb, Nature, 2003, 425, 821 CrossRef CAS PubMed.
- R. Elliott, I. Szleifer and M. Schick, Phys. Rev. Lett., 2006, 96, 098101 CrossRef CAS.
- H. J. Risselada and S. J. Marrink, Proc. Natl. Acad. Sci. U. S. A., 2008, 105, 17367 CrossRef CAS PubMed.
- C. L. Armstrong, W. Haubler, T. Seydel, J. Katsaras and M. C. Rheinstadter, Soft Matter, 2014, 10, 2600 RSC.
- K. Simons and E. Ikonen, Nature, 1997, 387, 569 CrossRef CAS PubMed.
- K. John, J. Kubelt, P. Muller, D. Wustner and A. Herrmann, Biophys. J., 2002, 83, 1525 CrossRef CAS.
- T. L. Steck, J. Ye and Y. Lange, Biophys. J., 2002, 83, 2118 CrossRef CAS.
- W. F. D. Bennett, J. L. MacCallum, M. J. Hinner, S. J. Marrink and D. P. Tieleman, J. Am. Chem. Soc., 2009, 131, 12714 CrossRef CAS PubMed.
- G. Parisio, M. M. Sperotto and A. Ferraini, J. Am. Chem. Soc., 2012, 134, 12198 CrossRef CAS PubMed.
- S. J. Marrink, H. J. Risselada, S. Yefimov, D. P. Tieleman and A. H. de Vires, J. Phys. Chem. B, 2007, 111, 7812 CrossRef CAS PubMed.
- S. J. Marrink and D. P. Tieleman, Chem. Soc. Rev., 2013, 42, 6801 RSC.
- W. F. D. Bennett, J. L. MacCallum and D. P. Tieleman, J. Am. Chem. Soc., 2009, 131, 1972 CrossRef CAS PubMed.
- B. Roux, Comput. Phys. Commun., 1995, 91, 275 CrossRef CAS.
- J. L. MacCallum and D. P. Tieleman, J. Am. Chem. Soc., 2006, 128, 125 CrossRef CAS PubMed.
- K. Yang and Y. Q. Ma, Nat. Nanotechnol., 2010, 5, 579 CrossRef CAS PubMed.
- Z. L. Li, H. M. Ding and Y. Q. Ma, Soft Matter, 2013, 9, 1281 RSC.
- H. M. Ding, W. D. Tian and Y. Q. Ma, ACS Nano, 2012, 6, 1230 CrossRef CAS PubMed.
- H. M. Ding and Y. Q. Ma, Sci. Rep., 2013, 3, 2804 Search PubMed.
- S. J. Marrink, A. H. de Vries and A. E. Mark, J. Phys. Chem. B, 2004, 108, 750 CrossRef CAS.
- D. V. D. Spoel, E. Lindahl, B. Hess, G. Groenhof, A. E. Mark and H. J. C. Berendsen, J. Comput. Chem., 2005, 26, 1701 CrossRef PubMed.
- T. P. W. McMullen, R. N. A. H. Lewis and R. N. McElhaney, Curr. Opin. Colloid Interface Sci., 2004, 8, 459 CrossRef CAS PubMed.
- C. Hofsab, E. Lindahl and O. Edhoml, Biophys. J., 2003, 84, 2192 CrossRef.
- O. Edhoml and J. F. Nagel, Biophys. J., 2005, 89, 1827 CrossRef PubMed.
- J. Huang and G. W. Feigenson, Biophys. J., 1999, 76, 2142 CrossRef CAS.
- M. R. Ali, K. H. Cheng and J. Huang, Proc. Natl. Acad. Sci. U. S. A., 2007, 104, 5372 CrossRef CAS PubMed.
- A. Radhakrishnan and H. McConnel, Proc. Natl. Acad. Sci. U. S. A., 2005, 102, 1262 Search PubMed.
- P. Somerharju, J. A. Virtanen, K. H. Cheng and M. Hermansson, Biochim. Biophys. Acta, Biomembr., 2009, 1788, 12 CrossRef CAS PubMed.
- B. Cannon, A. Lewis, P. Somerharju, J. Virtanen, J. Huang and K. H. Cheng, J. Phys. Chem. B, 2010, 114, 10105 CrossRef CAS PubMed.
- R. J. Bruckner, S. S. Mansy, A. Ricardo, L. Mahadevan and J. W. Szostak, Biophys. J., 2009, 97, 3113 CrossRef CAS PubMed.
- U. Seifert, Adv. Phys., 1997, 46, 13 CrossRef CAS.
- P. B. S. Kumar, G. Gompper and R. Lipowsky, Phys. Rev. Lett., 2001, 86, 3911 CrossRef.
- M. Deserno, Phys. Rev. E: Stat., Nonlinear, Soft Matter Phys., 2004, 69, 031903 CrossRef.
- H. T. McMahon and J. L. Gallop, Nature, 2005, 438, 590 CrossRef CAS PubMed.
- I. Canton and G. Battaglia, Chem. Soc. Rev., 2012, 41, 2718 RSC.
- W. C. Wang, L. Yang and H. W. Huang, Biophys. J., 2007, 92, 2819 CrossRef CAS PubMed.
- H. Lee, H. R. Kim, R. G. Larson and J. C. Park, Macromolecules, 2012, 45, 7304 CrossRef CAS.
- S. O. Yesylevskyy and A. P. Demchenko, Eur. Biophys. J., 2012, 41, 1043 CrossRef CAS PubMed.
- H. J. Risselada, S. J. Marrink and M. Muller, Phys. Rev. Lett., 2011, 106, 148102 CrossRef.
- R. Lipowsky, J. Phys. II, 1992, 2, 1825 CrossRef CAS.
- W. Helfrich, Z. Naturforsch., C: Biochem., Biophys., Biol., Virol., 1973, 28, 693 CAS.
- M. J. Uline and I. Szleifer, Faraday Discuss., 2013, 161, 177 RSC.
- K. Bacia, P. Schwille and T. Kurzchalia, Proc. Natl. Acad. Sci. U. S. A., 2005, 102, 3272 CrossRef CAS PubMed.
- M. Yanagisawa, M. Imai and T. Taniguchi, Phys. Rev. Lett., 2008, 100, 148102 CrossRef.
Footnote |
† Electronic supplementary information (ESI) available. See DOI: 10.1039/c4ra08201j |
|
This journal is © The Royal Society of Chemistry 2014 |
Click here to see how this site uses Cookies. View our privacy policy here.