DOI:
10.1039/C4RA08157A
(Paper)
RSC Adv., 2014,
4, 46407-46417
Investigations on the membrane interactions of naringin and its complexes with copper and iron: implications for their cytotoxicity
Received
5th August 2014
, Accepted 10th September 2014
First published on 10th September 2014
Abstract
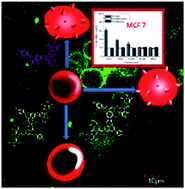
Flavonoid glycosides are a group of polyphenols with different glycoside substituents that possess diverse pharmacological activities albeit with lesser potency than their aglycone counterparts. Complexation with transition metal ions may alter their pharmacological activity, but this facet has remained unexplored thus far. Therefore, the present study aims to synthesize copper and iron complexes of naringin and investigate their nature of membrane interactions employing erythrocyte membrane models. An attempt to correlate their interaction and localization in the membrane with their cytotoxic effects was also made. Hypotonic hemolysis experiments carried out in the presence of naringin or its complexes with copper or iron reveals their different extent of penetration in to the membrane. Naringin and naringin–iron were found to preferentially interact with the membrane surface when compared with naringin–copper. The transformation of erythrocyte membrane from the normal discoidal shape to an echinocyte form induced by the addition of naringin, naringin–copper and naringin–iron complex suggests their interaction with the outer leaflet of the erythrocyte membrane. Naringin–copper exhibited the maximum tendency to alter the morphology of erythrocyte membranes. The copper and iron complexes of naringin exhibit superior cytotoxicity against MCF-7 cancer cells that can be a manifestation of their degree of perturbation of the membrane architecture as well as different levels of activation of various molecular targets.
1. Introduction
Flavonoids are a group of polyphenolic compounds ubiquitously distributed in the plant kingdom that have been consumed as part of the human diet.1,2 Structural variations exist in the flavonoids due to differences in the nature and position of the substituents linked to the flavonoid framework.2 More than 5000 different types of flavonoids have been identified to possess diverse biological activities of therapeutic value such as anti-cancer, anti-diabetic, hepatoprotective, anti-inflammatory, estrogenic, anti-atherosclerotic and anti-viral.2 Flavonoid glycosides predominantly found in natural foods are a major class of flavonoids.3 Based on the position, number and type of carbohydrate attached to the flavonoid core ring, flavonoid glycosides can be categorized in to different groups.4 Several reports indicated that flavonoid glycosides have less ability to permeate the cell membranes and consequently possess poor biological activities in comparison to their parent flavonoid.2,5 Several reports have highlighted that flavonoid glycosides possess significant pharmacological activities. Some of the flavonoid glycosides such as diosmin, rutin, naringin and hesperidin have been demonstrated to possess anti-cancer, anti-diabetic, anti-inflammatory and CNS depressant activities.5–10 Flavonoid glycosides such as myricitrin and hesperidin have been reported to possess antinociceptive activities.11 Essentially, glycosylation in the flavonoids alters the chemical and physical properties of the flavonoid.4,11 It also influences the in vivo bioavailability and pharmacological activities of flavonoids.11,12
Among the different flavonoid glycosides, naringin (4′,5,7-trihydroxy flavanone-7-rhamnoside) is present abundantly in orange fruit and has been found to possess different pharmacological actions such as cytotoxicity against breast cancer, anti-oxidant, free radical scavenging, anti-atherosclerosis, anti-mutagenic and anti-inflammatory effects.13 However, the pharmacological activities of naringin is less when compared to its aglycone naringenin.3 Reasons have been put forth to explain the difference in biological activities between the aglycone and its glycoside derivatives.2,4
A key factor is the structural differences between the aglycone and its glycoside derivative. It has been suggested that the glycosylation in the position 7 of the flavonoid framework results in better pharmacological activity when compared with glycosylation at the position 3.4,11 Similarly, the rhamnoside substitution in flavonoids has been found to impart better biological activities in comparison with glucoside glycosylation.11 Several reports have indicated that flavonoid glycosides possess poor intestinal absorptivity than the aglycones because of their bigger size.4
Another important aspect that influences the biological activities of the flavonoids is their interactions with the biological membrane. Non-planar structures display lesser interaction with membrane components than planar structures.14–16 Hydrophobicity and hydrogen bonding ability of the flavonoids also influence their interactions as well as localization in the membrane.12 The magnitude of the membrane permeation by the flavonoids and their influence on the membrane fluidity are also key factors that determine their biological activities.16 Surprisingly, though the significance of membrane interactions have been recognized, research in this direction is still in its infancy. A scan of literature reveals few reports on the membrane interactions of some flavonoids. The flavanone naringenin, flavanone glycoside, rutin and certain isoflavones have been found to permeate the hydrophobic core in liposome vesicles thereby altering membrane fluidity.17,18 Chrysin and fisetin have been demonstrated to penetrate deep in the erythrocyte membrane and thereby prevent hypotonic stress induced osmotic cell damage.19,20 The flavanone such as aglycones, hesperitin and naringenin have been observed to reduce the phase transition temperature for dipalmitoyl phosphatidyl choline (DPPC) liposomes that has been attributed to their ability to penetrate deeper in to the lipid bilayer thereby reducing their free radical scavenging ability.12,18,21 No reports exist on the nature of membrane interactions of naringin thus far.
Flavonoids are good metal chelating agents and it has been found that flavonoid–metal ion complexes exhibit significant pharmacological activities distinct from parent flavonoids.22 This may be attributed to their ability to confer more planarity.23 Complexes of myricetin, quercetin and rutin with Fe(II), Cu(II), Zn(III) and Al(III) possess better anti-oxidant activity anti-bacterial activity than their parent flavonoids.24–26 Quercetin–lanthanum,27 hesperetin–copper,28 naringenin–copper28 and naringin–copper23 complexes have been reported to possess superior anti-cancer activity than their parent flavonoids. The improvement in the biological activities of flavonoids on complexation may be due to their ability to alter membrane fluidity and permeability. A recent report has highlighted the ability of chrysin–copper complex to enhance bilayer fluidity in comparison to its parent flavonoid.19 However, membrane interaction studies on flavonoid–metal ion complexes are very few and no attempts have been made to correlate their biological activities with their membrane interactions thus far. The present work aims to understand the mode of interaction of a very less explored flavonoid glycoside, naringin, and its complexes with copper and iron, with the cell membrane using erythrocyte as membrane mimic. The anti-cancer potential of the three molecules will be evaluated using MCF-7 cells and normal mouse fibroblast cells.
2. Materials & methods
2.1 Materials
Naringin (97%, Sigma-Aldrich, USA) and copper(II) acetate and iron(II) sulfate (Merck, India) were used for the synthesis for naringin–copper complex and naringin–iron complex synthesis. Methanol (Merck, India) was used as a solvent. Potassium chloride (Merck, India), n-decane and dimethyl sulphoxide (Merck, Germany) were used for the bilayer studies. Tris–HCl buffer (pH 7.4) and sodium chloride (Merck, India) was used for hypotonic hemolysis studies. Phosphate buffered saline (PBS), glutaraldehyde, sodium chloride, magnesium chloride, Tween 20, Triton X100, sodium azide (Merck, India), phalloidin–rhodamine and fetal bovine serum (FBS) (Invitrogen, India) were used for erythrocyte membrane destabilization studies. DMEM medium (Invitrogen, India) was used for culture of MCF-7 cells and 3T3 cells. MCF-7 and 3T3 cells were procured from NCCS, Pune.
2.2 Synthesis and characterization of copper and iron complexes of naringin
Naringin (1 mM) was dissolved in 50 mL of methanol, mixed with 0.199 g of copper(II) acetate in 25 mL of double distilled water and stirred for 6 h at room temperature. The pale green insoluble precipitate obtained was vacuum-dried, washed repeatedly with water and methanol to remove the excess copper acetate and naringin. The product was then air-dried. Similarly, naringin–iron complex was prepared by dissolving 1 mM of naringin in 50 mL of methanol followed by mixing with 0.151 g of iron(II) sulfate in 25 mL of distilled water. The mixture was stirred for 6 h at room temperature. The greenish-black precipitate obtained was vacuum dried and characterized.
The carbon and hydrogen in the complex were analyzed using CHNS analyzer (Elementar Vario EL III, Germany). Copper and iron in the complexes were estimated by atomic absorption spectrometry (AAnalyst 400/HGA 900/AS 800, Perkin Elmer, USA). The complexation of copper ion with naringin was confirmed using EPR Spectroscopy (Electron Paramagnetic Resonance Spectroscopy) (EMXPlus, Bruker, Germany). Infrared spectra of naringin and its complexes were recorded using Fourier transform infra-red spectrometer (Spectrum 100, Perkin Elmer, USA) and UV-visible spectra were recorded on a UV-Vis spectrophotometer (Lambda 25, Perkin Elmer, USA) using dimethyl sulphoxide (DMSO) as solvent. The oxidation state of iron in the complexes was determined using X-ray photoelectron spectroscopy (XPS, K-alpha, ThermoFisher, UK).
2.3 Hypotonic hemolysis assay
Blood (1 mL) of a healthy volunteer was collected and transferred to 1 mM sodium citrate solution to prevent coagulation. The solution was centrifuged at 3000 rpm for 15 minutes to obtain packed red blood cells. The supernatant was removed and the pellet was washed with PBS (pH 7.4) thrice and then made up to a final volume of 3.5 mL with PBS to obtain working solution. Hemolysis of the washed red blood cells was performed using 500 μL of 0.2% sodium chloride solution (negative control). Different concentrations of (20–100 μM) naringin/naringin–copper/naringin–iron complex were added to 3.5 mL working solution in the presence of 500 μL of 0.2% sodium chloride solution (negative control), incubated at room temperature for 45 minutes, the cells removed by centrifugation at 3000 rpm for 10 minutes and the supernatant containing the released hemoglobin was measured at 560 nm using UV-visible spectrophotometry.19
2.4 Erythrocyte membrane interaction studies
Blood (0.5 mL) from a healthy volunteer was collected in 0.5 mL of 0.1 M EDTA solution. The erythrocytes were separated at 1000 rpm in a refrigerated centrifuge and washed with PBS thrice to remove proteins and other cells. The cells were then serially diluted with 500 μL PBS and incubated with 20–100 μM of naringin or its copper or iron complex. The cells were incubated at 37 °C for an hour, fixed with 2% (v/v) glutaraldehyde in 400 μL of distilled water and stored at 4 °C for 20 hours. The glutaraldehyde was removed by centrifugation at 1000 rpm. Finally, the cells were transferred to a brass stub and coated with platinum for imaging using a cold field emission scanning electron microscope (JSM 6701F, JEOL, Japan).29
2.5 Cytoskeleton staining
Immunostaining was performed to understand the cytoskeleton changes, which can be viewed using confocal microscopy (FV 1000, Olympus, Japan). The erythrocyte suspensions were prepared according to the procedure described in literature.29 The cells were incubated with 100 μM of naringin/naringin–copper/naringin–iron complex for one hour followed by removal of PBS. Then, the erythrocytes were fixed with 2.5% glutaraldehyde for half an hour and then the glutaraldehyde was removed using centrifugation at 1000 rpm for 10 minutes. Afterwards, the cells were incubated with cytoskeleton buffer (5 mM NaCl, 150 mM MgCl2, 0.5 mM Tris base, and 0.5% Triton X-100 in PBS solution) for 10 minutes and incubated with blocking buffer (5% FBS, 0.1% Tween-20, and 0.02% sodium azide in PBS) for 30 minutes at 37 °C followed by removal of the blocking buffer. Finally, the erythrocytes were incubated with rhodamine–phalloidin (1
:
200) (Invitrogen, USA) for 1 h at 37 °C and visualized using confocal microscope (FV1000, Olympus, Japan).
2.6 Cell viability assay
The viability of MCF-7 breast cancer cells was also evaluated in the presence of different concentrations (20–100 μM) of naringin or naringin–copper or naringin–iron complex. 1000 cells were seeded in 96 well plates with 175 μL of DMEM medium and incubated at 37 °C in 5% CO2 for 24 h. The cells were treated with different concentrations of naringin, naringin–copper or naringin–iron and incubated for 48 h in a humidified chamber. Then, the cell viability was assessed using MTS assay procedure.
2.7 Statistical analysis
Cell viability and hypotonic hemolysis data were expressed as mean ± standard deviation (n = 5). Comparison between means were performed using one-way ANOVA followed by Tukey test at 95% confidence interval (p < 0.05).
3. Results
3.1 Characterization of naringin copper and iron complex
The pale yellow naringin was transformed in to a green product on complexation with copper30 and in to a brown product on reaction with ferrous sulfate. Fig. 1 shows the UV-visible spectra for naringin and its copper and iron complexes in DMSO. The spectrum for naringin reveals the presence of an intense band at 286 nm (Band II) and another band at 327 nm (Band I), which are characteristic for flavonoids.19 The shift in band II and band I in the presence of different metal ions indicate their coordination with flavonoid core ring. The shift in band II indicates the coordination of metal ions with glycoside –OH groups and the shift in band I indicates the involvement 4-keto group of flavonoids in the coordination. The naringin–copper complex exhibits a shift in band I to 344 nm while it is shifted to 331 nm in the case of naringin–iron complex. This confirms the coordination of the metal ions with naringin.31–34 A weak d–d transition band appears at 644 nm in the case of naringin–copper corresponding to the wave number 15
528 cm−1, which indicates that the electron transition occurs from the dx2−y2 to dxy orbital and this transition is characteristic of square planar complexes.19
 |
| Fig. 1 UV-visible spectra for naringin and its metal ion complexes. | |
Table 1 shows the FTIR vibrational frequencies for the groups present in naringin, naringin–copper and naringin–iron complex. The vibration band for –OH that appears at 3856 cm−1 for naringin is shifted to 3400 cm−1 in the case of naringin–iron complex. This indicates the presence of coordinated water in the naringin–iron complex. This shift is absent in the naringin–copper complex. The vibration stretching for –C
O of naringin at 1654 cm−1 is shifted to 1614 cm−1 in naringin–copper and 1644 cm−1 in naringin–iron. This may be attributed to the coordination of the metal ions with the 4-keto group of naringin.
Table 1 Vibration frequencies for naringin and its metal ion complexes
Compound |
Vibration frequencies (cm−1) |
N(C O) |
ν(OH) |
ν(C C) |
ν(C–O–C) |
Naringin |
1654 |
3856 |
1540 |
1357 |
Naringin–copper |
1614 |
3854 |
1504 |
1350 |
Naringin–iron |
1644 |
3400 |
1518 |
1362 |
Table 2 shows the elemental composition of naringin and its copper and iron complexes. The theoretical values for the carbon, hydrogen and metal ions were calculated assuming a metal to ligand ratio of 1
:
2 in the case of copper complex while the iron complex was assumed to contain 1
:
2
:
2 ratio of metal
:
ligand
:
water. A good agreement was observed between the experimental and calculated values. The amount of copper in naringin–copper complex determined using atomic absorption spectrometry was 5.58%, which was close to the calculated value of 5.18% for a ML2 complex. In the case of naringin–iron complex, the quantity of iron in the complex was estimated as 4.75% that is in agreement with the calculated value of 4.69% for a ML2·2H2O complex.
Table 2 Elemental analysis data for naringin and its metal ion complexes
Compound |
Color |
Elemental analysis (%) |
Experimental |
Calculated |
C |
H |
Cu |
Fe |
C |
H |
Cua |
Feb |
Assuming ML2 complex. Assuming ML2·2H2O. |
Naringin |
Pale yellow |
54.18 |
5.81 |
— |
— |
55.81 |
5.51 |
— |
— |
Naringin–copper |
Green |
53.12 |
5.54 |
5.58 |
— |
52.91 |
5.23 |
5.18 |
— |
Naringin–iron |
Brown |
53.57 |
5.78 |
— |
4.75 |
51.51 |
5.42 |
— |
4.69 |
Fig. 2 shows the EPR spectrum for naringin–copper complex measured in the solid state at room temperature. The absence of multiplets in the EPR spectrum confirms the absence of copper acetate in the sample. The singlet obtained for the sample has values of 2.017 and 2.117 for g╧ and g‖ respectively. The g‖ value is greater than g╧ and both values are greater than 2 indicating that the unpaired electron in the Cu(II) ion present in the dx2−y2 orbital, which is typical for a square planar complex. The gav value for the naringin–copper complex is 2.05, which is slightly higher than the g value for the free electron suggesting a covalent character for the complex.
 |
| Fig. 2 EPR spectrum for naringin–copper complex. | |
Fig. 3 shows the XPS spectrum of iron in the naringin–iron complex. The survey scan shows the presence of carbon, oxygen and iron in the sample (data not shown). The XPS spectrum of iron shows the main Fe2p3/2 peak at 712.07 eV and a satellite peak appears at 725.1 eV. The presence of the shake-up satellite peak is characteristic of high spin complexes. The energy difference between the satellite and main peaks is 13.03 eV, which is higher than that for FeSO4. This shift is a due to the complexation of the iron with the flavonoid ligands.
 |
| Fig. 3 XPS spectrum of iron in naringin–iron complex. | |
From the spectral data, the structure of copper30 and iron complexes of naringin has been assigned a square planar and octahedral geometry as shown in Fig. 4.
 |
| Fig. 4 Proposed structure of naringin–copper (A) and naringin–iron complex (B). | |
3.2 Hypotonic hemolysis assay
Fig. 5 shows the protective effects of different concentrations (20–100 μM) of naringin, naringin–copper and naringin–iron complex against osmotic shock-induced RBC damage. It is evident that naringin exhibits no significant dose-dependent change in its membrane stabilization effects. The average membrane stabilization values obtained for naringin ranged from 40 to 55%. The naringin–copper complex exhibited a gradual increase in its ability to protect the erythrocyte membrane against hypotonic hemolysis until 60 μM beyond which no further improvement in the protection effect is observed and the value stabilizes around 70%. The naringin–iron complex, on the other hand, exhibits excellent membrane protection effect at all the concentrations tested when compared to naringin and naringin–copper complex (p < 0.05). The membrane stabilization values for the naringin–iron complex remain nearly invariant around 90%.
 |
| Fig. 5 Percentage inhibition of hypotonic hemolysis in the presence of different concentrations naringin and its copper and iron complex. Values are expressed as mean ± S.D. (a = p < 0.05). | |
3.3 Effect of different concentrations of naringin, naringin–copper and naringin–iron complex on RBC morphology
Fig. 6 shows the scanning electron micrographs of erythrocytes incubated with different concentrations of naringin, naringin–copper or naringin–iron complex. A majority of the cells treated with naringin retained their normal discoid morphology even up to concentration of 100 μM. A few stomatocytes, elliptocytes and echinocytes were also observed. In contrast, the erythrocytes treated with naringin–copper complex displayed a dose-dependent increase in echinocytes. A few elliptocytes were also observed at 20 μM. At 100 μM concentration of naringin–copper, a nearly complete transformation to echinocyte morphology was observed. The erythrocytes treated with naringin–iron complex retained their discoid morphology in most cases. A few stomatocytes, elliptocytes and echinocytes were also observed similar to those observed for the parent flavonoid.
 |
| Fig. 6 Effect of different concentrations naringin, naringin–copper and naringin–iron complex on RBC morphology (E – echinocyte, St – stomatocyte, O – ovalocyte, A – acanthocyte, SE – spheroechinocyte). | |
3.4 Localization of flavonoids and their metal ion complexes on the RBC membrane
The influence of flavonoids and their metal ion complexes on hypotonic hemolysis and erythrocyte morphology suggested that these molecules could penetrate in to the cell membrane. This aspect could be confirmed if these molecules could be visualized in an intracellular milieu. Several flavonoids such as quercetin and rutin have been reported to exhibit intrinsic fluorescence.35 Therefore, it is expected that other flavonoids also may exhibit intrinsic fluorescence, as they possess the flavonoid framework that could be used to probe their cellular localization. Hence, red blood cells (RBC) incubated with 100 μM of the flavonoid or its metal ion complexes were imaged using laser scanning confocal microscopy to confirm its entry into the cells. Fig. 7 shows the confocal images of RBCs treated with 100 μM of naringin, naringin–copper or naringin–iron complex. It was observed that naringin does not exhibit highly intense fluorescence. However, its complexes show higher emission intensities. All three molecules seem to be localized only at the periphery of the erythrocytes and co-localize with the erythrocyte cytoskeleton.
 |
| Fig. 7 Confocal micrographs of RBC in the presence of 100 μM naringin and its copper and iron complex; white arrows indicate abnormal morphologies. | |
3.5 Cytotoxicity assay
Fig. 8 shows the influence of different concentrations (20–100 μM) of naringin, naringin–copper and naringin–iron complex on the viability of MCF-7 cells. It was observed that all three molecules, especially the complexes do not dramatically decrease the viability of 3T3 cells (data not shown). A dose-dependent decrease in the viability of cancer cells was observed for naringin compared to its copper and iron complexes. However, copper and iron complexes of naringin exhibited significant toxicity towards cancer cells even at 20 μM concentration when compared with naringin (p < 0.05).
 |
| Fig. 8 Influence of different concentrations (20–100 μM) of naringin, naringin–copper and naringin–iron complex on the viability of MCF7 cells. Values are expressed as percentage of cells viable compared to control and represented as mean ± S.D. (n = 4, a – p < 0.05). | |
4. Discussion
The interaction of flavonoids with biological membranes depends on the polarity and hydroxyl group positions in the flavonoid core ring.36–38 However, the exact mechanism of action of flavonoids on cell membranes is yet to be completely understood. The molecular level interactions of the flavonoids at the membrane interface could manifest itself as changes in the fluidity of the membrane, which in turn could alter the cell functions.37–46 Similarly the interaction of the flavonoid–metal ion complex at the membrane interface could provide valuable insights into the probable role of these molecules in alleviating or deteriorating cellular functions. Some reports have attempted to correlate the hydrophobicity and planarity of molecules with their membrane interactions. Previous reports have indicated that lipophilicity of flavonoids directly correlate with their cellular uptake except in the case of myricetin.47,48 The absence of a double bond between C2 and C3 in the flavonoid aglycone naringenin leading to a reduction in its planarity has been attributed to its poor interactions with cell membranes.47,49 However, its glycoside, naringin, has been reported to exhibit relatively better interactions with the membrane despite the fact that it is not very planar. Thus, it is evident that more than one factor may influence the extent of membrane interactions of flavonoids. The magnitude of interaction of flavonoids with the lipid bilayer of membranes can be influenced by their molecular size, planarity, hydrophobicity, position and number of hydroxyl groups, concentration as well as their ability to alter the membrane curvature and lipid packing density.18 Similar factors may also be involved in determining the membrane interactions of the flavonoid–metal ion complexes. In this context, the present work is aimed to evaluate the mode of membrane interaction of flavonoid rhamnoside, naringin and its copper and iron complex in a dose dependent manner. Red blood corpuscles (RBC) act as the biological membrane model to understand the mode of interaction of pharmacological important organic compounds.50 The results of hypotonic hemolysis experiments suggest that naringin and its copper and iron complexes offer varying degrees of protection to the erythrocyte membrane exposed to osmotic stress (Fig. 5). The erythrocyte membrane stabilization against hypotonic stress is generally due to the ability of a molecule to expand the membrane. A minimization of the elastic energy of the bilayer that comprises of the bending energy, shear elastic energy and stretching energy, also accompanies the stabilization process.51,52 Thus, greater stabilization against hypotonic hemolysis implies penetration of the flavonoid in to the membrane bilayer. Modification of the membrane fluidity by the molecules leading to rearrangement of the lipids and proteins can also alter the elastic energy of the erythrocyte membrane.52 The membrane stabilizing ability of three compounds order is:
The higher hydrophobicity of naringin when compared to its copper and iron complexes is expected to contribute to its better membrane penetration. However, the absence of C2–C3 double bond in naringin makes it more non-planar thereby restricting its penetration in to the erythrocyte membrane. The confinement of its interactions to the surface may result in perturbing the membrane architecture leading to enhancement of the membrane fluidity thereby resulting in lesser membrane protection ability of naringin when compared to naringin–copper and naringin–iron complex (Fig. 5). Earlier reports have suggested that quercetin and its derivatives can penetrate the lipid bilayer membranes though the exact reasons of this phenomenon have not been established.14,53,54 The extent of penetration of a flavonoid in to the membrane is dependent on its concentration as well as the nature of associative interactions with the membrane components. It is likely that the hydroxyl groups of the flavonoids can associate with polar groups on the membrane through hydrogen bonding. This may serve to anchor the molecule on the surface. Based on the orientation of the molecule, the hydrophobic and planar segments can penetrate in to the membrane. Such penetrations can alter the dimensions of the membrane or the packing of the membrane components. If the interactions lead to increased order in the packing of lipids, the membrane tends to rigidify and if the interactions lead to decreased packing order, the membrane tends to fluidize. Our results have demonstrated that naringin, naringin–copper and naringin–iron complex show dose dependent prevention on hemolysis against hypotonic stress (Fig. 5). Among the three, naringin–iron complex show better membrane stabilization effects in all the concentrations tested when compared to naringin and naringin–copper complex. This indicates a strong surface interaction and membrane rigidifying effect caused by naringin–iron complex thereby preventing hypotonic hemolysis. Such observations have been reported earlier for the prevention of hypotonic hemolysis by fisetin and chrysin.20 The reduced magnitude of membrane stabilization by naringin–copper and naringin may be attributed to the tendency of these molecules to fluidize the membrane.
The morphology of a normal erythrocyte is biconcave and discoid and is generally referred to as normocytes or discocytes.55 According to the bilayer couple hypothesis, the difference in area between the outer and inner leaflets of the erythrocyte membranes is manifested through a morphology change that is characteristic of the location of the interacting molecule.50 If the molecule localizes in the outer leaflet of the membrane, it bulges outward and this change in curvature appears as projections on the membrane surface. The number of molecules penetrating into the outer leaflet determines the diameter, height and density of these projections or spicules. Thus, if the number of molecules intercalating in the outer leaflet increases, the height and thickness of the spicules decreases.
The term ‘echinocytes’ is used to describe cells with spicules that are regularly spaced and uniformly distributed.55 If the spacing between the spicules is random and irregular, then the cells are known as ‘acanthocytes’.55,56 Change in the morphology of the erythrocytes to an oval or elliptical form results in formation of ‘ovalocytes’ or ‘elliptocytes’. Such structures are generally associated with changes in the cytoskeletal network of the erythrocyte membrane.55 It is now recognized that the interactions and coupling between phospholipid bilayers and the spectrin network govern the mechanical stability of erythrocytes.57–59 Any alteration in the membrane architecture due to the interaction of drugs therefore may lead to the disorganization of spectrin filaments. Earlier reports have suggested that protein 4.1 is closely associated with the other erythrocyte skeletal proteins spectrin, actin and band 3, which have a major contribution towards maintenance of the erythrocyte structural integrity.59,60 The surface interaction of quercetin on erythrocyte membrane has been reported to alter the normal biconcave discoid morphology in echinocytes that has been attributed to their non-specific interaction with lipid components thereby influencing protein–protein interactions.56 In the present study, all three molecules were found to alter the biconcave shape of RBC membrane in to predominantly echinocytes and elliptocytes indicating that they are majorly accumulated in the outer leaflet of the erythrocyte membrane (Fig. 6). This finding is also concurrent with the localization of naringin and its copper and iron complexes using confocal laser microscopy (Fig. 7). The maximum transformation of the erythrocytes to the echinocytes is observed on addition of naringin–copper suggesting a greater tendency to localize in the outer leaflet of the membrane bilayer. A few stomatocytes are observed in the case of naringin–iron indicating that it can also perturb the acyl chains to localize in the inner leaflet. The distribution of elliptocytes is also observed in the case of naringin–iron indicating a change in the cytoskeletal components of the erythrocytes.
The anti-cancer property of flavonoids and their metal ion complexes may also be influenced by their ability to fluidize the membrane and thereby alter the membrane permeability. Several reports have indicated that flavonoid–metal ion complexes have better anti-cancer activities than their parent flavonoid though the mechanism has not been clearly identified.22 In the present study, both naringin–copper and naringin–iron complexes exhibited better anti-cancer activity against MCF-7 breast cancer cells when compared with their parent flavonoid. Interestingly, all the three molecules exhibited toxicity against the normal 3T3 cells only at very high concentrations. This difference in the cytotoxic effects may arise due to differences in the membrane fluidity of normal cells and cancer cells. It has been recognized that cancer cells generally have more fluid membranes to aid permeation of nutrients when compared with normal cells.14,18,54 As naringin–iron tends to rigidify the membrane, it alters the membrane permeability in cancer cells resulting in the higher extent of cytotoxicity. However, as the membrane fluidity of normal cells is less, their interaction with the membrane rigidifying naringin–iron does not result in very high cytotoxicity in normal cells. A similar trend is exhibited by naringin–copper. These results are concurrent with the earlier reports on the cytotoxicity of quercetin that has been attributed to its ability to reduce the bilayer fluidity.45 In contrast, naringin that tends to enhance the membrane fluidity does not cause much toxicity towards cancer cells while it is more detrimental to normal cells when compared with its complexes.
The membrane fluidity is an important parameter that is tightly regulated in biological systems as it affects the membrane permeability of molecules. Alteration in membrane fluidity either through reduction in the fluidity (rigidification) or enhancing the fluidity (fluidization) both result in changes in the influx and efflux properties of the membrane. There are reports on cytotoxicity arising due to enhanced membrane fluidity61 as well as enhanced membrane rigidity.45 In the present study, we can infer that naringin–iron exhibits cytotoxicity due to its ability to enhance membrane rigidity while naringin–copper exhibits cytotoxicity due to its ability to increase membrane fluidity against MCF 7 cells. However, the ability to increase membrane rigidity was found to contribute to greater cytotoxicity towards cancer cells when compared to normal cells.
5. Conclusion
Complexes of naringin with copper and iron were successfully synthesized and characterized. Their membrane interactions were found to be distinct owing to differences in their planarity and interactions at the membrane surface. While naringin exhibited a greater tendency to enhance membrane fluidity, its complexes exhibited a tendency to increase the membrane rigidity. As a result, the complexes displayed greater toxicity towards cancer cells than naringin. The magnitude and nature of alteration in the membrane fluidity could in turn alter the membrane-mediated signaling cascades in cells treated with these molecules. This work could be extended to investigate the membrane interactions of other flavonoid–metal ion complexes employing erythrocytes as membrane mimics and to predict the possible mechanism of their toxicity.
Acknowledgements
The authors wish to acknowledge the financial support from the Department of Science & Technology, Government of India under the grant SR/SO/BB-35/2004 and the infrastructural support from SASTRA University.
References
- C. Brunetti, M. Di Ferdinando, A. Fini, S. Pollastri and M. Tattini, Int. J. Mol. Sci., 2013, 14, 3540–3555 CrossRef CAS PubMed.
- B. H. Havsteen, Pharmacol. Ther., 2002, 96, 67–202 CrossRef CAS.
- M. Cavia-Saiz, M. D. Busto, M. C. Pilar-Izquierdo, N. Ortega, M. Perez-Mateos and P. Muniz, J. Sci. Food Agric., 2010, 90, 1238–1244 CrossRef CAS PubMed.
- V. Kren and L. Martinkova, Curr. Med. Chem., 2001, 8, 1303–1328 CrossRef CAS.
- D. Cova, L. De Angelis, F. Giavarini, G. Palladini and R. Perego, Int. J. Clin. Pharmacol., Ther. Toxicol., 1992, 30, 29–33 CAS.
- S. P. Fernandez, C. Wasowski, L. M. Loscalzo, R. E. Granger, G. A. Johnston, A. C. Paladini and M. Marder, Eur. J. Pharmacol., 2006, 539, 168–176 CrossRef CAS PubMed.
- M. E. Crespo, J. Galvez, T. Cruz, M. A. Ocete and A. Zarzuelo, Planta Med., 1999, 65, 651–653 CrossRef CAS PubMed.
- M. Yang, T. Tanaka, Y. Hirose, T. Deguchi, H. Mori and Y. Kawada, Int. J. Cancer, 1997, 73, 719–724 CrossRef CAS.
- E. Ramesh and A. A. Alshatwi, Food Chem. Toxicol., 2013, 51, 97–105 CrossRef CAS PubMed.
- N. Kamalakkannan and P. S. Prince, Basic Clin. Pharmacol. Toxicol., 2006, 98, 97–103 CrossRef CAS PubMed.
- S. P. Fernandez, M. Nguyen, T. T. Yow, C. Chu, G. A. Johnston, J. R. Hanrahan and M. Chebib, Neurochem. Res., 2009, 34, 1867–1875 CrossRef CAS PubMed.
- J. Londono-Londono, V. R. Lima, C. Jaramillo and T. Creczynski-Pasa, Arch. Biochem. Biophys., 2010, 499, 6–16 CrossRef CAS PubMed.
- K. Amudha and L. Pari, Chem.–Biol. Interact., 2011, 193, 57–64 CrossRef CAS PubMed.
- A. Lopez-Revuelta, J. I. Sanchez-Gallego, A. Hernandez-Hernandez, J. Sanchez-Yague and M. Llanillo, Chem.–Biol. Interact., 2006, 161, 79–91 CrossRef CAS PubMed.
- H. Tsuchiya, Food Chem., 2010, 120, 1089–1096 CrossRef CAS PubMed.
- N. Poklar Ulrih, A. Ota, M. Šentjurc, S. Kure and V. Abram, Food Chem., 2010, 121, 78–84 CrossRef CAS PubMed.
- B. Pawlikowska-Pawlega, L. E. Misiak, B. Zarzyka, R. Paduch, A. Gawron and W. I. Gruszecki, Biochim. Biophys. Acta, 2012, 1818, 1785–1793 CrossRef CAS PubMed.
- P. I. Oteiza, A. G. Erlejman, S. V. Verstraeten, C. L. Keen and C. G. Fraga, Clin. Dev. Immunol., 2005, 12, 19–25 CrossRef CAS.
- S. Selvaraj, S. Krishnaswamy, V. Devashya, S. Sethuraman and U. M. Krishnan, Langmuir, 2011, 27, 13374–13382 CrossRef CAS PubMed.
- S. Chaudhuri, A. Banerjee, K. Basu, B. Sengupta and P. K. Sengupta, Int. J. Biol. Macromol., 2007, 41, 42–48 CrossRef CAS PubMed.
- L. Movileanu, I. Neagoe and M. L. Flonta, Int. J. Pharm., 2000, 205, 135–146 CrossRef CAS.
- S. Selvaraj, S. Krishnaswamy, V. Devashya, S. Sethuraman and U. M. Krishnan, Med. Res. Rev., 2013, 677–702 Search PubMed.
- R. M. Pereira, N. E. Andrades, N. Paulino, A. C. Sawaya, M. N. Eberlin, M. C. Marcucci, G. M. Favero, E. M. Novak and S. P. Bydlowski, Molecules, 2007, 12, 1352–1366 CrossRef CAS.
- R. F. de Souza and W. F. De Giovani, Redox Rep., 2004, 9, 97–104 CrossRef CAS PubMed.
- S. Sungur and A. Uzar, Spectrochim. Acta, Part A, 2008, 69, 225–229 CrossRef PubMed.
- A. Bravo and J. R. Anacona, Transition Met. Chem., 2001, 26, 20 CrossRef CAS.
- K. Durgo, I. Halec, I. Sola and J. Franekic, Arh. Hig. Rada Toksikol., 2011, 62, 221–227 CAS.
- M. Tan, J. Zhu, Y. Pan, Z. Chen, H. Liang, H. Liu and H. Wang, Bioinorg. Chem. Appl., 2009, 347872 Search PubMed.
- S. Selvaraj, S. Krishnaswamy, V. Devashya, S. Sethuraman and U. M. Krishnan, RSC Adv., 2012, 2, 11138 RSC.
- S. Madhurantakam, S. Selvaraj, N. Nesakumar, S. Sethuraman, J. B. Balaguru Rayappan and U. Maheswari Krishnan, Biosens. Bioelectron., 2014, 59, 134–139 CrossRef CAS PubMed.
- V. Uivarosi, S. F. Barbuceanu, V. Aldea, C. C. Arama, M. Badea, R. Olar and D. Marinescu, Molecules, 2010, 15, 1578–1589 CrossRef CAS PubMed.
- J. Pusz, B. Nitka, S. Kopacz and Y. I. Korenman, Russ. J. Gen. Chem., 2003, 73, 634–637 CrossRef CAS.
- A. Torreggiania, M. Tamba, A. Trinchero and S. Bonora, J. Mol. Struct., 2005, 744–747, 759–766 CrossRef PubMed.
- D. Malesev and V. Kunti, J. Serb. Chem. Soc., 2007, 72, 921–939 CrossRef CAS.
- G. Notas, A. P. Nifli, M. Kampa, V. Pelekanou, V. I. Alexaki, P. Theodoropoulos, J. Vercauteren and E. Castanas, J. Nutr. Biochem., 2012, 23, 656–666 CrossRef CAS PubMed.
- H. Tsuchiya, Food Chem., 2010, 120, 1089–1096 CrossRef CAS PubMed.
- A. Saija, M. Scalese, M. Lanza, D. Marzullo, F. Bonina and F. Castelli, Free Radical Biol. Med., 1995, 19, 481–486 CrossRef CAS.
- A. Saija, F. P. Bonina, D. Trombetta, A. Tomaino, L. Montenegro, P. Smeriglio and F. Castelli, Int. J. Pharm., 1995, 124, 1–8 CrossRef CAS.
- U. N. Poklar, A. Ota, M. Sentjurc, S. Kure and V. Abram, Food Chem., 2010, 121, 78–84 CrossRef PubMed.
- H. Tsuchiya and M. Nagayama, J. Biomed. Sci., 2008, 15, 653–660 CrossRef CAS PubMed.
- M. Sivonova, I. Waczulikova, E. Kilanczyk, M. Hrnciarova, M. Bryszewska, B. Klajnert and Z. Durackova, Gen. Physiol. Biophys., 2004, 23, 39–51 CAS.
- L. E. Cybulski, D. Albanesi, M. C. Mansilla, S. Altabe, P. S. Aguilar and D. de Mendoza, Mol. Microbiol., 2002, 45, 1379–1388 CrossRef CAS.
- H. A. Scheidt, A. Pampel, L. Nissler, R. Gebhardt and D. Huster, Biochim. Biophys. Acta, 2004, 1663, 97–107 CrossRef CAS PubMed.
- Y. S. Tarahovsky, E. N. Muzafarov and Y. A. Kim, Mol. Cell. Biochem., 2008, 314, 65–71 CrossRef CAS PubMed.
- H. Tsuchiya, M. Nagayama, T. Tanaka, M. Furusawa, M. Kashimata and H. Takeuchi, BioFactors, 2002, 16, 45–56 CrossRef CAS.
- S. V. Verstraeten, P. I. Oteiza and C. G. Fraga, Biol. Res., 2004, 37, 293–300 Search PubMed.
- A. B. Hendrich, Acta Pharmacol. Sin., 2006, 27, 27–40 CrossRef CAS PubMed.
- K. Kajiya, M. Ichiba, M. Kuwabara, S. Kumazawa and T. Nakayama, Biosci., Biotechnol., Biochem., 2001, 65, 1227–1229 CrossRef CAS PubMed.
- P. I. Oteiza, A. G. Erlejman, S. V. Verstraeten, C. L. Keen and C. G. Fraga, Clin. Dev. Immunol., 2005, 12, 19–25 CrossRef CAS.
- M. P. Sheetz and S. J. Singer, Proc. Natl. Acad. Sci. U. S. A., 1974, 71, 4457–4461 CrossRef CAS.
- B. Isomaa, H. Hagerstrand and G. Paatero, Biochim. Biophys. Acta, 1987, 899, 93–103 CrossRef CAS.
- A. Iglic, V. Kralj-Iglic and H. Hagerstrand, Eur. Biophys. J., 1998, 27, 335–339 CrossRef CAS.
- A. Arora, T. M. Byrem, M. G. Nair and G. M. Strasburg, Arch. Biochem. Biophys., 2000, 373, 102–109 CrossRef CAS PubMed.
- B. Pawlikowska-Pawlega, W. I. Gruszecki, L. Misiak, R. Paduch, T. Piersiak, B. Zarzyka, J. Pawelec and A. Gawron, Biochim. Biophys. Acta, 2007, 1768, 2195–2204 CrossRef CAS PubMed.
- M. Louise, Clinical Hematology: Theory and Procedures, Lippincott Williams & Wilkins, USA, 5th edn, 2011 Search PubMed.
- B. Pawlikowska-Pawlega, W. I. Gruszecki, L. E. Misiak and A. Gawron, Biochem. Pharmacol., 2003, 66, 605–612 CrossRef CAS.
- M. P. Sheetz, R. G. Painter and S. J. Singer, J. Cell Biol., 1976, 70, 193–203 CrossRef CAS.
- H. W. G. Lim, M. Wortis and R. Mukhopadhyay, Proc. Natl. Acad. Sci. U. S. A., 2002, 99, 16766–16769 CrossRef PubMed.
- K. Khairy, J. Foo and J. Howard, Cell. Mol. Bioeng., 2010, 1, 173–181 CrossRef PubMed.
- B. Agroyannis, A. Dalamangas, H. Tzanatos, C. Fourtounas, I. Kopelias, I. Konstadinidou and D. Koutsikos, Blood, 1994, 84, 1685–1686 CAS.
- L. T. Eliassen, G. Berge, A. Leknessund, M. Wikman, I. Lindin, C. Løkke, F. Ponthan, J. I. Johnsen, B. Sveinbjørnsson and P. Kogner, Int. J. Cancer, 2006, 119, 493–500 CrossRef CAS PubMed.
|
This journal is © The Royal Society of Chemistry 2014 |
Click here to see how this site uses Cookies. View our privacy policy here.