
Controllable multicolor output, white luminescence and cathodoluminescence properties of high quality NaCeF4:Ln3+ (Ln3+ = Eu3+, Dy3+, Tb3+) nanorods
Zhigao Yiab,
Wei Luc,
Tianmei Zenga,
Chao Qiana,
Haibo Wangab,
Ling Raoab,
Hongrong Liua and
Songjun Zeng*a
aCollege of Physics and Information Science, Key Laboratory of Low-dimensional Quantum Structures, Quantum Control of the Ministry of Education, Hunan Normal University, Changsha 410081, Hunan, China. E-mail: songjunz@hunnu.edu.cn
bSchool of Materials Science and Engineering, Key Laboratory of Low-dimensional Materials and Application Technology (Ministry of Education), Xiangtan University, Xiangtan 411105, People's Republic of China
cMaterials Research Center, Department of Applied Physics, The Hong Kong Polytechnic University, Hong Kong
First published on 11th September 2014
Abstract
Herein, a series of hexagonal phase lanthanide (Ln3+, Ln3+ = Eu3+, Dy3+, Tb3+) doped NaCeF4 nanorods (NRs) with uniform morphology and monodispersity have been successfully synthesized via a typical hydrothermal method using oleic acid as the capping agent. The crystal phase and microstructure of the obtained NRs were analyzed by X-ray diffraction (XRD) patterns and transmission electron microscopy (TEM). The down conversion (DC) luminescence properties and mechanisms of the as-prepared NaCeF4:Ln3+ NRs have been discussed in detail. The as-prepared samples show the characteristic f–f transition of Ln3+ (Ln3+ = Eu3+, Dy3+, Tb3+). The decay time and quantum yield of these obtained NRs are also studied. Moreover, tunable multicolor, especially white emissions, can be successfully achieved via varying the doping ions and doping concentration. By increasing the content of Eu3+, the emission colors vary from light green to white and finally to light red under the excitation of 395 nm. The calculated CIE coordinates of the obtained white emissions are (0.33, 0.31), which are very close to the standard white light located at (0.33, 0.33). This is the first time to demonstrate that white light emission is achieved via only singly-doping Eu3+ into the NaCeF4 system. In addition, the multicolor output changes from yellowish-green to yellow under the excitation at 261 nm, which was also obtained by only tuning the doped content of Dy3+ in the NaCeF4 host. As for Tb3+, bright yellowish green emissions were obtained under excitation at 261 nm. Moreover, the cathodoluminescence (CL) spectra demonstrate that these NRs can emerge as ideal nanophosphors under electron beam excitation. Therefore, the as-prepared NaCeF4:Ln3+ NRs with tunable multicolor output and bright white emissions might be applied in field-emission devices, multicolor displays and solid state lasers.
1. Introduction
In recent years, considerable attentions have been focused on the shape and size-controlled synthesis of Ln3+ doped nanocrystals1–18 because of their shape/size dependent properties and potential applications in optics, lasers, light emitting devices, and biological labeling/imaging. It is well known that the morphology and size of nanocrystals have great influence on their physical and chemical properties.19 Thus, the controlled fabrication of Ln3+-doped nanomaterials with desirable shapes and sizes is of great significance.Ln3+-doped nanocrystals exhibit excellent photoluminescence (PL) capabilities owing to two different energy transfer mechanisms, namely, the up conversion20–29 (UC) and DC30–40 processes. DC generation is the one that converts higher-energy irradiation to lower-energy photon emissions,1,2 while the UC process is the exact opposite. Among all the exploited Ln3+-doped nanocrystals, fluorides (NaLnF4), are considered as the most efficient lattice hosts. However, Ln3+-doped nanocrystals using NaCeF4 as the host matrix and high quality NaCeF4 nanocrystals with monodispersity are still rarely reported. In contrast to the well-established NaYF4 host, the NaCeF4 system we selected here can serve not only as the perfect host material but also as an activator, which makes it simpler to obtain the multicolor output and intense white emissions by singly doping Ln3+ in a system. Apart from the advantages of its PL properties, the price of cerium oxide, which is used as a raw material in our experiments, is quite reasonable compared to other oxides.41 As previously reported, the CeF3 and NaCeF4 nanocrystals were synthesized through the liquid–solid-solution approach by Li et al.,41 in which the focus was on the nucleation and growth of the nanocrystals and it did not reveal the effect of Ln3+ doping on their PL property. In addition, NaCeF4 nanoparticles with different shapes and sizes were obtained by using the solvothermal method via tuning the pH value and sodium concentration of the solution.36 However, the as-prepared NaCeF4 nanoparticles were irregular and not uniform. Recently, hexagonal phase NaCeF4 NRs were successfully fabricated via the polyol-mediated solvothermal route by Qu et al.37 The major work contributed to achieve the varied morphology and size of NaCeF4 nanocrystals by changing the additive content of NH4F and NaNO3. Therefore, it is important to develop a proper method and experimental parameters to achieve hexagonal phase NaCeF4 nanocrystals with a uniform shape and monodispersity. Moreover, the systematic study on the DC luminescence of the Ln3+-doped NaCeF4 nanocrystals is of significance. Many recent literatures30–33 have focused on phosphors, which were co-doped with Ce3+, Mn2+, Eu3+, Dy3+, and Tb3+ to obtain tunable multicolor emissions or even white light for applications in light emitting devices. The efficient and intense energy transfer from Ce3+ to Mn2+/Dy3+/Tb3+ in these phosphors has been systematically studied. However, white emissions obtained by singly doping Ln3+ into the hosts still remains a great challenge and there are few reports on Ln3+ doped NaCeF4 nanocrystals.
In this paper, high quality and monodispersed hexagonal phase NaCeF4 NRs doped with different contents of Ln3+ (Ln3+ = Eu3+, Dy3+, and Tb3+) were successfully prepared via a hydrothermal method. The crystal phase and microstructure of the as-prepared Ln3+ doped NaCeF4 NRs were characterized by XRD and TEM, respectively. The PL properties were recorded by the excitation and emission spectra and the corresponding energy transfer mechanisms are discussed in detail. Interestingly, the tunable multicolor and especially white emissions are obtained by only changing the content of single-doped ions in NaCeF4 host.
2. Experimental
2.1 Chemicals and materials
All the rare earth oxides (Sigma-Aldrich) were 99.99% of purity and the other chemicals (Sinopharm Chemical Reagent Co., China) were of analytical grade and used as received without further purification. Ln(NO3)3 (Ln = Ce3+, Eu3+, Dy3+, and Tb3+) solutions of 0.5 M were prepared via dissolving the corresponding rare earth oxides into dilute nitric acid.2.2 Synthesis of the high quality Ln3+-doped NaCeF4 NRs
High quality and monodispersed NaCeF4 NRs doped with different contents of Ln3+ were synthesized through a hydrothermal procedure by using oleic acid as the stabilizing agent.41–44 In a typical synthesis, 1.2 g of NaOH was dissolved in 2 mL of deionized water and then 10 mL of ethanol and 20 mL of oleic acid were added under vigorous stirring to obtain a transparent homogeneous solution. After stirring for 30 min, total amount (1 mmol) of Ln(NO3)3 (Ln = Ce3+, Eu3+, Dy3+, and Tb3+) with designed compositions were added into the aforementioned solution under vigorous agitation. After that, 6 mL of NaF aqueous solution (1 M) was added, and the resulting mixture was stirred vigorously for another 20 min. Finally, the obtained mixture was sealed and maintained at 190 °C for 24 h by transferring it into a 50 mL stainless Teflon-lined autoclave. The system was naturally cooled to room temperature after the reaction. The products were deposited at the bottom of the vessel. The as-prepared samples were separated by centrifugation and washed several times with ethanol and deionized water to remove oleic acid and other remnants, and then dried at 60 °C in air for 24 h.2.3 Characterization
The crystal phase compositions of the as-prepared NaCeF4 NRs doped with different contents of Dy3+ were examined by XRD utilizing a D/max-γA system X-ray diffractometer at 40 kV and 250 mA with Cu Kα radiation (λ = 1.54056 Å). The microstructures of the as-prepared samples were characterized by TEM, scanning TEM (STEM), selected area electron diffraction (SAED) patterns and high-resolution TEM (HR-TEM) via a JEM-2100F TEM equipped with an energy-dispersive X-ray spectroscopy (EDS) system using an accelerating voltage at 200 kV. The obtained samples for the TEM assays were prepared as follows: 0.1 mg of the as-prepared samples was dispersed in 1 mL of cyclohexane solvent to form a homogeneous colloidal mixture, and then one drop of the suspension was added on the TEM copper grid covered with a carbon film. The DC luminescence excitation/emission spectra and decay time profile were recorded by a Zolix Analytical Instrument (fluoroSENS 9000A). The decay time curves of the samples were recorded using the Zolix Analytical Instrument by monitoring the corresponding strongest excitation and emission wavelengths (excitation/emission bandpass: 8 mm, integrate time: 200 μs). The quantum yields of the Ln-doped NaCeF4 NRs were measured by the affiliated quantum yield measurement system of the spectroscope, in which an integrating sphere was used as the sample chamber. The digital photographs of the as-prepared Ln-doped NaCeF4 samples were taken by a Canon digital camera under the strongest excitation at the corresponding wavelength. A cathodoluminescence spectrometer (Gantan MonoCL3+) equipped on the environmental scanning electron microscope (Quanta 400 FEG, FEI) was used to measure the CL spectra of the samples (accelerating voltage of electron beam: 3.15 kV for NaCeF4:Eu3+, 4.75 kV for NaCeF4:Dy3+/Tb3+).3. Results and discussion
3.1 Phase and microstructure study
The crystal structure of ALnF4 exhibits two polymorphic forms (cubic and hexagonal phases), depending on the selected synthesis conditions and methods. It has been illustrated that the hexagonal phase ALnF4 is a much better host lattice than its cubic counterpart for UC/DC luminescence.45 Usually, in order to obtain the pure hexagonal phase ALnF4, sufficiently high temperature and longer time duration are needed for reaction. Fig. 1 shows the XRD patterns of the as-prepared Dy3+ doped NaCeF4 NRs via the hydrothermal procedure at 190 °C for 24 h. It can be seen that all the diffraction peaks of the products can be indexed to the pure hexagonal phase NaCeF4 structure (JCPDS, number 50-0154). The diffraction peaks of the products are very sharp and strong, indicating the formation of the NaCeF4 samples with high crystallinity through this method. In addition, one can observe from the red dotted line that the diffraction peaks of the NaCeF4:Dy3+ samples shifted toward high angles gradually with increasing the content of Dy3+, indicating the decrease of the unit-cell volume. This is mainly ascribed to the smaller ionic radius of Dy3+ (r = 1.167 Å) which replaces the relatively larger Ce3+ (r = 1.283 Å).46 Moreover, the broadened diffraction peaks reveal that the average crystalline size decreases with increasing the content of Dy3+. It should be noted that the Eu3+ and Tb3+ doped samples present similar results (data not shown). | ||
| Fig. 1 Typical XRD patterns of the NaCeF4 NRs doped with different Dy3+ contents: (a) 0.02, (b) 0.05, (c) 0.1, and (d) 0.15, (e) the standard hexagonal phase NaCeF4 (JCPDS number: 50-0154). The diffraction peaks of the residual NaF were indicated by green triangles. The peaks shift towards higher angles (marked by a red dotted line). | ||
To investigate the morphology and size of the NaCeF4:mDy3+ NRs, further TEM and STEM characterizations are performed and the results are shown in Fig. 2. As demonstrated, all of the samples present highly monodispersed and uniform NRs, and can be self-assembled into a two-dimensional ordered array. The aspect ratios of the samples were measured to be 8.02, 9.41, and 13.59, with the increase of the Dy3+ concentration from 0.02 to 0.10. This evolution in size is due to the effect of the Dy3+ dopant ion on the crystal growth rate through surface charge modification.7 Liu's7 and our previous reports42 reveal that the crystal size can be readily tuned by doping Ln3+ with different ionic radius in the NaLnF4 host. The smaller Ln3+ dopants may result in the formation of larger-sized nanocrystals. Therefore, in our case, the increased size is mainly attributed to the doped Ln3+ (Dy3+) with a larger ionic radius.
 | ||
| Fig. 2 TEM (left panel), STEM (middle panel), and HR-TEM (right panel) images of the NaCeF4 NRs doped with different contents of Dy3+: (a) 0.02, (d) 0.05, (g) 0.1, and (j) 0.15. (b), (e), (h) and (k) are the corresponding STEM images and (c), (f), (i) and (l) denote the corresponding HR-TEM images. The right-up inset of each HR-TEM image shows the corresponding SAED pattern. | ||
The HR-TEM and SAED results (right panels in Fig. 2) show that the as-prepared NRs present a high crystallinity and single crystal nature. The interplanar crystal spacing of the [002] and [200] lattice planes measured from the HR-TEM results (right panels in Fig. 2) decreased gradually when the Dy3+ doping content was varied from 0.02 to 0.15, which coincides well with the analyzed results of the XRD patterns. Moreover, the preferred growth direction is along the [001] direction. During the STEM analysis, the corresponding EDS and EDS mapping are obtained and the results for the NaCeF4:0.05Dy3+ NRs are presented in Fig. 3. The EDS results (Fig. 3f) reveal that the as-prepared NaCeF4:0.05Dy3+ NRs are mainly composed of Na+, Ce3+, F−, Dy3+ and no other impurity is detected. Further EDS mappings show that the elements (Na+, Ce3+, F−, Dy3+) are uniformly dispersed within the regions of the NRs. It is noted that the Eu3+ or Tb3+ doped samples also exhibit highly uniformed and monodispersed NRs (data not shown).
 | ||
| Fig. 3 (a) STEM of the NaCeF4:0.05Dy NRs, (b–e) the corresponding EDS mapping of the as-prepared NRs shown in a, and (f) EDS of the NaCeF4:0.05Dy3+ samples. | ||
3.2 Tunable multicolor and DC properties
As a doping ion, the Eu3+ concentration in a host has great influence on the emission intensity and the shapes of the spectra.38 Therefore, we selected a series of doping contents of Eu3+ (0.02, 0.05, 0.1, and 0.15) to investigate its spectral and luminescence nature in the hexagonal NaCeF4 host lattice. Fig. 4 shows the excitation and emission spectra of the Eu3+ doped NaCeF4 NRs. As presented in Fig. 4a, the excitation spectra contains the characteristic peaks of Eu3+ within the configuration 4F6 between 250 and 450 nm, which is analogous to the absorption curve for Eu3+ in the YF3 and NaYF4 host.39 The excitation lines can be attributed to the corresponding energy transfer: (317 nm, 7F0 → 5H6; 361 nm, 7F0 → 5D4; 384 nm, 7F0 → 5G2; 395 nm, 7F0 → 5L6, strongest; and 415 nm, 7F0 → 5D3). In addition, these weak lines (such as 253, 286, and 297 nm) have little contribution to the emission. The excitation spectra of the Eu3+ doped NaCeF4 host have considerable difference from that in oxide hosts, where the charge-transfer band (200–300 nm) of Eu3+–O2− has been detected constantly. In comparison with the Ce3+/Dy3+ and Ce3+/Tb3+ co-doped nanomaterials, the combination between Eu3+ and Ce3+ also exhibits distinctive excitation properties, which can be attributed to the transitions of the different crystal field splitting levels of the 5d state for Ce3+ ions in the NaCeF4 host. | ||
| Fig. 4 (a) Excitation and (b) emission spectra of NaCeF4:mEu3+ (m = 0.02, 0.05, 0.1, and 0.15) NRs. (c) Luminescence decay (λex = 395 nm, λem = 615 nm) spectra of NaCeF4:mEu3+ NRs. | ||
The luminescent intensities of the NaCeF4:Eu3+ NRs were remarkably enhanced via increasing the doping content of Eu3+ from 0.02 to 0.15 (Fig. 4b). As demonstrated in Fig. 4b, the emission spectra of the NaCeF4:mEu3+ NRs were obtained by the strongest excitation wavelength of 395 nm (7F0 → 5L6 transition of Eu3+). According to the proposed energy level diagram (Fig. 5), all the emission lines are composed of 5D0,2 → 7FJ transitions of Eu3+, namely, 468 nm, 5D2 → 7F0; 485 nm, 5D2 → 7F2; 574 nm, 5D0 → 7F0; 591 nm, 5D0 → 7F1; 615 nm, 5D0 → 7F2; 649 nm, 5D0 → 7F3; and 690/695 nm, 5D0 → 7F4.36 In comparison to the PL properties of the Dy3+ and Tb3+ doped NaCeF4 system, the Eu3+ doped NaCeF4 NRs present a very weak excitation peak centered at 261 nm of Ce3+, indicating that the intense emissions of the as-prepared NaCeF4:Eu3+ NRs come from the intrinsic emissions of the Eu3+ rather than the energy transfer between the Ce3+ and Eu3+. Moreover, with increasing the Eu3+ content, the excitation peak centered at 261 nm of Ce3+ gradually disappears, indicating the hardness of the direct sensitization of Eu3+ by Ce3+, which is similar with a previous report.47 This is mainly ascribed to the electron transfer quenching effect between Ce3+ and Eu3+, resulting in the poor energy transfer from Ce3+ to Eu3+.47–49 The energy transfer probability depends on the critical distance of the energy transfer.50,51 As demonstrated in Fig. 4b, the relative emission intensity ratio of the transitions (5D2 → 7FJ)/(5D0 → 7FJ) decreased when the doping contents of Eu3+ increased. Moreover, the strongest emission peak of Eu3+ is not constant, which is centered at 485 nm when the doping content of Eu3+ in NaCeF4 host is low (0.02 and 0.05) and centered at 615 nm while increasing the Eu3+ composition to 0.1 and 0.15. In general, the differences in the relative emission intensity are mainly attributed to the doping content of Eu3+ and their predominant vibration frequencies available in the host.40 The emission peaks centered at 591 nm (5D0 → 7F1) and 615 nm (5D0 → 7F2) are ascribed to the magnetic and electric dipole transitions of Eu3+, respectively, and the asymmetric environment of the Eu3+ ion in the host can be calculated by the integrated intensity ratio (denoted as A21) of the electric to magnetic dipole transitions.52–54 The A21 values are calculated to be ∼1.47, 1.56, 1.58, and 1.80, when increasing the dopant content of Eu3+. The 5D0 → 7F2 transition is more sensitive than that of the 5D0 → 7F1 transition and the peak at 615 nm is always dominant compared with the one at 591 nm. The higher A21 value indicates that a higher local disorder and distortion appears in the Eu3+ doped NaCeF4 system, which can enhance the emission intensity enormously. The CIE coordinates (labeled from 1 to 4 in Fig. 8) are calculated to be (0.31, 0.36) for NaCeF4:0.02Eu3+, (0.33, 0.31) for NaCeF4:0.05Eu3+, (0.42, 0.32) for NaCeF4:0.1Eu3+, and (0.43, 0.33) for NaCeF4:0.15Eu3+ NRs, respectively. From the corresponding digital photographs of the powders (the insets in Fig. 8), the tunable multicolor outputs from green to bright white and finally to red were readily obtained by singly doping Eu3+ in the NaCeF4 host. Moreover, the calculated CIE coordinates (0.33, 0.31) of the NaCeF4:0.05Eu3+ NRs are very close to the standard white light emission (0.33, 0.33). These findings provide a new route for achieving white light emissions by only singly doping Ln3+, which is different with previously reported Ce3+/Mn2+ co-doped phosphors.55 The PL decay profile of the 5D0 level at 615 nm of Eu3+ for these NaCeF4:Eu3+ NRs under the excitation of 395 nm is shown in Fig. 4c. The experimental data were fitted by a mono-exponential function and the lifetimes were calculated to be 4.79, 6.13, 7.61, and 8.15 ms, respectively. In addition, the quantum yields of the NaCeF4:Eu3+ NRs were measured to be 33%, 40%, 49%, and 57%, respectively.
 | ||
| Fig. 5 The proposed energy level diagram and luminescence mechanisms of the NaCeF4:Ln3+ NRs. | ||
The NaCeF4:mDy3+ (m = 0.02, 0.05, 0.1, and 0.15) NRs also exhibit unique DC properties and the excitation/emission spectra are illustrated in Fig. 6a and b, respectively. The excitation spectra (Fig. 6a) are composed of the intense absorption band centered at 261 nm of Ce3+ and the relative weak characteristic f–f transition lines of Dy3+, which are assigned to the corresponding energy transfer: 324 nm, 6H15/2 → 6P3/2; 350 nm, 6H15/2 → 6P7/2; 364/368 nm, 6H15/2 → 6P5/2; and 388/395 nm, 6H15/2 → 4M21/2, respectively. On the other hand, the emission spectra (Fig. 6b) excited via the intense Ce3+ absorption peak at 261 nm were dominated by two groups of emissions (477/482 nm, 4F9/2 → 6H15/2; and 572 nm, 4F9/2 → 6H13/2). There is still some weak emission transition such as the 4F9/2 → 6H11/2 transition of Dy3+ at 658 nm. The energy transfer mechanism of Dy3+ in the NaCeF4 matrix is shown in Fig. 5. Under UV excitation, the energy transfer took place between the Ce3+ ions at first, and then transferred from Ce3+ (5d) to Dy3+. Finally, the excited levels of Dy3+ radiatively transferred to the lower energy levels. The multicolor emissions, such as yellowish-green for NaCeF4:0.02/0.05/0.1Dy3+ and yellow for NaCeF4:0.15Dy3+, are obtained under the excitation of 261 nm (insets in Fig. 8). The calculated CIE coordinates followed by the emission spectra are measured to be (0.30, 0.37) for NaCeF4:0.02Dy3+, (0.31, 0.37) for NaCeF4:0.05Dy3+, (0.32, 0.38) for NaCeF4:0.1Dy3+, and (0.36, 0.41) for NaCeF4:0.15Dy3+ as marked by 5 to 8 in Fig. 8. The PL decay profile (shown in Fig. 6c) of the NaCeF4:mDy3+ NRs also matched well with the mono-exponential curve fit and the calculated decay times are 5.31, 4.48, 4.02, and 3.10 ms, respectively. The quantum yields of the NaCeF4:mDy3+ NRs were tested to be 41%, 27%, 24%, and 13%, respectively.
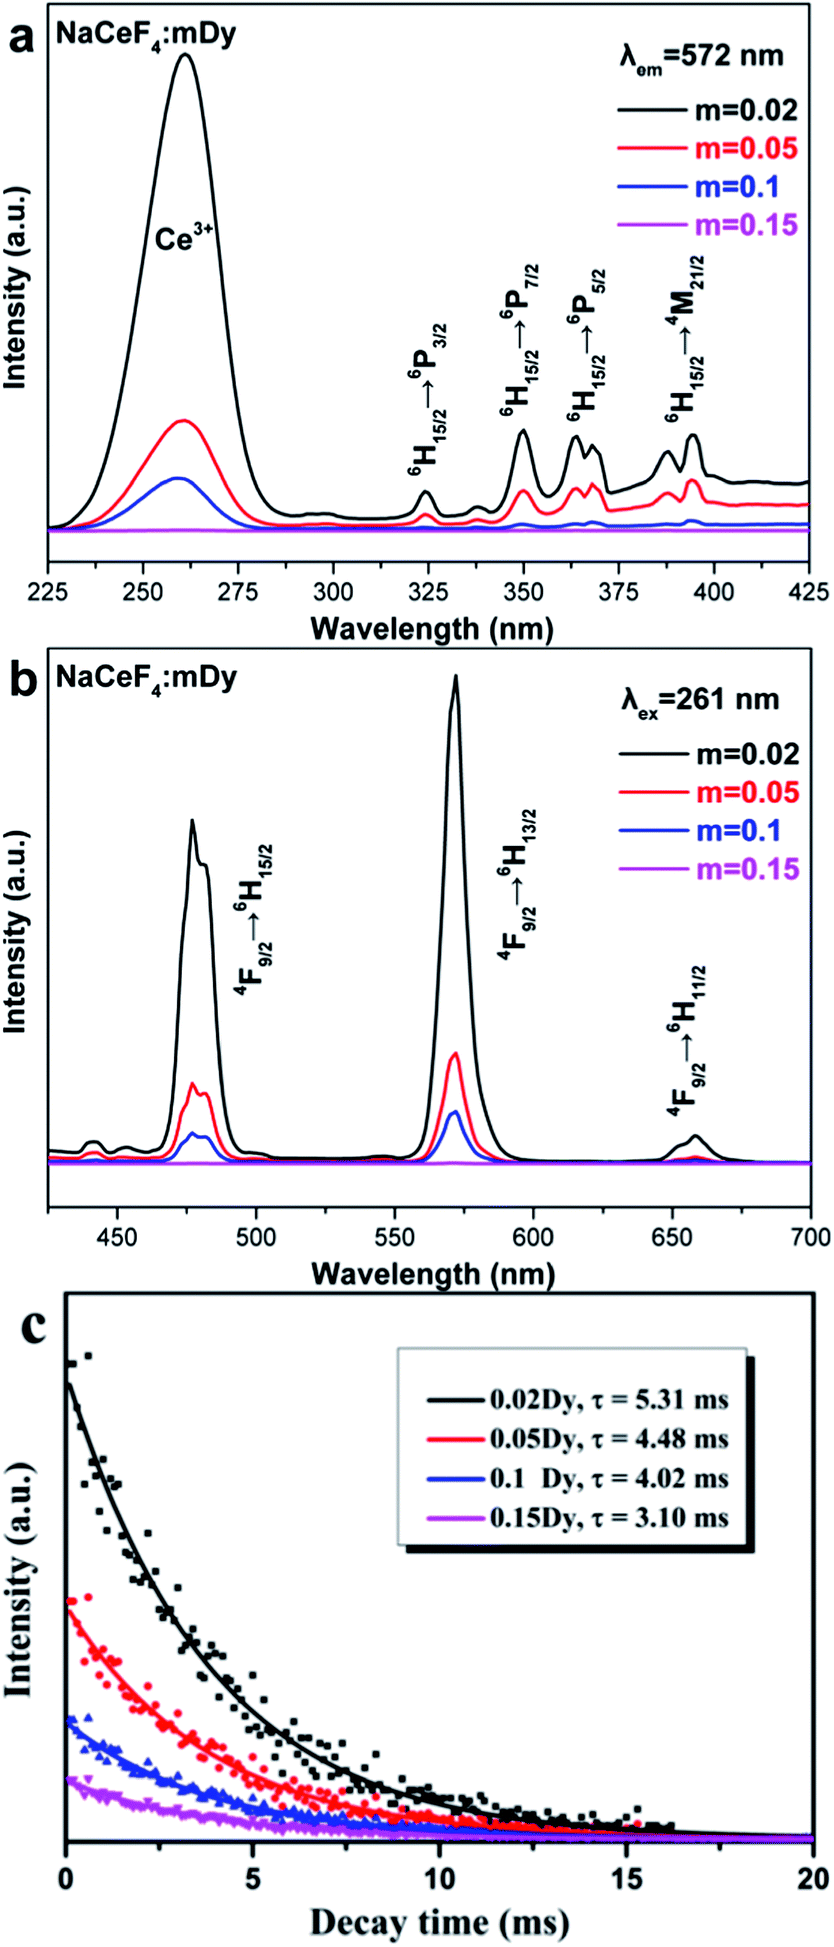 | ||
| Fig. 6 (a) Excitation and (b) emission spectra of NaCeF4:mDy3+ (m = 0.02, 0.05, 0.1, and 0.15) NRs. (c) Luminescence decay (λex = 261 nm, λem = 572 nm) spectra of NaCeF4:mDy3+ NRs. | ||
As for Tb3+, it contains a low energy state (7FJ, J = 0, …, 6) and excited states (5D3 and 5D4), which results in blue or green emissions with a low or high doping content of Tb3+, respectively.56 Similar to the Dy3+ doped NaCeF4 samples, the excitation spectra of NaCeF4:mTb3+ (m = 0.02 and 0.05) consist of a predominant Ce3+ absorption line, centered at 261 nm and relative weak f–f transitions of Tb3+ (351 nm, 7F6 → 5D2; 375 nm, 7F6 → 5G6), as observed in Fig. 7a. Under the excitation of a UV light at 261 nm, the emission spectra of the NaCeF4:mTb3+ NRs consist of the transitions of Tb3+: 489 nm, 5D4 → 7F6; 543/546 nm, 5D4 → 7F5, strongest; 584 nm, 5D4 → 7F4; and 620 nm, 5D4 → 7F3, respectively. The bright green emissions of the NaCeF4:Tb3+ NRs are presented (insets in Fig. 8) and the CIE coordinates are calculated to be (0.31, 0.51) for NaCeF4:0.02Tb3+ and (0.33, 0.54) for NaCeF4:0.05Tb3+ NRs. The mono-exponential fitting of the NaCeF4:mTb3+ NRs shows the lifetime of the transition (5D4 → 7F5) and the decay times are measured to be 7.71 and 8.92 ms for m = 0.05 and 0.1, respectively (shown in Fig. 7c). The quantum yields of the NaCeF4:mTb3+ NRs are recorded to be 25% and 30%, respectively.
 | ||
| Fig. 7 (a) Excitation and (b) emission spectra of NaCeF4:mTb3+ (m = 0.02 and 0.05) NRs. (c) Luminescence decay (λex = 261 nm, λem = 543 nm) spectra of NaCeF4:mTb3+ NRs. | ||
 | ||
| Fig. 8 The CIE chromaticity diagram of the as-prepared NaCeF4:Eu3+/Dy3+/Tb3+ NRs. The upright insets present the digital photographs of the as-prepared powders under the excitation of a Xe lamp at the corresponding strongest excitation peak. | ||
3.3 CL properties
The low-voltage CL properties of materials are significant for field-emission displays. To further reveal their potential applications in field-emission devices, the CL properties were investigated. As shown in Fig. 9, their CL spectra were similar to the corresponding PL spectra. Under the low-voltage electron beam excitation (accelerating voltage: 3.15 kV), the NaCeF4:0.15Eu3+ NRs give bright yellowish-red light with emission peaks centered at 593, 618, and 697 nm owing to the transitions 5D0 → 7F1, 5D0 → 7F2, and 5D0 → 7F4 of Eu3+, respectively. For the NaCeF4:0.02Dy3+ NRs, the CL spectrum (excitation voltage: 4.75 kV) shows two intense emission peaks at 480 and 572 nm due to the transitions 4F9/2 → 6H15/2 and 4F9/2 → 6H13/2 of Dy3+, respectively. These NRs show greenish-yellow light under the electron beam excitation. As for the NaCeF4:0.05Tb3+ NRs, the CL spectrum (excitation voltage: 4.75 kV) is composed of emission peaks at 491, 545, 587, and 622 nm, which result from 5D4 → 7F6, 5D4 → 7F5, 5D4 → 7F4, and 5D4 → 7F3 transitions of Tb3+, respectively. | ||
| Fig. 9 CL spectra of (a) NaCeF4:0.15Eu3+, (b) NaCeF4:0.02Dy3+, and (c) NaCeF4:0.05Tb3+ NRs. Accelerating voltages were 3.15, 4.75, and 4.75 kV for a–c, respectively. | ||
4. Conclusion
In summary, the pure hexagonal phase NaCeF4:Ln3+ (Ln3+ = Eu3+, Dy3+, Tb3+) NRs have been successfully fabricated via a hydrothermal method. The microstructural studies exhibit the formation of high quality NaCeF4:Ln3+ NRs with monodispersity, uniform shape and single crystal nature. Furthermore, the tunable multicolor, especially white emissions can be obtained by adjusting the doping ions and the doping content. It is important that the CIE coordinates of NaCeF4:0.05Eu3+ NRs are located in the white region and are calculated to be (0.33, 0.31), which is close to the standard white light emission (0.33, 0.33). These findings provide a simple way for white light emission by only singly doping Eu3+, which is different with previously demonstrated Ce3+/Mn2+ co-doped phosphors. The excellent DC emissions, tunable multicolor output and bright white light luminescence of the NaCeF4:Ln3+ NRs may find applications in field-emission devices and solid state lighting.Acknowledgements
This work was supported by the National Natural Science Foundation of China (nos. 51102202 and 31370736), the Specialized Research Fund for the Doctoral Program of Higher Education of China (no. 20114301120006), the Hunan Provincial Natural Science Foundation of China (no. 12JJ4056), and the Scientific Research Fund of Hunan Provincial Education Department (13B062).Notes and references
- Y. S. Liu, D. T. Tu, H. M. Zhu and X. Y. Chen, Chem. Soc. Rev., 2013, 42, 6924 RSC.
- S. L. Gai, C. X. Li, P. P. Yang and J. Lin, Chem. Rev., 2014, 114, 2343 CrossRef CAS PubMed.
- F. Wang, X. J. Xue and X. G. Liu, Angew. Chem., Int. Ed., 2008, 47, 906 CrossRef CAS PubMed.
- F. Wang and X. G. Liu, Acc. Chem. Res., 2014, 47, 1378 CrossRef CAS PubMed.
- Y. P. Li, J. H. Zhang, X. Zhang, Y. S. Luo, S. Z. Lu, X. G. Ren, X. J. Wang, L. D. Sun and C. H. Yan, Chem. Mater., 2009, 21, 468 CrossRef CAS.
- Y. S. Liu, D. T. Tu, H. M. Zhu, R. F. Li, W. Q. Luo and X. Y. Chen, Adv. Mater., 2010, 22, 3266 CrossRef CAS PubMed.
- F. Wang, Y. Han, C. S. Lim, Y. H. Lu, J. Wang, J. Xu, H. Y. Chen, C. Zhang, M. H. Hong and X. G. Liu, Nature, 2010, 463, 1061 CrossRef CAS PubMed.
- Y. F. Wang, G. Y. Liu, L. D. Sun, J. W. Xiao, J. C. Zhou and C. H. Yan, ACS Nano, 2013, 7, 7200 CrossRef CAS PubMed.
- N. M. Idris, M. K. Gnanasammandhan, J. Zhang, P. C. Ho, R. Mahendran and Y. Zhang, Nat. Med., 2012, 18, 1580 CrossRef CAS PubMed.
- G. Y. Chen, T. Y. Ohulchanskyy, R. Kumar, H. Ågren and P. N. Prasad, ACS Nano, 2010, 4, 3163 CrossRef CAS PubMed.
- M. Haase and H. Schäfer, Angew. Chem., Int. Ed., 2011, 50, 5808 CrossRef CAS PubMed.
- W. P. Fan, B. Shen, W. B. Bu, F. Chen, K. L. Zhao, S. J. Zhang, L. P. Zhou, W. J. Peng, Q. F. Xiao, H. Y. Xing, J. N. Liu, D. L. Ni, Q. J. He and J. L. Shi, J. Am. Chem. Soc., 2013, 135, 6494 CrossRef CAS PubMed.
- J. C. Boyer, F. Vetrone, L. A. Cuccia and J. A. Capobianco, J. Am. Chem. Soc., 2006, 128, 7444 CrossRef CAS PubMed.
- X. Wang and Y. D. Li, Angew. Chem., Int. Ed., 2003, 42, 3497 CrossRef CAS PubMed.
- S. Sivakumar, F. C. J. M. van Veggel and M. Raudsepp, J. Am. Chem. Soc., 2005, 127, 12464 CrossRef CAS PubMed.
- H. T. Wong, H. L. W. Chan and J. H. Hao, Appl. Phys. Lett., 2009, 95, 022512 CrossRef PubMed.
- Z. Y. Hou, P. P. Yang, C. X. Li, L. L. Wang, H. Z. Lian, Z. W. Quan and J. Lin, Chem. Mater., 2008, 20, 6686 CrossRef CAS.
- S. J. Zeng, Z. G. Yi, W. Lu, C. Qian, H. B. Wang, L. Rao, T. M. Zeng, H. R. Liu, H. J. Liu, B. Fei and J. H. Hao, Adv. Funct. Mater., 2014, 24, 4051 CrossRef CAS.
- J. T. Hu, L. S. Li, W. D. Yang, L. Manna, L. W. Wang and A. P. Alivisatos, Science, 2001, 292, 2060 CrossRef CAS PubMed.
- X. Wang, J. Zhuang, Q. Peng and Y. Li, Inorg. Chem., 2006, 45, 6661 CrossRef CAS PubMed.
- S. J. Zeng, M. K. Tsang, C. F. Chan, K. L. Wong, B. Fei and J. H. Hao, Nanoscale, 2012, 4, 5118 RSC.
- G. Z. Ren, S. J. Zeng and J. H. Hao, J. Phys. Chem. C, 2011, 115, 20141 CAS.
- J. Zhuang, L. Liang, H. H. Y. Sung, X. Yang, M. Wu, I. D. Williams, S. Feng and Q. Su, Inorg. Chem., 2007, 46, 5404 CrossRef CAS PubMed.
- C. Feldman, T. Justel, C. R. Ronda and P. J. Schmidt, Adv. Funct. Mater., 2003, 13, 511 CrossRef.
- A. Shalav, B. S. Richards, T. Trupke, K. W. Krämer and H. U. Güdel, Appl. Phys. Lett., 2005, 86, 013505 CrossRef PubMed.
- Y. W. Zhang, X. Sun, R. Si, L. P. You and C. H. Yan, J. Am. Chem. Soc., 2005, 127, 3260 CrossRef CAS PubMed.
- L. Y. Wang and Y. D. Li, Chem. Commun., 2006, 2557 RSC.
- Z. Q. Li and Y. Zhang, Angew. Chem., Int. Ed., 2006, 45, 7732 CrossRef CAS PubMed.
- L. Y. Wang, R. X. Yan, Z. Y. Hao, L. Wang, J. H. Zeng, H. Bao, X. Wang, Q. Peng and Y. D. Li, Angew. Chem., Int. Ed., 2005, 44, 6054 CrossRef CAS PubMed.
- H. K. Liu, Y. Luo, Z. Y. Mao, L. B. Liao and Z. G. Xia, J. Mater. Chem. C, 2014, 2, 1619 RSC.
- M. M. Jiao, Y. C. Jia, W. Lü, W. Z. Lv, Q. Zhao, B. Q. Shao and H. P. You, J. Mater. Chem. C, 2014, 2, 90 RSC.
- D. L. Geng, M. M. Shang, Y. Zhang, H. Z. Lian and J. Lin, Inorg. Chem., 2013, 52, 13708 CrossRef CAS PubMed.
- M. M. Jiao, N. Guo, W. Lü, Y. C. Jia, W. Z. Lv, Q. Zhao, B. Q. Shao and H. P. You, Inorg. Chem., 2013, 52, 10340 CrossRef CAS PubMed.
- W. H. Di, X. G. Ren, H. F. Zhao, N. Shirahata, Y. Sakka and W. P. Qin, Biomaterials, 2011, 32, 7226 CrossRef CAS PubMed.
- J. C. Boyer, J. Gagnon, L. A. Cuccia and J. A. Capobianco, Chem. Mater., 2007, 19, 3358 CrossRef CAS.
- J. H. Zeng, Z. H. Li, J. Su, L. Wang, R. Yan and Y. Li, Nanotechnology, 2006, 17, 3549 CrossRef CAS PubMed.
- X. S. Qu, H. K. Yang, G. H. Pan, J. W. Chung, B. K. Moon, B. C. Choi and J. H. Jeong, Inorg. Chem., 2011, 50, 3387 CrossRef CAS PubMed.
- J. W. Stouwdam and F. C. J. M. van Veggel, Langmuir, 2004, 20, 11763 CrossRef CAS PubMed.
- G. Blasse and B. C. Grabmaier, Luminescent Materials, Springer, Berlin, 1994 Search PubMed.
- M. Yu, J. Lin and J. Fang, Chem. Mater., 2005, 17, 1783 CrossRef CAS.
- S. Li, T. Xie, Q. Peng and Y. Li, Chem.–Eur. J., 2009, 15, 2512 CrossRef CAS PubMed.
- S. J. Zeng, J. J. Xiao, Q. B. Yang and J. H. Hao, J. Mater. Chem., 2012, 22, 9870 RSC.
- X. Wang, J. Zhuang, Q. Peng and Y. D. Li, Nature, 2005, 437, 121 CrossRef CAS PubMed.
- S. J. Zeng, H. B. Wang, W. Lu, Z. G. Yi, L. Rao, H. R. Liu and J. H. Hao, Biomaterials, 2014, 35, 2934 CrossRef CAS PubMed.
- K. W. Kramer, D. Biner, G. Frei, H. U. Gudel, M. P. Hehlen and S. R. Luthi, Chem. Mater., 2004, 16, 1244 CrossRef.
- R. D. Shannon, Acta Crystallogr., Sect. A: Cryst. Phys., Diffr., Theor. Gen. Crystallogr., 1976, 32, 751 CrossRef.
- F. Wang, X. P. Fan, M. Q. Wang and Y. Zhang, Nanotechnology, 2007, 18, 025701 CrossRef.
- G. Blasse and N. Sabbatini, Mater. Chem. Phys., 1987, 16, 237 CrossRef CAS.
- G. Blasse, Phys. Status Solidi A, 1983, 75, K41 CrossRef CAS.
- D. L. Dexter and J. A. Schulman, J. Chem. Phys., 1954, 22, 1063 CrossRef CAS PubMed.
- G. Blasse, Philips Res. Rep., 1969, 24, 131 CAS.
- A. K. Parchur, R. S. Ningthoujam, S. B. Rai, G. S. Okram, R. A. Singh, M. Tyagi, S. C. Gadkari, R. Tewari and R. K. Vatsa, Dalton Trans., 2011, 40, 7595 RSC.
- B. P. Singh, A. K. Parchur, R. S. Ningthoujam, A. A. Ansari, P. Singha and S. B. Rai, Dalton Trans., 2014, 43, 4779 RSC.
- A. K. Parchur, A. A. Ansari, B. P. Singh, T. N. Hasan, N. A. Syed, S. B. Raia and R. S. Ningthoujam, Integr. Biol., 2014, 6, 53 RSC.
- Y. Zhang, G. G. Li, D. L. Geng, M. M. Shang, C. Peng and J. Lin, Inorg. Chem., 2012, 51, 11655 CrossRef CAS PubMed.
- M. M. Shang, D. L. Geng, D. M. Yang, X. J. Kang, Y. Zhang and J. Lin, Inorg. Chem., 2013, 52, 3102 CrossRef CAS PubMed.
| This journal is © The Royal Society of Chemistry 2014 |