The production of biobased nonanal by ozonolysis of fatty acids

Tolibjon S. Omonova, Ereddad Kharraza, Patrick Foleyb and Jonathan M. Curtis*a
a4-10, Agricultural/Forestry Centre, Lipid Chemistry Group (LCG), Department of Agricultural, Food and Nutritional Science (AFNS), University of Alberta, Edmonton, Alberta T6G 2P5, Canada. E-mail: jcurtis1@ualberta.ca; Fax: +1-780-492-4265; Tel: +1-780-492-6364
bP2 Science, 4 Science Park, New Haven, Connecticut 06511, USA. Tel: +1-203-821-7457

Received 31st July 2014 , Accepted 9th October 2014

First published on 9th October 2014


Abstract

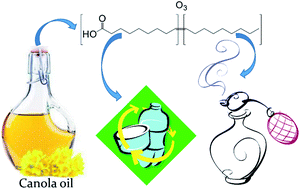
Ozonolysis has been proposed as a clean and efficient reaction for use in the production of biobased aldehydes from unsaturated plant oils that can directly replace similar petrochemical compounds. However, further oxidation of aldehydes to carboxylic acids can occur which reduces the yield and complicates aldehyde purification. In this work, the ozonolysis of free fatty acids in an aqueous medium was systematically studied with the objective of producing high yields of nonanal. A reductive/catalytic hydrogenation process was also used in order to reduce the ozonides and so increase the yield of aldehydes. The use of water as a co-solvent during the ozonolysis/hydrogenation processes was found to significantly reduce the formation of carboxylic acids compared to the use of organic solvents, described previously for the ozonolysis of oils and its derivatives. This can be attributed to the effective dilution and decomposition of peroxides formed in water, compared to the situation for organic solvents. A correlation between the ozonolysis time, ozone concentration and the aldehyde yields were observed. In particular, high ozone concentrations resulted in much faster production of aldehydes, so that under optimized conditions, nonanal production was achieved without excessive production of nonanoic acid. Various biobased aldehydes, which are used as key aroma ingredients and intermediates in flavor and fragrance formulations, can be prepared in a similar way by selection of other fatty acid feedstocks.

Introduction

Renewable resources such as plant oils are increasingly being used in to produce “biobased” chemicals as replacements, or partial replacements, for petrochemicals. This move is fueled by the desire to become less dependent on the world's finite petroleum resources and to shift towards more sustainable chemical production strategies. To date, biobased products represent only a very small percentage of the entire chemicals market and the widespread application of bio-based materials is still limited by their availability and their cost of production. However, the development of cost-effective biobased polymers and chemicals from available agricultural or forestry biomass is currently an area of intense research interest and a shift towards biobased materials and chemicals is to be expected.

C8–C13 straight chain fatty aldehydes are important aroma active compounds used in the perfume industry either individually or in combination in nearly all fragrance types.1 The C9 aldehyde nonanal has a roselike odor and is widely used as a component of floral perfumes, often at concentration of less than 1% by wt.2 Although nonanal occurs in several natural oils, such as cinnamon oil, lemon grass oil, citrus oil, and rose oils,3 it is produced commercially by hydroformylation of 1-octene4,5 or by catalytic dehydrogenation of nonanol.6 The production of nonanal by reaction of formic acid and nonanoic acid on a titanium dioxide catalyst has also been reported.3

Several attempts have been made to make aldehydes as the primary products of ozonolysis processes for the oxidative cleavage of unsaturated plant oils, including soybean oil,7–9 rapeseed oil10 and canola oil.8,11 However, the primary objectives of the previous reports7–11 were to make hydroxylated fatty acid derivatives from the heavy fraction of the ozonolysis products of vegetable oils via catalytically reduced ozonolysis products of vegetable oils. A recent report12 focused on the production of methyl-9-hydroxynonanoate from rapeseed oil methyl esters. However, less attention has been placed on the direct characterization and utilization of the light fractions from the ozonolysis/reduction processes, such as the short-chain aldehydes and acids.12 These could have high value as fragrances, as synthetic reagents, and as formulation ingredients for a number of personal care and cleaning products.13

Omonov et al. have recently studied14 the ozonolysis of canola oil, including the product yields and kinetics of the ozonolysis process in different solvent systems. The ozonolysis of unsaturated vegetable oils leads to the formation of a variety of products, depending on the type and location of the double bonds. For example, the ozonolysis of canola oil can result in the formation of propanal, 1,3-propanedial, hexanal and nonanal along with the formation of crude aldehyde oil. These aldehyde mixtures can also be further oxidized into carboxylic acids during a continuous ozonolysis process.

A major challenge that limits the usefulness of manufacturing nonanal from renewable resources is related to the cost of production. In addition, the resulting nonanal produced from plant oils and their derivatives may not be pure enough for flavor and perfume purposes, due to the distribution of fatty acids in the input oil. Consequently, another challenge in making biobased nonanal is in its separation from other aldehydes (or acids, if any). Another important aspect of producing aldehydes is the stabilization of the final products. For example, oxidation of aldehydes may lead to the formation of acids (e.g. nonanoic acid),14 or oligomerization of nonanal may take a place to form dimeric or trimeric species.13,15

Thus, the development of bio-based alternatives to petro-chemical aldehydes remains a challenge for the fragrance industry. The main goal of this work is to produce nonanal from a renewable a feedstock (plant oils) by simple and scalable production methods that would be cost-effective in the context of a high value but relatively low volume production for the fragrance industry, rather than as a commodity chemical. This goal includes the required isolation of the aldehyde from other byproducts generated during ozonolysis and reduction processes.

In this work, the ozonolysis of vegetable oil free fatty acids in aqueous media is studied at different concentrations of ozone. This is followed by an investigation of the catalytic reduction of the ozonolysis products in order to maximize the yield of aldehydes. Finally, nonanal is separated from the reaction mixture using high vacuum molecular distillation.

Results and discussion

Ozonolysis of canola oil FFAs in aqueous medium

Commercial grade, partially hydrogenated canola oil free fatty acids (PHCOFFA, Industrene 212, PMC Biogenix, Inc, US) were used for ozonolysis. The fatty acid profile of this free fatty acid (FFA) mixture is given in Table 1. The FFA mixture has a very high monounsaturated fatty acid content (about 85%, 67% of which is C18:1n − 9) along with a low content of di-unsaturated fatty acids (∼6%) and saturated fatty acids (∼9%), which simplifies the resulting aldehyde profile and maximizes the potential yield of nonanal. However, other free fatty acid profiles have also been used successfully.
Table 1 Fatty acid profile of PHCOFFAs
Fatty acids PHCOFFA [wt%]
C16:0 5.42
C18:0 3.51
C18:1 6t/8t 2.21
C18:1 9t 1.76
C18:1 9c 65.36
C18:1 10t 3.52
C18:1 11t 2.57
C18:1 11c 4.20
C18:1 12c 2.01
C18:1 12t 1.50
C18:1 13t 1.81
C18:2 n − 6 6.12


Ozonolysis of the FFAs were carried out in a specially designed ozonolysis vessel with the capacity of 2 L.14 Two different ozone generators, with similar capacity (∼50 g m−3) were coupled. Coupling different ozone generators would allow us to control the concentration of the O3 in the flow, while keeping an overall flow of O3/O2 mixture constant.

The coupled ozone generators used in this study were AZCOZON ozone generator coupled with controller unit (model RMU16-16 and model RMDC-32D & 02, respectively, AZCO Industries LTD) and ATLAS ozone generator (model ATLAS 30, Absolute Ozone). The overall flow of the O3/O2 mixture was measured using digital mass-flow meter (model GFM 17, Aalborg, US). The concentration of the ozone in the flow was measured using digital Teledyne ozone monitor system (model 454, Teledyne Technologies Co, US). A schematic representation of the assembled ozonolysis apparatus used in our experiments is given in Scheme 1.


image file: c4ra07917e-s1.tif
Scheme 1 Schematic representation of the assembled ozonolysis unit used for ozonolysis of free fatty acids.

A mixture of free fatty acids (300 ± 2 g) and distilled water (300 ± 2 g) was placed into a specially designed ozonolysis vessel. This vessel is equipped with a speed controlled motorized mixer and maintained at 20 ± 0.2 °C using the temperature controlling unit (Refrigerated/Heating Circulator, Jeio Tech VTRC-640), under a constant agitation speed with mechanical stirrers of 800 ± 5 rpm. Total ozonolysis reaction time was varied up to maximum of 280 min, depending on ozone concentration. Ozone (with desired concentration in the ozone/oxygen mixture) was produced by passing dry oxygen (99.6%, Praxair Canada Inc) as the feed gas through an ozone generator. The ozone was introduced into the reaction medium as finely dispersed gas bubbles through the specially designed coil, located at the bottom of the ozonolysis vessel. To follow the kinetics of product formation during the ozonolysis process, samples were taken periodically every 10 min, without interrupting the ozonolysis process, and were analyzed by GC-FID and GC-MS to determine the yield of ozonolysis products. External calibrations based on authentic standards and p-anisaldehyde volumetric internal standards were used to quantify the ozonolysis products. Any variation in the sample preparation prior to chromatographic analysis was corrected for by measuring the palmitic acid content in each sample. Palmitic acid is present originally in the FFAs and being saturated is not changed during the oxidation/reduction processes. Hence the palmitic acid content should remain at constant levels and can be used to correct for sampling errors, considering variations in emulsion composition. The change in temperature due to the exothermicity of the reaction of ozone with the double bonds of canola oil and other reactions was recorded with an HI 141B (H) thermologger (Hanna Instruments Canada Inc.), with an accuracy of temperature scanning ±0.1 °C. Three different concentrations, low (0.22 g min−1), moderate (0.44 g min−1) and high (0.55 g min−1), of the ozone were used in the ozonolysis experiments to study the kinetics of the ozonolysis process. The materials and all conditions used for the ozonolysis of FFAs are given in Table 2.

Table 2 Materials and conditions used for the ozonolysis of the aqueous mixtures of FFAs
Materials and conditions O3 concentration
Low Moderate High
a 300 g of FFA mixed with 300 g of H2O.b Combined O3/O2 flow rate is about 4.2 L min−1.
FFA/H2O ratioa [g g−1]   1[thin space (1/6-em)]:[thin space (1/6-em)]1 (±1%)  
O3 deliveryb [g min−1] 0.22 ± 0.1 0.44 ± 0.1 0.55 ± 0.1
O3 time [min] 280 ± 2 150 ± 2 100 ± 2
Temperature [°C]   20 ± 0.2  
Mixing [rpm]   800 ± 5  


Kinetics of the ozonolysis of canola oil FFAs in aqueous medium

One of the key challenges in performing the ozonolysis in this work is to establish the optimum conditions at a fixed ozone concentration. These conditions should allow the effective conversion of FFAs into aldehydes while avoiding the formation of carboxylic acids. In addition, the influence of ozone concentration on the yield of ozonolysis products should be understood. In particular, the relative yields of aldehydes versus carboxylic acids are expected to be depend on the ozone concentration. Finally, it is very important to establish the critical ozonolysis time for a given concentration of ozone, at which all double bonds of the FFAs have fully reacted.

In this work, ozonolysis experiments to study the kinetics of the ozonolysis of canola oil FFAs in aqueous medium were performed. Three different concentrations of ozone were used (Table 2), referred to in this work as high, moderate and low ozone concentration. As described earlier, two ozone generators with similar capacity were coupled to allow for control of the O3 concentration within the gas flow, while keeping the overall flow rate of the O3/O2 mixture constant.

It should be noted that the heavy fractions of the ozonolysis products could be very useful in many industrial applications if they are reduced to form diacids, but this is not the focus of the work described here.

Low ozone concentration ozonolysis experiments

A mixture of 300 g of canola oil FFAs and 300 g of water was used for the ozonolysis experiments. A 2.1 L min−1 oxygen flow was supplied to both the ozone generators, while only one ozone generator was used to produce ozone. The flow of the oxygen through the second ozone generator was necessary to keep a constant 4.2 L min−1 total flow of the O3/O2 mixture to the reactor. At this flow rate, approximately 0.22 g min−1 of ozone was delivered to the reaction medium. The ozonolysis of FFAs with low O3 concentration was carried out for 280 min. Samples of the ozonides were taken every 10 min without interrupting the ozonolysis process, and were analyzed using GC-FID and GC-MS to follow the formation of the ozonolysis products.

Fig. 1 shows stacked 3-dimensional GC-MS chromatograms of the ozonolysis products at the low concentration of ozone. The chromatograms presented in Fig. 1 are normalized to the internal standard (p-anisaldehyde) peak (not shown) to correct for sample injection volume errors and they are adjusted for the palmitic acid content (originally present in free fatty acids) to correct for sample preparation errors.


image file: c4ra07917e-f1.tif
Fig. 1 GC-MS chromatograms of the PHCOFFAs ozonolysis products at different stages of the ozonolysis process, using low concentration of ozone (0.22 g min−1).

As can be seen from Fig. 1 the chromatogram of the mixture of FFAs in water prior to ozonolysis (0 min) shows only palmitic acid with retention time (RT) of 19.05 min and C18 unsaturated fatty acids with RT of 20.71 min. The trace amounts of the other compounds could be attributed to oxidation of the FFAs (in H2O) with air during the initial temperature equilibration. Note that the peak of C18 unsaturated FFAs includes oleic, linoleic and linolenic acids that the retention times of these products are overlapped under the GC conditions used.

The mechanisms for the formation of ozonolysis products from unsaturated fatty acids and oils have been described elsewhere.7,14 Ozonolysis of FFAs leads to the formation of several products due to the oxidation of double bonds and cleavage of the ozonides. Scheme 2 illustrates the expected products of the oxidative cleavage of oleic acid and linoleic acid.


image file: c4ra07917e-s2.tif
Scheme 2 Oleic, linoleic acid structure and expected products of the oxidative cleavage of the double bonds.

For C18:1n − 9 fatty acids (oleic acid) ozonolysis leads to the formation of 9-oxononanoic acid and/or azelaic acid. The light products that contain the hydrocarbon end of the starting FFA following oxidative cleavage at a carbon–carbon double bond were C6–C10 aldehydes (hexanal, heptanal, octanal, nonanal and decanal) and their respective acids. These products arise since ozone will react with unsaturated fatty acids (see Table 1) to form ozonolysis intermediates,16 which to some extent spontaneously decompose to form aldehydes and/or acids.9

Fig. 1 illustrates how as ozonolysis time increases the abundance of ozonolysis products from the FFAs also increases, while the amount of the C18 unsaturated fatty acids decreases. As expected, the formation of nonanal and 9-oxononannoic acids were observed. After 240–250 min of ozonolysis, very little C18 unsaturated fatty acids remained but the amount of nonanal and 9-oxononannoic acid continue to increase. This phenomenon was attributed to the continued decomposition of ozonides that were already formed by this time. Surprisingly, the formation of only a very small amount of carboxylic acids was observed. This is in contrast to earlier reports of the ozonolysis of canola oil in other solvent systems14 where the formation of carboxylic acids was significantly higher after extended ozonolysis. This difference might be explained by considering the mechanism of the cleavage and reduction of ozonides. When the dimeric peroxides are cleaved during the ozonolysis processes, the hydrogen peroxide formed can easily attack aldehydes or Criegee intermediates16 to form carboxylic acid.17 Hydrogen peroxide is largely insoluble in solvents like ethyl acetate, but has high solubility in water and alcohols. So, the presence of water or alcohols during the ozonolysis processes significantly reduces the oxidizing effects of peroxides, due to dilution. On the other hand, water can react with a Criegee intermediates (formed during decomposition of ozonides) and form a hydroxy-hydroperoxide, which in turn decomposes heterogeneously to form either an aldehyde plus H2O2 or carboxylic acid plus H2O.18,19 As our results suggest, the ozonolysis process of FFAs with water promotes formation of aldehydes, while the presence of water also prevents further oxidation of carbonyls and/or aldehydes to form carboxylic acids.

Thus, it can be concluded that the ozonolysis of the FFAs with low ozone concentration is completed within 240–250 min of ozonolysis. The resulting products of the ozonolysis were mainly aldehydic, with small amounts of their respective acids.

Moderate ozone concentration ozonolysis experiments

In ozonolysis experiments with a moderate concentration of ozone, two ozone generators were used to produce the desired amount of ozone. A 2.1 L min−1 flow of oxygen was supplied to each ozone generator, so the total flow of the O3/O2 mixture was 4.2 L min−1. This resulted in 0.44 g min−1 of ozone being delivered to the reaction medium. The materials and conditions are given in Table 2.

The trends in the chromatograms (Fig. 2) of the GC-MS experiments are very similar to those of the low ozone concentration experiments. However, a considerably shorter time was necessary for complete oxidation of the double bonds of the unsaturated FFAs – about 120–130 minutes was sufficient to complete the ozonolysis process. The type and the amounts of the ozonolysis products after complete ozonolysis of double bonds were similar to the low ozone concentration experiments.


image file: c4ra07917e-f2.tif
Fig. 2 GC-MS chromatograms of the PHCOFFAs ozonolysis products at different stages of the ozonolysis process, using moderate concentration of ozone (0.44 g min−1).

It should be noted that the amount of carboxylic acids formed during ozonolysis using moderate ozone concentration was still low, i.e. less than 0.2 wt% at the end of ozonolysis process (see Nonanal and nonanoic acid yield section). So it can be concluded that the doubling of the ozone concentration does not negatively affect the aldehyde yields.

High ozone concentration ozonolysis experiments

In order to increase the ozone concentrations in the experiments two ozone generators were used at their maximum capacity resulting in 0.55 g min−1 of ozone being delivered to the reaction medium (see Table 2). It can clearly be seen from Fig. 3 that the time for complete ozonolysis of double bonds of FFAs is further reduced compared to the experiments with low and moderate concentrations of ozone.
image file: c4ra07917e-f3.tif
Fig. 3 GC-MS chromatograms of the PHCOFFAs ozonolysis products at different stages of the ozonolysis process, using high concentration of ozone (0.55 g min−1).

Although the ozonolysis experiment was carried out for 120 min, complete ozonolysis of the unsaturated FFAs was achieved in about 90 min. Overall, the GC-MS chromatograms showed same trends in formation of ozonolysis products as were seen in the previous experiments. Thus, it can be concluded that the ozonolysis of the FFAs can be completed in a shorter times using higher concentration of ozone, without negative impact to the ozonolysis products, such as the formation of carboxylic acids.

Temperature profiles of the ozonolysis processes

Ozonolysis reactions are usually comprised of two exothermic reactions20 that take place one after the other. The primary reaction is between unsaturated fatty acids and ozone to form ozonides. The secondary reaction is a decomposition of the intermediate ozonides produced in the primary reaction. Since both of these reactions are exothermic, an attempt was made to find a relationship between the ozonolysis time and the heat released by the reaction, by measuring the actual temperature profile of the ozonolysis processes. The change in temperature due to the exothermicity of the reaction of ozone with double bonds and other reactions was recorded with a thermologger (HI 141H, Hanna Instruments Canada Inc.) with an accuracy of ±0.1 °C.

In all experiments, prior to the start of ozonolysis the temperature of the FFA/H2O mixture was equilibrated at 20 °C, by means of coolant circulating in jacketed reaction vessel. Then, the temperature of the system was regulated at 20 °C during the ozonolysis process. Any change in temperature due to the exothermicity of the process should be registered by the thermologger.

As can be seen in Fig. 4, the reaction temperature does indeed change with the ozonolysis time due to the heat released by the reaction.


image file: c4ra07917e-f4.tif
Fig. 4 Temperature profiles of the ozonolysis processes of canola oil free fatty acids using different concentration of the ozone.

Similar thermal profiles were observed previously during the ozonolysis of canola oil in different solvent systems, and the kinetics of these processes were described.14

A steep increase in the temperature was observed at the start of the ozonolysis process, especially with high and moderate ozone concentrations. The rate of temperature increase is a consequence of the balance between the reaction exothermicity and the rate of heat loss due to the gas flow through the reactants and the circulating coolant. Hence, since the rate of cooling is approximately constant, it is not surprising that a higher ozone content led to a greater increase of temperature at initial stages of ozonolysis, as can be seen in Fig. 4.

The peak maximum of the curves indicate the completion of the ozonolysis of double bonds.

As evident from the analysis of the chromatograms in Fig. 1–3, the times for the temperature maxima are similar to the times that mark the end of the ozonolysis of free fatty acids. It is clear from Fig. 4, as expected, that the heat released during the ozonolysis process strongly depends on the ozone concentration used. Thus, at a higher concentration of ozone, the initial heat released by the process is greater, and the ozonolysis is completed at a shorter periods of time.

In summary, it was found that:

(i) The concentration of the ozone did not affect to the aldehyde/acid ratio of respective components, i.e. ratio of nonanal and nonanoic acids are remains unaffected by the ozone concentration;

(ii) Ozonolysis of FFAs was very effective with high concentration of ozone, i.e., the complete ozonolysis of FFAs can be achieved in shorter times, without negative effect on the products and their yield;

(iii) The formation of the carboxylic acids is caused not by ozone concentration only, but most likely, by the decompositions of the ozonides.

Nonanal and nonanoic acid yield

As the products of primary interest were aldehydes, particularly nonanal, an attempt was made to quantify the yield of nonanal formed during the ozonolysis of FFAs. Since nonanoic acid is formed from the same precursor, nonanoic acid was also quantified. Fig. 5 shows the yields of the nonanal (a), and nonanoic acids (b), as a function of ozonolysis time, acquired from the analysis of the GC-MS data (see Fig. 1–3).
image file: c4ra07917e-f5.tif
Fig. 5 Nonanal (a) and nonanoic acid (b) yields during the ozonolysis of FFAs in H2O (1[thin space (1/6-em)]:[thin space (1/6-em)]1) with different O3 concentration.

The product yields presented in Fig. 5 refer to the number of grams of product per kilogram of input FFA.

As mentioned earlier, nonanal is a major product of the ozonolysis of oleic acid, and the rate of the nonanal formation depends on ozone concentration (Fig. 5(a)). A similar trend was observed for the yield of nonanoic acid (Fig. 5(b)). However, after complete ozonolysis of the FFA double bonds, the yield of the products approaches similar values for all ozone concentrations.

As a qualitative indication of the relative rates of nonanal formation during the early stages of ozonolysis, the nonanal yield at 70 min of ozonolysis was plotted against ozone concentration in the three systems used (Fig. 6).


image file: c4ra07917e-f6.tif
Fig. 6 Nonanal yield vs. ozone concentration at 70 min of ozonolysis of FFAs in H2O (1[thin space (1/6-em)]:[thin space (1/6-em)]1). Symbols are experimental yield of nonanal at different concentration of ozone; the line is a linear fit to the experimental data.

It is clearly seen that as expected, the higher concentration of ozone promotes faster ozonolysis of unsaturated FFAs.

In these measurements, the yield of the nonanal is still well below the expected value presented in Table 6, even though it is proven that there is virtually complete consumption of free fatty acid double bonds by reaction with ozone. Hence, it is clear that a significant portion of the ozonides were not cleaved/reduced during ozonolysis and/or they form secondary compounds due to the recombination of the primary products. Thus, there is a need to identify and reduce these products in order to enhance the yield of ozonolysis products.

Reduction of PHCOFFA ozonides

Reduction of the ozonolysis products were carried out using catalytic hydrogenation process in 2 L bench top high-pressure vessel (Model 4501, Parr Instruments, US) coupled with temperature and safety control unit (Model 4836, Parr Instruments, US). The ozonides of FFAs were transferred into the hydrogenation vessel as is, i.e. without removing aqueous phase. The desired amount of catalyst (Pd black) was then added into ozonides and the vessel closed. The ozonides were purged with N2 for about 5 min under continuous flow of N2 and with continuous mixing. Then, the hydrogenation vessel with ozonides was filled with hydrogen (50–100 psi) under mixing, and the H2 was released. This allows for removal of the traces of other gases that may be present. This procedure was repeated at least three times. Then, the static pressure of the hydrogen (350 psi) was applied into the hydrogenation vessel, and the temperature set to 75 °C. Reduction of ozonides was allowed to proceed for about 80 min. Materials and conditions used for reduction of the aqueous mixtures of FFA ozonides are given in Table 3.
Table 3 Materials and conditions used for reduction of the aqueous mixtures of FFA ozonides
Materials and conditions Entry amount
Ozonides (∼50 wt% in H2O) [g] 500 (±1%)
H2 pressure [psi] 350 ± 5
Catalyst [wt%] 0.25 ± 0.02
Temperature [°C] 75 ± 5
Mixing [rpm] 1200 ± 100
Time [min] 80 ± 2


As reported previously14 the products of ozonolysis of C[double bond, length as m-dash]C double bonds can exist as unstable primary ozonides (1,2,3-trioxolane, or Criegee intermediate16) which decompose to give a carbonyl oxide and a carbonyl compound. In turn, the carbonyl oxide and a carbonyl compound react again (cycloaddition reaction) to form more stable secondary ozonides (1,2,4-trioxolane, or Staudinger ozonide). If no carbonyl compound is available, the formation of 1,2,4,5-tetraoxanes might be expected through dimerization of the carbonyl oxide.21 In addition, formation of oligomeric peroxides21,22 or peroxy hemi-acetals10,23 has also been reported.

The objective of this part of the study is to reduce these primary and secondary products of ozonolysis by using a reductive/catalytic hydrogenation process. The presence of the peroxidic species in ozonides were monitored during catalytic reduction process using the peroxide test method.24 The reduction of the ozonides was also monitored by nuclear magnetic resonance spectroscopy (1H-NMR). The disappearance of peroxides and ozonides should be a clear indication of the disappearance of the ozonolysis products that are intermediates for the formation of aldehydes.

A series of hydrogenation experiments were carried out to establish the optimum conditions for the reduction of ozonides, including catalyst concentration, reduction time, process temperature and hydrogen pressure. It was found that the ozonides can be reduced effectively using 350 psi H2, 75 °C, 0.25 wt% catalyst load (palladium black), 1200 rpm agitation speed and 80 min of hydrogenation.

Fig. 7 illustrates how the peroxide values of the ozonides change as a function of hydrogenation time when using the hydrogenation conditions described above. As can be seen, after 80 min of hydrogenation the peroxide value of the ozonides reaches a plateau and no further reduction was observed over an extended period of hydrogenation.


image file: c4ra07917e-f7.tif
Fig. 7 The change in peroxide values of fatty acid ozonides over hydrogenation time. Insert is 1H-NMR traces showing the disappearance of ozonides resonances after 80 minutes of catalytic reduction.

In addition, after the catalytic reduction process the product was checked for the presence of ozonides using 1H-NMR. The resonances centered at 5.137 and 5.196 ppm in the 1H-NMR spectra of ozonides were previously assigned14,25 to the protons in the 1,2,4-trioxolanes. It can clearly be seen from Fig. 7 (see insert) that the ozonides present in the products before hydrogenation (t = 0 min) completely disappeared after the reduction process (t = 80 min).

Thus, optimum catalytic hydrogenation conditions were established (see above) for the reduction of fatty acid ozonides, in order to maximize the yield of aldehydes.

Ozonolysis of FFAs and hydrogenation of FFA ozonides

As discussed above, from the study of the ozonolysis reaction using different concentrations of ozone we have established the optimum ozonolysis time for PHCOFFA with a high concentration of ozone (0.55 g min−1) of 90 ± 5 min or 260 ± 5 min with low concentration of ozone (0.22 g min−1). These two ozonolysis conditions were selected to prepare the ozonides of FFAs in order to produce aldehydes. Other experiment conditions were as described in Table 2. The purpose of these experiments was to evaluate all of the products of ozonolysis, especially the yield of aldehydes and the ratio of these aldehydes to their respective acids. The intention was for the products of ozonolysis (ozonides) to be optimally reduced by hydrogenation, so as to maximize the yield of aldehydes.

After the ozonolysis process, the ozonides (∼500 g) were immediately transferred as an aqueous mixture into a high pressure hydrogenation vessel for reduction to aldehydes by catalytic hydrogenation. The catalyst, (palladium black, 0.25 wt% to the organic phase) was added into the ozonides and the hydrogenation vessel was closed. The ozonides were purged for about 5 min under a continuous low flow of N2 and with continuous mixing, to remove any traces of oxygen or ozone. Then, the hydrogenation vessel was pressurized with hydrogen (80–100 psi) under mixing, and hydrogen was released. This procedure is repeated at least three times to allow removal of traces of all other gases present in ozonides. Finally, the temperature of the vessel was set to 75 °C and the static pressure of hydrogen (350 psi) was applied to the vessel.

After the reduction process, the product was filtered from the catalyst under vacuum, using Celite (500 fine, Sigma-Aldrich Canada) as a filtration aid, and the organic phase was separated from the aqueous phase using a separatory funnel. The organic phase collected from the reduction process was then transferred into single stage Wiped Film Evaporator (WFE, InCon Processing LLC, US) to separate the light volatile components from the heavy/crude fractions. The separation was carried out under low vacuum using the WFE conditions given in Table 4.

Table 4 The WFE conditions used for distillation/separation of the hydrogenation products
Distillation conditions Value
Internal condenser temperature [°C] 0 ± 0.2
Evaporator temperature [°C] 50 ± 0.2
Blade speed [rpm] 200 ± 10
Vacuum [mbar] 0.8 ± 0.1
Flow [g min−1] 0.8 ± 0.1


Based on the fatty acid profiles of the PHCOFFAs presented in Table 1, the expected yields of products from the cleavage of ozonides were calculated, assuming that all double bonds of the FFAs are fully ozonized and the products formed after the reduction process are aldehydes. These expected products of the FFAs and their yields are given in Table 5.

Table 5 The expected products and their yields (expressed as g of product per kg of oil) from oxidative cleavage and reduction of PHCOFFAs
Names of expected products Average MW [g mol−1] Expected yield
[mol kg−1] [g kg−1]
Heavy fractions
9-Oxononanoic acid 172.2 2.38 409.5
10-Oxodecanoic acid 186.3 0.13 23.3
11-Oxoundecanoic acid 200.3 0.24 48.1
12-Oxododecanoic acid 214.2 0.13 26.7
13-Oxotridecanoic acid 228.3 0.06 14.7
Palmitic acid 256.4 0.21 54.2
Stearic acid 284.5 0.12 35.1
Total 3.27 611.5
[thin space (1/6-em)]
Light fractions
1,3-Propanedial (malonaldehyde) 72.0 0.22 15.7
Pentanal 86.1 0.06 5.5
Hexanal 100.2 0.34 34.3
Heptanal 114.2 0.24 27.4
Octanal 128.2 0.13 16.0
Nonanal 142.2 2.38 338.2
Decanal 156.3 0.08 12.3
Total 3.45 449.4


As can be seen from Table 5, the cleavage of FFAs ozonides should lead to the formation of a heavy fractions containing C9–C13 bi-functional products (with an acid and an aldehyde functionality), and light fraction that is expected to contain C5–C10 monoaldehydes, along with short chain dialdehyde (malonaldehyde). The table indicates that the total yield of products exceeds the weight of initial material by ∼6%, which is due to oxygen addition in the reaction. From this calculation about 58% heavy and 42% light fractions would be expected with about 75% of the light fraction being nonanal, the product of interest.

The actual products of FFAs ozonolysis after reduction were assessed by GC-MS using individual fractions from WFE distillation and the results are given in Table 6. Note that the calculated yield given in Table 6 is expressed as g of the product per kg of ozonides, whereas in Table 5 are per kg of input oil. The light fractions presented in Table 5 are the cumulative amounts of these products in all fractions (crude, distillates and cold trap). Also, as defined above in Table 5 the heavy fraction of the distilled products includes C18 and C16 saturates and C9–C13 bi-functional fatty acids.

Table 6 The experimental yields (expressed as g of product per kg of ozonides) of the reduced products of FFA ozonides prepared with low and high O3 concentration. Calculated yield is also given for comparative purposes
Ozonolysis/reduction products Yield [g kg−1]
Experimental Calculated
Low O3 High O3
Heavy fractions 683.7 689.8 576.4
[thin space (1/6-em)]
Light fractions
Nonanal 198.1 201.5 318.8
Nonanoic acid 44.9 42.8 0.0
Other aldehydes and acids 73.3 65.9 104.8


Since the primary product of interest is nonanal, this and nonanoic acid are given individually in Table 6, while other light components are categorized into “other aldehydes and acids” including hexanal, octanal and decanal and their acids respective acids. It should be noted that 1,3-propanedial (malonaldehyde) and pentanal are relatively volatile and cannot be measured under the GC experimental conditions used.

It can be seen that the total experimental yields of the product using low and high ozone concentration ozonolysis processes were similar, although the ozonolysis time differed three-fold. In both cases, the total yield of the recovered products (light and heavy fractions) was only slightly smaller (∼2 wt%) than the theoretical values, due to the loss of the products during processing by WFE.

At around 200 g kg−1 ozonide, the yield of nonanal is only 63% of the expected amount. This is in part due to the formation of ∼44 g kg−1 nonanoic acid – partly during ozonolysis (up to ∼20 g kg−1, see Fig. 5) and partly due to further oxidation occurring during later fractionation and storage. The combined C9 fraction yield (nonanal plus nonanoic acid) is 76%. In contrast, the yield of the heavy fraction was significantly higher than the expected values (Table 6). This can be attributed to two factors both of which increase the yield of heavy fraction and decrease the light fraction correspondingly. Firstly, the presence of any residual unreacted C18:1 fatty acids (∼5%, as estimated from GC measurements) in the heavy fraction after distillation. Secondly, the formation of oligomeric products due to condensation reactions involving aldehydes and acids. Note that oligomerization due to ozonides was previously shown to be minimized during the ozonolysis in alcohols14 and as described above, ozonides were completely reduced in this work.

It can be concluded that the use of high ozone concentration for the ozonolysis of free fatty acids is preferable from an efficiency standpoint since it requires a much shorter time to complete the ozonolysis. The slightly lower yields of the aldehydes in low ozone concentrations experiments could be attributed to the removal of the light fractions by the O2/O3 flow during extended periods of ozonolysis. However, although not formally assessed in the present work, it is likely that the nonanal yield at low vs. high ozone concentration presented in Table 6 are not significantly different.

Methods

Gas chromatography (GC-FID)

Gas chromatography experiments were conducted using an Agilent gas chromatography system (Model 6890N, Agilent Technologies Inc, USA) consisting of a gas chromatograph equipped with flame ionization detector (GC-FID). A BP 20 capillary column (30 m × 0.25 mm ID, film thickness 0.25 μm, SGE Analytical Science Pty Ltd, USA) was used. The oven temperature was programmed to start at 50 °C and rise to 250 °C at a rate of 10 °C min−1. The injector and detector temperature were kept to 250 °C; split ratio: 80[thin space (1/6-em)]:[thin space (1/6-em)]1; injection volume: 1 μL; carrier gas: helium; flow rate 1.5 mL min−1, run time: 20.5 min. All data were processed with GC ChemStation (Rev. B.02.01).

Gas chromatography (GC-MS)

Gas chromatography-mass spectrometry (GC-MS) experiments were conducted using an Agilent GC system (Model 6890N, Agilent Technologies Inc, USA) coupled with MS unit (Model 5975B, Agilent Technologies Inc, USA). A HP5 capillary column 19091J-413 (30 m × 0.32 mm ID), film thickness 0.25 μm (J&W Scientific, Agilent Technologies Inc, USA) was used. The oven temperature was programmed to start at 50 °C and rise to 285 °C at a rate of 10 °C min−1. The injector temperature was kept to 250 °C; MS detector (model 5975) was used with EI as ion source. The split ratio: 50[thin space (1/6-em)]:[thin space (1/6-em)]1; injection volume: 2 μL; carrier gas: helium; (constant) flow rate 1.5 mL min−1, run time: 26.5 min. All data were acquired and processed with MSD ChemStation D.03.00.611.

1H-NMR

A 400 MHz Varian Inova 400-MR NMR spectrometer was used to examine the structure and the structural changes of free fatty acids after ozonolysis and hydrogenation processes. Ozonides or hydrogenated products (10 mg) were dissolved in deuterated (D6) acetone (0.7 mL) and immediately transferred for NMR measurements. All 1H-NMR spectra were obtained at room temperature.

Conclusions

Some of the factors affecting the production of aldehydes from the ozonolysis of unsaturated fatty acids in aqueous media have been evaluated. Specifically, in this work, the effect of ozone concentration on the ozonolysis of partially hydrogenated canola oil free fatty acids in aqueous media was investigated. Correlations between the ozonolysis time, ozone concentration and the product yields were observed. Fatty acids can effectively be oxidized at much faster rates using a high concentration of ozone without a negative impact on the ozonolysis products, i.e. a high concentration of ozone did not result in substantially greater formation of byproducts such as the corresponding carboxylic acids.

The use of water as a co-solvent during the ozonolysis/hydrogenation processes significantly reduces the formation of the carboxylic acids compared to that found previously in the ozonolysis of oils in organic solvents. This can be attributed to the more effective dilution and decomposition of peroxides in water compared to organic solvents.

Thus, depending on the fatty acid profile of the input FFAs, aldehydes such as nonanal can be derived from renewable sources using oxidation and reduction processes in water. After fractionation, these biobased aldehydes could be used in applications such as flavor and fragrance formulations. The results presented here indicate the feasibility of the scale-up of batch processes for the ozonolysis of vegetable oils in their fatty acid form, in particular for the formation of nonanal.

Acknowledgements

Authors acknowledge support for this work provided by the Biorefining Conversions Network of the University of Alberta and Alberta Innovates Bio Solutions. The technical contributions of Sarah Kosik is also acknowledged.

Notes and references

  1. H. Surburg and J. Panten, Common Fragrance and Flavor Materials, Preparation, Properties and Uses, Wiley-VCH, Weinheim, 5th edn, 2005 Search PubMed.
  2. Juniper Tree Perfumes, http://www.creatingperfume.com, accessed 15 June 2014.
  3. C. Kohlpaintner, M. Schulte, J. Falbe, P. Lappe, J. Weber and G. D. Frey, in Ullmann's Encyclopedia of Industrial Chemistry, Wiley-VCH, 2000, pp. 1–31 Search PubMed.
  4. C. M. Bartish, US Pat., 4 230 641, 1980.
  5. R. L. Pruett and J. A. Smith, US Pat., 4 148 830 A, 1979.
  6. Y. Matsubara, Y. Y. Fujiwara and C. Hata, JP Pat., 75130708, 1974.
  7. E. H. Pryde, D. E. Anders, H. M. Teeter and J. C. Cowan, J. Am. Oil Chem. Soc., 1961, 38, 375–379 CrossRef CAS.
  8. Z. S. Petrovic, W. Zhang and I. Javni, Biomacromolecules, 2005, 6, 713–719 CrossRef CAS PubMed.
  9. P. Tran, D. Graiver and R. Narayan, J. Am. Oil Chem. Soc., 2005, 82, 653–659 CrossRef CAS.
  10. C. S. Fitchet, N. G. Laughton, C. G. Chappel, M. L. Khan, V. Tverezovskiy, J. Tomkinson and P. Fowler, US Pat., 2005/0010069 A1, 2005.
  11. J. Yue and S. S. Narine, J. Am. Oil Chem. Soc., 2007, 84, 803–807 CrossRef CAS PubMed.
  12. K. Louis, L. Vivier, J. M. Clacens, M. Brandhorst, J. L. Dubois, K. D. Vigier and Y. Pouilloux, Green Chem., 2014, 16, 96–101 RSC.
  13. P. Foley and Y. Yang, US Pat., 2013/0274511 A1, 2013.
  14. T. S. Omonov, E. Kharraz and J. M. Curtis, J. Am. Oil Chem. Soc., 2011, 88, 689–705 CrossRef CAS PubMed.
  15. M. R. Dintzner, Y. A. Mondjinou and D. J. Pileggi, Tetrahedron Lett., 2010, 51, 826–827 CrossRef CAS PubMed.
  16. R. Criegee, Angew. Chem., 1975, 14, 745–752 Search PubMed.
  17. C. W. Jones, Applications of Hydrogen Peroxide and Derivatives, Royal Society of Chemistry, Cambridge, UK, 1999 Search PubMed.
  18. O. Vesna, S. Sjogren, E. Weingartner, V. Samburova, M. Kalberer, H. W. Gaggeler and M. Ammann, Atmos. Chem. Phys., 2008, 8, 4683–4690 CrossRef CAS.
  19. O. Vesna, M. Sax, M. Kalberer, A. Gaschen and M. Ammann, Atmos. Environ., 2009, 43, 3662–3669 CrossRef CAS PubMed.
  20. G. E. Zaikov and S. K. Rakovsky, Ozonation of Organic and Polymer Compounds, Smithers-Rapra, Shrewsbury, UK, 2009 Search PubMed.
  21. S. Fliszar and J. Carles, J. Am. Chem. Soc., 1969, 91, 2637–2643 CrossRef CAS.
  22. P. S. Bailey, Chem. Rev., 1958, 58, 925–1010 CrossRef CAS.
  23. N. Nishikawa, K. Yamada, S. Matsutani, M. Higo, H. Kigawa and T. Inagaki, J. Am. Oil Chem. Soc., 1995, 72, 735–740 CrossRef CAS.
  24. Peroxide value, in European Pharmacopoeia 7.0, European Directorate for the Quality of Medicine & Health Care (EDQM), 2013, ch. 2, p. 138.
  25. J. I. Choe, H. S. Choi and R. L. Kuczkowski, Magn. Reson. Chem., 1986, 24, 1044–1047 CrossRef CAS.

This journal is © The Royal Society of Chemistry 2014