Paper-based molecular diagnostic for Chlamydia trachomatis

Jacqueline C. Linnesa, Andy Fana, Natalia M. Rodrigueza, Bertrand Lemieuxb, Huimin Kongb and Catherine M. Klapperich*a
aBiomedical Engineering, Boston, University, Boston, MA 02215, USA. E-mail: catherin@bu.edu; Fax: +1 617-353-6766; Tel: +1 617-358-0253
bBioHelix Corporation, Beverly, MA 01915, USA

Received 31st July 2014 , Accepted 29th August 2014

First published on 29th August 2014


Abstract

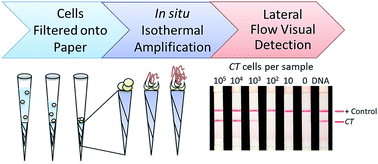
Herein we show the development of a minimally instrumented paper-based molecular diagnostic for point of care detection of sexually transmitted infections caused by Chlamydia trachomatis. This new diagnostic platform incorporates cell lysis, isothermal nucleic acid amplification, and lateral flow visual detection using only pressure and heat sources, eliminating the need for expensive laboratory equipment. This paper-based test can be performed in less than one hour and has a clinically relevant limit of detection that is 100× more sensitive than current rapid immunoassays used for chlamydia diagnosis.


Introduction

Worldwide, the World Health Organization estimates that more than 100 million new cases of Chlamydia trachomatis (CT) occur each year and more than 3% of women in high school and college are estimated to have CT infections in the United States. However, as many as 75% of infected women and 50% of infected men do not experience symptoms.1 In women, up to 40% of untreated CT infections spread into the uterus or fallopian tubes and cause pelvic inflammatory disease (PID), irreparably damaging the reproductive organs and causing sterility. Additionally, people with CT are up to five times more likely to contract the human immune deficiency virus (HIV),2 the virus that causes AIDS, and once infected, are three times more likely to transmit HIV to someone else.3

Despite the exquisite sensitivity and specificity of laboratory based molecular diagnostics for detection of sexually transmitted infections (STIs) (1 to 10 elementary bodies (EBs) per sample), the slow turnaround time of laboratory results causes continued transmission and lack of treatment for these infections. It has been shown that self-collected samples are able to provide the same sensitivity as those samples collected in clinics.4 In urine, the average CT load was 770 EBs per 100 μl samples for women and 1200 EBs per 100 μl for men.5

While sample collection is quite simple, resource intensive equipment and technical training are required for the sample preparation and molecular detection of STIs. Rapid diagnostic tests using protein immunoassays have been developed to target antigens on the CT surface in order to detect infections. However, while manufacturers report CT sensitivities up to 80% in package inserts, comparative studies have found that actual sensitivities are only 28% versus laboratory nucleic acid based tests.6 This is because the lower limit of detection of rapid immunoassay based tests is as high as 100[thin space (1/6-em)]000 EBs.7 A rapid point of care (POC) molecular test would provide both enhanced sensitivity and faster turn-around-time to improve STI detection and treatment outcomes, and prevention of further transmission.

To date, no disposable paper-based devices have been developed to combine the extraction, amplification and detection steps required for a fully integrated nucleic acid detection system. Polymer micro-solid phase extraction (μSPE) columns have been developed and utilized by numerous laboratories for the extraction and purification of DNA for POC sample preparation solutions.8,9 In our own laboratory, we have even shown that DNA purification can be performed using these columns in low-resource settings by pressurizing extractions with a bicycle pump.10 However, making the μSPE columns requires extensive polymer chemistry expertise to enable the precise control over porosity and flow-rates necessary to ensure nucleic acid capture. In contrast, Govindarajan et al. have performed paper-based lysis of E. coli that, once isolated, uses syringe based extraction of DNA for downstream PCR amplification in a tube.11 Rohrman et al. successfully performed isothermal amplification of HIV-1 RNA on a paper based device, although the RNA was extracted via traditional bench top methods.12 Commercial paper-based lateral flow visual detection systems for nucleic acids exist, but most still require separate traditional nucleic acid extractions and tube based amplification steps.

Isothermal helicase dependent amplification (tHDA), is a true isothermal amplification reaction that occurs at 65 °C and is able to amplify DNA extracted from cells.13 tHDA has been used in lateral flow-based molecular assays for the herpes simplex virus and required no separate nucleic acid extraction from the virus in clinical transport medium.14 However, extraction of DNA from bacteria is significantly different than from viruses. We sought to develop a paper-based molecular assay with minimal sample preparation from whole bacterial cells.

Our simple paper-based extraction and amplification support requires only chromatography paper, pipette tips, a positive pressure supply, and heat source. In this work, we utilize a paper support to filter cells from synthetic urine (Fig. 1A), followed by in situ tHDA at 65 °C (Fig. 1B) and elution to a lateral flow detection strip (Fig. 1C). We are able to perform the entire paper-based sample-to-detection process in less than one hour.


image file: c4ra07911f-f1.tif
Fig. 1 Schematic of the method to assemble and test paper extraction supports. (A) Cutting and folding of paper, (B) compression into pipette tip, (C) rinsing, (D) drying, (E) image of dried paper extraction supports in pressure manifold and close up view of paper folded into pipette tip (inset).

Materials and methods

Cell stocks

Heat-inactivated LGVII strain CT elementary bodies and quantified DNA were purchased directly from Advanced Biotechnologies, Inc. (Columbia, MD). Cells and DNA were suspended in synthetic urine (Arkray USA, Edina, MN) for all experiments.

Paper extraction and amplification support fabrication

To fabricate the paper supports, 3MM CHR paper was cut into 0.8 cm × 0.8 cm × 1.24 cm triangles, rolled, and placed into 200 μl pipette tips (Thermo Fisher Scientific, Waltham, MA). The paper supports were then compressed into the pipette tips using a 0.055 cm steel rod (McMaster-Carr, Princeton, NJ). To determine flow rates of the paper supports, pipette tips were placed in a pressure manifold built in-house and 300 μl of 70% ethanol was pushed through the paper supports at 20 psi. Tips with flow rates between 40 and 150 μl min−1 were used for sample extraction. Tips were then dried with 300 μl of 100% ethanol followed by dry air pressure at 20 psi for 10 minutes.

Porous polymer monoliths (PPMs)

PPMs were made using a 1.5[thin space (1/6-em)]:[thin space (1/6-em)]1 ratio of ethylene dimethacrylate crosslinker to butylmethacrylate monomer constituting 35% of the final pre-polymer solution. The remaining solution was 65% dodecanol which acts as a porogen. Eight mg of 2,2′-azobis(2-methylpropionitrile) (Sigma Aldrich, St. Louis, MO) was added as a thermal initiator for free-radical polymerization of the PPM. The solution was then vortexed and a pipette was used to aspirate 25 μl of the pre-polymer solution into individual 250 μl pipette tips (Thermo Fisher Scientific, Waltham, MA). These were then placed into a vacuum oven at 60 °C for 18 hours. Finally, the PPMs were rinsed at 20 psi in a pressure manifold built in-house using 600 μl of 100% methanol and then 600 μl of 100% ethanol to remove any unpolymerized solution. House-air at 20 psi was used to dry the PPMs for 10 minutes in the manifold.

Cell lysis and DNA extraction in tips

The single step cell lysis and extraction recipe was developed based on the methods of Boom et al. using chaotropic lysis and alcohol precipitation of DNA.15 Serial dilutions of heat inactivated CT LGVII cells were made from 105 to 101 cells in 10 μl of synthetic urine. Controls using synthetic urine only and 104 copies of CT DNA per 10 μl of the urine were also used. Samples were added to 190 μl of a chemical lysis and extraction solution containing 2.6 M guanidinium thiocyanate, 300 mM sodium chloride, 35% v/v 1-butanol (all from Sigma Aldrich, St. Louis, MO), and 45 μg glycoblue co-precipitant (Life Technologies, Grand Island, NY). Pipette tips with paper supports and cell solutions were loaded onto the in-house manifold and pressurized to 20 psi. The glycogen and DNA co-precipitated onto the paper or polymer supports, while the rest of the sample flowed through the pipette tip. The sample flow through was collected and PCR was performed on the flow through to determine the amount of uncaptured DNA in each sample. Extracted DNA–glycogen precipitates were then washed with 70% ethanol, followed by 100% ethanol and air dried for 10 minutes, all at 20 psi. Captured DNA was eluted from the paper extraction supports using Tris–EDTA for downstream amplification. Volumes and time required for each extraction step are described in Table 1.
Table 1 Single-step alcohol precipitation process
Assay step Volume added (μl) Time (min)
Single-step alcohol precipitation 200 5
70% ethanol wash 300 10
100% ethanol wash 300 5
Air dry 10
Elution 50 1
Total 850 50


qPCR amplification

SureStart Taq DNA polymerase (Agilent, Santa Clara, CA) real-time PCR conditions were optimized to include 1 mM magnesium sulphate in the reaction with 5 μl of sample solution in 20 μl of master mix according to the manufacturer's instructions. Primers and probe, purchased from Integrated DNA Technologies (Coralville, IA) as described in Table 2, were used in the master mix. Samples were heated to 95 °C for 10 minutes followed by 45 cycles of 95 °C for 15 seconds and 65 °C for 45 seconds. Amplification was additionally confirmed via polyacrylamide gel electrophoresis followed by extraction and sequencing of bands. Details of the electrophoresis procedure and results of sequencing are available in the ESI.
Table 2 Primers used for amplification
PCR Fwd ggatagcacgctcggtattt
Rev atgcaagatatcgagtatgcgt
Probe Cy5-attagcaagctgcctcagaata-NFQ
tHDA Fwd catgcaagatatcgagtatgcgttgtt
Rev Biotin-ctcataattagcaagctgcctcag
Probe tatttgaagactctactg-FAM


Downstream tHDA

A 20 μl reaction of master mix for tHDA was made according to the manufacturer's instructions using 2 μl of IsoAmp III Enzyme Mix (BioHelix, Beverly, MA), 40% ficoll 400 (Sigma-Aldrich, St. Louis, MO), Evagreen from Biotium, Inc. (Hayward, CA), dNTPs from NEB (Ispwitch, MA) and primers and probe purchased from Integrated DNA Technologies (Coralville, IA) as described in Table 2. Five μl samples of isolated DNA or whole CT cells were added to each tube, mixed with 20 μl of tHDA master mix, and overlaid with 50 μl of molecular biology grade mineral oil (Thermo Fisher Scientific, Waltham, MA). Samples were then incubated in an Applied Biosystems 7500 thermal cycler for 30 minutes at 65 °C followed by 2 minutes at 4 °C.

Sample-to-answer procedure using paper supports

Serial dilutions of heat-inactivated CT LGVII cells were made from 105 to 10 cells per 100 μl of synthetic urine. Controls using only synthetic urine and 104 copies of CT DNA in synthetic urine were also used. The 100 μl sample solution was placed onto the paper support in the pipette tip and pressurized to 20 psi. Sample flow through was collected and PCR run on the flow through to determine the amount of cells and/or DNA that flowed through each tip. In additional experiments, samples of 105 filtered cells or 104 copies of DNA were washed with two 50 μl washes to determine if exogenous DNA in the cell samples was captured in the tips. Three replicate experiments were performed on three separate days to confirm repeatability of the procedures.

For in situ amplification in pipette tips with paper supports following cell filtration onto the supports, the base of the pipette tips was first sealed with waterproof adhesive (3M Packing tape). Twenty five μl of tHDA master mix solution was then added to the captured cells on the paper supports in pipette tips and overlaid with mineral oil. Pipette tips were flicked gently to ensure that solutions were in contact with the captured cells and then placed into a 65 °C dry-block heater for 30 minutes. At the end of the reaction, tips were placed on ice. Amplified samples were then released from the tips by removing the adhesive and pushed through the paper or PPM support at 20 psi into a collection tube.

tHDA amplicons from the paper supports were detected with lateral flow detection (LFD) strips with antibodies against FAM and biotin (UStar Biotechnologies, Hangzhou, China). Ten μl of amplified solution was eluted onto to the capture matrix of the strip followed by 200 μl of the manufacturer supplied buffer solution. After 10 minutes of incubation at room temperature, the detection lines on the LFD strips were visible by eye in positive amplification reactions. As seen in Table 3, the entire sample-to-answer process can be performed in less than one hour and requires only 325 μl of liquid. To further quantify the band intensity of results, the strips were also photographed using a Versadoc Gel Imager (BioRad, Hercules, CA) and intensity of the control and detection bands was determined using the gel analysis function in ImageJ (National Institute of Health, Bethesda, MD). Intensity of detection bands is reported as percentage of control band intensity. Amplification was additionally confirmed via 10% polyacrylamide gel electrophoresis. Experiments were performed in triplicate on three separate days to ensure repeatability of the technique. Select bands at the expected amplicon size were extracted and sequenced to ensure proper amplification of tHDA products. Details of the gel extraction procedure and results of sequencing are available in the ESI.

Table 3 Overview of sample-to-answer steps
Assay step Volume added (μl) Time (min)
Cell sample filtration 100 5
tHDA mastermix addition 25 2
tHDA 30
Elution 1
Lateral flow detection 200 10
Total 325 50


Proof of concept sample-to-answer procedure for point of care

Replicates of 105 heat-inactivated CT LGVII cells in 100 μl of synthetic urine, in addition to a positive control of 104 copies of CT DNA per 100 μl of the urine, and negative urine only control were used for experiments. The 100 μl samples were each pipetted on top of paper supports in pipette tips which were then fitted onto 200 μl Gilson brand pipettes. The pipettes were pressed down fully and taped in this position to pressurize the filtration of the sample through the paper-based support.

Once the liquid had filtered through the pipette, electricity-free, in situ, amplification of the sample was performed using toe warmers in Styrofoam cups to heat the tHDA reaction components to 65 °C, as described previously by Huang et al.18 Briefly, 25 μl of tHDA mastermix was applied to each pipette, tip and the tips were sealed with waterproof adhesive. They were then placed side by side and sandwiched between two toe warmers. The assembly was then placed into a Styrofoam cup with 63 holes punched out on either side of the cup in order to provide airflow to the reaction and control the temperature for 35 minutes.

tHDA amplicons from the paper supports were detected with LFD strips as above. The amplicons were eluted onto the sample pad without the need for pressure. The end of the pipette tip was cut off and the paper support was pushed back into the pipette tip using a ten μl pipette tip. This allowed the liquid to flow from the pipette tip onto the capture matrix of the strip. Experiments with all samples and controls were performed on two separate days to confirm repeatability of the procedure.

Statistical analysis

The mean and standard deviation of tests performed on three separate days were calculated for detection band intensity (% of control) from tHDA experiments and for numbers of gene copies in PCR amplification experiments. In flow rate analyses, the minimum, maximum, median, 25th percentile, and 75th percentile, were analyzed to compare paper versus polymer tips. Two-tailed, unpaired, Student's t-tests were used to determine statistical significance of differences of sample conditions versus the negative control condition in experiments.

Results

Comparison of paper to polymer extraction supports

The fabrication, structure, and flow rates were compared in paper-based extraction supports versus polymer μSPEs (Fig. 2). Paper-based extraction and amplification supports were assembled in less than 10 minutes. This assembly and testing required in less than 1% of the time necessary for polymer supports (Fig. 2A). Flow rates were compared by pushing 70% ethanol through the extraction supports at 20 psi. While reproducibility of flow rates through paper extraction supports was lower than polymer μSPEs, batches of both extraction types were >90% reproducible. Additionally, paper supports that exceeded the initial maximum flow rates (300 μl min−1) could be re-compressed into the pipette tips a second time, and were then within the specified range. The microarchitecture of paper supports was fibrous as compared to the globular polymer support structures. However, these features have similar sizes, as visible in the SEM images in Fig. 2B. As seen in Fig. 2C, flow rates through paper supports were significantly slower than through polymer supports (p < 0.0005 using Student's t-test). These reduced flow rates provide a longer time for DNA and cells to precipitate out of solution onto the support during subsequent extraction and filtration experiments.
image file: c4ra07911f-f2.tif
Fig. 2 Comparison of 20 replicate paper and polymer extraction supports. (A) Comparison of flow rates and assembly times of paper and original polymer devices. (B) SEM images of paper (top) and polymer (bottom) extraction supports. White bars are 200 μm for larger images and 2 μm inset images. (C) Flow rate comparison of extraction supports that met the 30 to 300 μl min−1 flow requirements. Boxplots show the 25th and 75th percentile as the box boundaries with the middle line indicating the median (50th percentile) measurement value. Minimum and maximum values are marked by the whiskers. *p < 0.005.

Chlamydia cell lysis and DNA purification in paper supports

The paper supports were first tested for their DNA extraction capabilities using single-step alcohol precipitation methods previously developed for polymer-based extraction supports.16 The single-step lysis and extraction buffer was mixed with samples to extract DNA from CT cells in simulated urine samples. Downstream amplification of the extracted DNA using real-time PCR resulted in a limit of detection at the lowest concentration tested, 10 cells per sample (Fig. 3A). Theoretical 100% recovery of DNA from cells, assumes an average of four copies of the cryptic plasmid target contained within each CT cell.17
image file: c4ra07911f-f3.tif
Fig. 3 Detection of downstream tHDA products from CT lysates that were extracted using the paper extraction supports. (A) PCR amplification of CT lysates extracted using the paper supports, n = 3. (B) Lateral flow detection of downstream tHDA products. Error bars represent standard deviations of 3 replicate samples. *p < 0.05. (C) ImageJ analysis of the band intensity from lateral flow assays. (D) Gel electrophoresis confirming detection of CT.

Isothermal amplification of the products via tHDA resulted in a detection limit of 10[thin space (1/6-em)]000 cells via lateral flow assay through visual inspection (Fig. 3B) and ImageJ quantification of the intensity of lateral flow assay bands (Fig. 3C) (p < 0.05). Visual detection by eye was possible when detection lines were at least 25% of the control line intensity. Polyacrylamide gel electrophoresis confirmed amplification of the products from as few as 10[thin space (1/6-em)]000 extracted cells with the expected amplicon size (91 base pairs) (Fig. 3D) and sequence (data available in ESI). Positive controls using CT DNA without cells were also detected by lateral flow and gel electrophoresis. As noted in Fig. 3, detection from as few as 100 cells was possible in some instances, but this was not statistically significant compared to the no cell controls.

Cell filtration onto paper extraction supports

Initial experiments were performed to determine the amount of cellular DNA in the flow through from the paper supports. These were followed by additional rinses to collect any potential extracellular DNA in the sample as this DNA could contribute to amplification even when cells remained unlysed. In samples containing 105 cells, an average of 4.4% of the total DNA was collected in the initial flow through (range 0 to 11%). However, the subsequent washes contained an average total of only 0.18% (180 copies) of the total cellular DNA that would otherwise have been available for amplification in the tips (range 0 to 0.4%). Of note, following these rinses, in situ amplification by tHDA and lateral flow detection still occurred indicating that the free DNA in the rinses was not the cause of amplification inside of the tips (data not shown).

Chlamydia cells filtered and amplified in situ on paper supports

The paper supports were then used in the sample-to-answer analysis of CT cell load. Preliminary experiments confirmed the ability to amplify and detect whole CT cells in 0.2 ml tubes from as few as 50 cells via lateral flow strips (data not shown). In sample-to-answer experiments, CT cells were first filtered directly onto the paper supports followed by isothermal amplification in situ and detection by lateral flow. Repeatable cell lysis, DNA amplification, and detection occurred from samples containing as few as 1000 cells (Fig. 4A). ImageJ analysis of the intensity of lateral flow assay bands confirmed statistically significant extraction detected at this concentration compared to the no cell control (p < 0.05) (Fig. 4B). Further gel electrophoresis also confirmed the detection of CT cells at the appropriate band size (Fig. 4C).
image file: c4ra07911f-f4.tif
Fig. 4 Detection of tHDA products from CT cells that were filtered on paper supports and amplified in situ. (A) Lateral flow detection, n = 3. Error bars represent standard deviations. *p < 0.05 (B) ImageJ analysis of the band intensity from lateral flow assays. (C) Gel electrophoresis confirming detection of CT.

Proof of concept sample-to-answer procedure for point of care

Experiments requiring zero electricity were performed to demonstrate the utility of the procedure at the point of care. These experiments combined the use of pipettes as pressurization instruments for sample preparation, toe warmers as heaters for thermally induced cell lysis and in situ amplification, and lateral flow strips for detection. As seen in Fig. 5, the entire sample-to-answer procedure can be performed successfully even when a pressure manifold and dry-block tube block are not available.
image file: c4ra07911f-f5.tif
Fig. 5 Detection of tHDA products from CT cells and controls that were filtered onto paper supports, amplified in situ, and eluted onto LFD strips without the use of electricity.

Discussion

The United States Center for Disease Control (CDC) urges STI clinics to test patients with POC tests whenever health care workers suspect that these patients are unlikely to return to the clinic to learn the results of the test.19 Moreover, CT is the most common bacterial infection in the United States and clinicians' number one request for someone to develop a new POC STI test.20 While the average CT cell load is between 50 and 2200 cells per 100 μl in urogenital samples,5 current immunoassay based POC tests have a lower limit of detection as high as 100[thin space (1/6-em)]000 organisms.6 Thus, many patients are not detected as positive and remain untreated. In contrast, the paper-based sample-to-answer molecular test described herein has 100× better lower limit of detection, lowering this threshold to 1000 cells.

While polymer μSPEs require extensive chemical and environmental process controls to ensure repeatable nucleic acid capture, the paper-based supports can be assembled in less than 1% of the time and with minimal resources. Furthermore, assembly of the paper supports results in no hazardous chemical wastes for disposal.

By performing the amplification step within the paper support, the device removes the need to elute DNA following sample preparation. Thus, DNA from the entire population of captured cells is available for amplification in situ rather than from only a fraction of the eluted sample. Furthermore, the direct amplification of cells filtered onto paper supports minimizes the time and overall liquid volume required for sample preparation (Table 1). The combination of sample preparation with amplification in the same matrix has not previously been reported using either polymer or paper-based supports. We then utilized lateral flow strips to further simplify the assay so that it required only visual detection by eye to determine if the input sample contained CT cells.

The entire sample-to-answer process required only ∼50 minutes to perform. This is the same amount of time as the sample preparation alone using the more traditional chemical lysis and precipitation for downstream DNA amplification. Sample preparation and amplification in situ also allows a 10× larger volumes of sample solution than the precipitation method (100 μl versus 10 μl) allowing for the capture of more bacterial cells on the support and improving sensitivity by 10×.

Utilizing isothermal amplification, the paper-based molecular diagnostic described herein has a lower limit of detection that is 100× more sensitive than current rapid immunoassay diagnostics for CT. This 1000 cells per sample detection limit has the potential to be further improved by the addition of gold or silver enhancement to the lateral flow detection step. Previous studies by Rohrman et al. have shown 4-fold enhancement of detection by utilizing gold enhancement step following detection.21 The initial studies of downstream amplification of the extracted samples via tHDA compared to PCR show that PCR was 100× more sensitive than the tHDA assay. The sensitivity of tHDA can also be improved by increasing the amplification time beyond 30 minutes. However, these potential improvements in sensitivity must be weighed against the total assay time and complexity.

This paper-based molecular extraction, amplification and detection platform can be used at the point of care in low-resource settings where electricity may not be available. While a multiplex in-house pressure manifold was utilized for the convenience of replicating most samples, we have shown that a pipette can easily be substituted to filter cells onto the paper supports. While the exact pressure in a pipette is not easily controlled, we have previously shown that a syringe pump, or even a bicycle pump could have been substituted to reach 20 psi.10 A dry-block tube heater set to 65 °C was used for the majority of isothermal amplification experiments. However, as a proof of concept, toe warmers based on an iron-oxide exothermic reaction, were also utilized to show that an electricity-free heat sources can be substituted. Of note, alternative reactions based on phase change materials could also have been used instead without the need for electricity.22 By combining the use of pressurization via pipette, heating via iron-oxide and visual detection via lateral flow strips, we have proven that the entire sample-to-answer process can be performed at the point of care even without electricity.

In these experiments, we show that combined isothermal lysis and amplification can be successfully utilized to extract and amplify DNA from CT cells in synthetic urine. Thermally induced lysis of Gram negative cells is well-established in the use of colony PCR and has been investigated previously in E. coli.23 These studies by Packard et al. show that greater than 90% of cell viability is lost when E. coli were heated to 60 °C for 15 seconds. Because the Chlamydia cells utilized in the current study were already heat-inactivated, we performed additional experiments to detect the presence of exogenous DNA in these samples. An average of 0.18% of the total copies of DNA were extracellular and able to be washed from the pipette tips. Following the wash, in situ amplification of cellular DNA still occurred. Thus, we do not anticipate that this small quantity of exogenous DNA contributed to the amplification at any of the detectable sample loads.

This work can be extended to other Gram-negative bacterial species. More robust Gram positive and mycobacterium cell types will likely require more vigorous mechanical and enzymatic lysis methods, however, in situ tHDA using thermal lysis may be appropriate for the majority of Gram negative human pathogens.

Conclusions

We have demonstrated minimally instrumented paper-based sample preparation, amplification, and detection of CT cells from synthetic urine. This process shows for the first time that whole cell filtration onto a paper matrix followed by heat lysis and in situ tHDA that is then eluted onto lateral flow strips can be used for visual detection and confirmation of disease state. Furthermore, it improves the lower detection limit by roughly 100× compared to traditional rapid diagnostic tests. The robust capture of whole cells trapped within the paper support minimizes the hands-on steps, time to result, and bio-hazardous liquid waste. This minimally instrumented paper-based platform enables point of care molecular detection of bacteria.

Acknowledgements

This research was funded by the National Institute of Health under grant number STTR 5U01AI082522.

References

  1. CDC, 2011 Sexually Transmitted Diseases Surveillance, Center for Disease Control and Prevention, Atlanta, GA, 2011 Search PubMed .
  2. M. Laga, A. Manoka, M. Kivuvu, B. Malele, M. Tuliza, N. Nzila, J. Goeman, R. Behets, V. Batter and M. Alary, AIDS, 1993, 7, 95–102 CrossRef CAS PubMed .
  3. D. T. Fleming and J. N. Wasserheit, Sex. Transm. Infect., 1999, 75, 3–17 CrossRef CAS .
  4. C. A. Gaydos, C. Farshy, M. Barnes, N. Quinn, P. Agreda, C. A. Rivers, J. Schwebke and J. Papp, Diagn. Microbiol. Infect. Dis., 2012, 73, 16–20 CrossRef PubMed .
  5. C. E. Michel, C. Sonnex, C. A. Carne, J. A. White, J. P. Magbanua, E. C. Nadala Jr and H. H. Lee, J. Clin. Microbiol., 2007, 45, 1395–1402 CrossRef PubMed .
  6. L. van Dommelen, F. H. van Tiel, S. Ouburg, E. E. Brouwers, P. H. Terporten, P. H. Savelkoul, S. A. Morré, C. A. Bruggemanand and C. J. Hoebe, Sex. Transm. Infect., 2010, 86, 355–359 CrossRef PubMed .
  7. R. W. Peeling, Open Infect. Dis. J., 2009, 156–163 CrossRef .
  8. K. A. Wolfe, M. C. Breadmore, J. P. Ferrance, M. E. Power, J. F. Conroy, P. M. Norris and J. P. Landers, Electrophoresis, 2002, 23, 727–733 CrossRef CAS .
  9. M. D. Kulinsk, M. Mahalanabis, S. Gillers, J. Y. Zhang, S. Singh and C. M. Klapperich, Biomed. Microdevices, 2009, 11, 671–678 CrossRef PubMed .
  10. S. Byrnes, A. Fan, J. Trueb, F. Jareczek, M. Mazzochette, A. Sharon, A. F. Sauer-Budge and C. M. Klapperich, Anal. Methods, 2013, 5, 3177–3184 RSC .
  11. A. V. Govindarajan, S. Ramachandran, G. D. Vigil, P. Yager and K. F. Bohringer, Lab Chip, 2012, 12, 174–181 RSC .
  12. B. A. Rohrman and R. R. Richards-Kortum, Lab Chip, 2012, 12, 3082–3088 RSC .
  13. M. Vincent, Y. Xu and H. Kong, EMBO Rep., 2004, 5, 795–800 CrossRef CAS PubMed .
  14. H. Kim, Y. Tong, W. Tang, L. Quimson, V. A. Cope, X. Pan, A. Motre, R. Kong, J. Hong, D. Kohn, N. S. Miller, M. D. Poulter, H. Kong, Y. Tang and B. Yen-Lieberman, J. Clin. Virol., 2011, 50, 26–30 CrossRef CAS PubMed .
  15. R. Boom, C. J. Sol, M. M. Salimans, C. L. Jansen, P. M. Wertheim-van Dillen and J. van der Noordaa, J. Clin. Microbiol., 1990, 28, 495–503 CAS .
  16. A. Fan, S. Byrnes and C. Klapperich, Methods Mol. Biol., 2013, 949, 403–411 CAS .
  17. M. A. Pickett, J. S. Everson, P. J. Pead and I. N. Clarke, Microbiology, 2005, 151, 893–903 CrossRef CAS PubMed .
  18. S. Huang, J. Do, M. Mahalanabis, A. Fan, L. Zhao, L. Jepeal, S. K. Singh and C. M. Klapperich, PLoS One, 2013, 8, e60059 CAS .
  19. CDC, Morbidity and Mortality Weekly Report (MMWR), Center for Disease Control and Prevention, Atlanta, GA, 2002, pp. 1–40 Search PubMed .
  20. Y. H. Hsieh, C. A. Gaydos, M. T. Hogan, J. Jackman, M. Jett-Goheen, O. M. Uy and A. M. Rompalo, Point of Care, 2012, 11, 126–129 Search PubMed .
  21. B. A. Rohrman, V. Leautaud, E. Molyneux and R. R. Richards-Kortum, PLoS One, 2012, 7, e45611 CAS .
  22. P. LaBarre, K. R. Hawkins, J. Gerlach, J. Wilmoth, A. Beddoe, J. Singleton, D. Boyle and B. Weigl, PLoS One, 2011, 6, e19738 CAS .
  23. M. M. Packard, E. K. Wheeler, E. C. Alochilja and M. Shusteff, Diagnostics, 2013, 3, 105–116 CrossRef PubMed .

Footnote

Electronic supplementary information (ESI) available. See DOI: 10.1039/c4ra07911f

This journal is © The Royal Society of Chemistry 2014
Click here to see how this site uses Cookies. View our privacy policy here.