DOI:
10.1039/C4RA07899C
(Paper)
RSC Adv., 2014,
4, 49098-49107
Green bionanocomposites from high-elasticity “soft” polyurethane and high-crystallinity “rigid” chitin nanocrystals with controlled surface acetylation†
Received
31st July 2014
, Accepted 15th September 2014
First published on 15th September 2014
Abstract
Castor oil-based polyurethane bionanocomposites with improved mechanical properties were prepared by the introduction of crab chitin nanocrystals from partial surface acetylation. Through controlled acetylation, some of the hydrophilic hydroxyl groups on the nanocrystals were replaced by hydrophobic acetyl groups in order to enhance the compatibility between the chitin nanoparticles and polyurethane; and some of the hydroxyl groups were preserved on the surface of nanocrystals for the purpose of rigid network formation among chitin nanoparticles. The presence of acetylated chitin nanocrystals at moderate concentration (6 wt%) will significantly promote the nano-reinforcing effect in composites, and simultaneously improved the strength, stiffness and toughness of thermoplastic polyurethane-based nanocomposites. Meanwhile, derived from the restriction of rigid nanocrystals to soft segments, the glass transition temperatures of the nanocomposites surprisingly increased with the higher loading levels of acetylated chitin nanocrystals. More importantly, this study provided a strategy for the discussion of synergistic effects and “trade-off” of adequate dispersion, network formation and interfacial adhesion of rigid nanoparticles in soft polymeric matrices, by means of structure and properties analysis of semi-transparent polyurethane/acetylated chitin nanocrystals composites.
Introduction
Since the first industrial application of polymer nanocomposites based on polyamide and layered silicates (named Nylon-6),1 the development of nanoengineered polymeric composites has attracted great interest, and rapidly triggered a new class of materials as an alternative to conventional materials over the last twenty years. Derived from the reinforcement effect of nanofillers, physical properties of composites can be improved at the molecular level without affecting polymer processability, such as better mechanical performance, thermal stability and barrier properties. Rubber, also called elastomer, is widely used as a polymeric matrix for nanocomposites due to its high elasticity and high elongation at break, but low hardness for the limitations of practical applications. The challenges of elastomer-based nanocomposites are that they require optimum nano-reinforcement through well-dispersed nanofillers inducing good adhesion on the matrix/filler interface, and improving the stiffness of elastomer without sacrificing its high extensibility.2 Although diverse rubber nanocomposites have been discussed by the introduction of numerous potential nanoelements, most studies focus on the use of layered silicates, carbon nanotubes and inorganic nanoparticles (mainly silica).3
Recently, considering the ecological and environmental pressure and the instable cost of petrochemicals, there is an increasing demand for biobased nanofillers from natural resources in the polymer industry to produce low-cost and biodegradable materials. Isolated from the second most abundant natural polymer, chitin nanocrystals (with the synonyms of chitin (nano)whisker and nanocrystalline chitin) are the crystalline component extracted from native chitin, such as the exoskeleton of arthropods like crabs, shrimp, squid pens, etc.4 The first investigation into the preparation of chitin nanocrystals in 1959 was achieved by the treatment of chitin microfibrils with hydrochloric acid solution.5 During acid hydrolysis, disordered and low lateral ordered regions of chitin are preferentially hydrolyzed and dissolved in the acidic solution, whereas water-insoluble, highly crystalline residues that have higher resistance to acid attack remain intact. Indeed, both nanofibers and nanocrystals can be isolated from chitin sources, but only chitin nanocrystals (ChN) occur as highly crystalline and rigid rod-like (or needle-like) nanoparticles, possessing superior mechanical stiffness (at least 150 GPa),6 making it an ideal candidate as a reinforcing bionanofiller for polymer composites. Nanocomposites incorporating ChN as the reinforcing phase have been reported with diverse matrices involving natural polymers (such as natural rubber, chitosan, alginate, hyaluronan, silk fibroin, soy protein isolate and starch) and synthetic polymers (for instance acrylic resin, poly(S-co-BuA), polycaprolactone, poly(vinyl alcohol) and waterborne polyurethane).7,8
As rigid nanoparticles, the presence of chitin nanocrystals in soft polymers will induce the promising enhancements for composites that are expected to develop special-mechanical nanocomposites with both high strength and tenacity. Attempts at reinforcing soft elastomer with pristine ChN have been reported previously with natural rubber9,10 and water polyurethane.11–13 However, direct incorporation of pristine ChN with hydrophobic polymers may cause a weak interfacial interaction due to the high hydrophilicity and serious self-aggregation of ChN in apolar matrices. Therefore, one study proposed chemical modification to tailor the surface properties of ChN and improve the compatibility of nanoparticles and natural rubber in composites. However, treatment with phenyl isocyanate, alkenyl succinic anhydride, or 3-isopropenyl-α,α′-dimethylbenzyl isocyanate to the surface of ChN limits the hydrogen bonding interactions between nanoparticles after these modifications and reduces the driving force for network formation, which causes the poor reinforcing effect and, ultimately, loss of mechanical properties.14
Surface acetylation is generally considered to be a simple, popular and inexpensive approach to chemical modification to change the surface polarity of chitin.15 In our previous studies, surface acetylation has been performed on cellulose nanocrystals (CNC)16,17 and has been proved to be able to control the degree of acetylation with the regulation of acetylated agent ratios and reaction conditions. Partial surface acetylation was performed on ChN for the purpose of both improvement of dispersion and interfacial adhesion between nanocrystals and polymers (filler/matrix), as well as preservation of interactions among nanoparticles for the formation of a rigid network. This controlled surface acetylation was achieved by the reaction between acetic anhydride and chitin nanocrystals, which partially converted the hydrophilic hydroxyl groups (–OH) to hydrophobic acetyl groups (–COCH3). In addition, castor oil-based polyurethane (PU) elastomer was chosen as the polymeric matrix reinforced by acetylated chitin nanocrystals, which was composed of castor oil as soft segments and a diisocyanate as hard segments. Castor oil is a low-cost, abundantly available, renewable natural resource, and has attracted intensive research resulting from its wide applications in coatings, adhesives, paints, sealants, encapsulating compounds, etc.18,19 Recently, as a polyester macroglycol with reactive hydroxyl functional groups, castor oil has been reported as a superior raw material to prepare bio-based elastomeric polyurethane or waterborne polyurethane materials.20–24
The main objective of this study is to determine the properties, investigate the interface and discuss the enhancing effects of acetylated chitin nanocrystals (rigid nanoparticles) in thermoplastic polyurethane (soft polymer). It is expected that possible interactions between additional carbonyl groups from acetylated chitin nanocrystals and ester groups from castor oil will facilitate the compatibility of nanoparticles and polyurethane. Meanwhile, partial acetylation on the chitin nanocrystals ensured the preservation of some hydroxyl groups for the formation of a rigid network through hydrogen bonding between nanoparticles. The results of four aspects are included in this work, which are proofs and properties of acetylated chitin nanocrystals, appearance and light transmittance ratio of composites, mechanical and thermal properties of composites, and crystalline properties and microstructure of composites. The degree of acetylated substitution (DS) on chitin nanocrystals was calculated from the results of elemental analysis, and the effect of surface modification on the morphology and dimensions of nanocrystals was observed by transmission electron microscopy. Atomic force microscopy was used to investigate the surface appearance of composites, and the results from UV-spectroscopy proved the semi-transparent property of prepared composites. Fourier transform infrared spectroscopy was performed to investigate the presence of modified chitin nanocrystals in the microstructure of composites, together with the observation of the inner morphology with scanning electronic microscopy. The mechanical performance and thermal properties of the nanocomposites were further studied, involving the discussion of reinforcing mechanisms and the formation of a percolating network.
Experimental section
Materials
Castor oil with a hydroxyl value of 163 mg –OH g−1 was purchased from Shanghai Sinopharm Chemical Reagent Ltd. (Shanghai, China) and vacuum dried at 110 °C for 2 h before use. Native chitin from crab shell was purchased from Yuhuan Ocean Biochemical Ltd. (Zhejiang, China). Acetic anhydride and pyridine were purchased from Xilong Chemical Industry Ltd. (Shantou, China), and dried and purified according to standard procedures. 2,4-Toluene diisocyanate (TDI ≥ 98%) was purchased from Wuhan Jiangbei Chemical Reagent Ltd. (Hubei, China). 1,4-Butanediol, sulfuric acid, tetrahydrofuran (THF) and other analytical grade reagents were used without further purification.
Extraction of chitin nanocrystals (ChN)
Chitin nanocrystals were extracted from crab shell chitin following a previous report.25 Briefly, crab chitin was boiled and mechanically stirred in the 5 wt% KOH solution to remove most of the proteins, and then bleached with NaClO2 solution for 6 h at 80 °C. The bleached suspension was kept in another 5 wt% KOH solution for 48 h to remove residual proteins. Purified chitin was hydrolyzed with boiling 3 N HCl for 90 min under mechanical stirring, and followed by treatments of washing, centrifugation and dialysis with distilled water. Chitin nanocrystals in white powder were released from freeze-drying.
Acetylation of chitin nanocrystals (AChN)
Surface acetylation of chitin nanocrystals was performed with constant stirring under a nitrogen atmosphere in a three-necked round-bottomed flask equipped with a condenser. The suspension of chitin nanocrystals (1.0 g) and anhydrous pyridine (20 mL) was dispersed by ultrasonic treatment for 15 min. A chemical reaction between acetic anhydride (AA) and chitin nanocrystals was started by the addition of 5 mL AA in anhydrous pyridine solution to the dispersed ChN suspension. The reaction mixture was kept at 80 °C and stirred at 400 rpm (revolutions per minute) for 5 h. After the reaction, acetylated ChN was isolated by the precipitation of the suspension in 1.0 L distilled water, and purified by washing with a solution of acetone/water to eliminate all non-bonded chemicals (i.e., unreacted compounds and reaction by-products). The acetylated chitin nanocrystal powder was released from freeze-drying, and coded as AChN. The chemical reaction for surface acetylation of chitin nanocrystals is shown in Fig. 1(A).
 |
| Fig. 1 (A) Partial surface acetylation of chitin nanocrystals from chemical reaction between hydroxyl groups (C6–OH) and acetic anhydride. (B) Chemical structure of NCO terminated polyurethane prepolymers. (C) Synthesis procedure of polyurethane materials and chemical structures of castor oil. | |
Synthesis of castor oil-based polyurethane (PU) prepolymer
The castor oil-based polyurethane prepolymer was prepared following the method reported by Gao and Zhang with a little modification.26 Castor oil was dropped into the flask with the desired amount of toluene diisocyanate under a nitrogen atmosphere. The dropping was completed within 30 min, and then the stirring was maintained for 2 h to obtain the PU prepolymer. It should be noted that during the synthesis of the PU prepolymer, the value of [NCO]/[OH] in the system was controlled at 2. The chemical structure of NCO terminated PU prepolymer is shown in Fig. 1(B).
Preparation of PU/AChN nanocomposites
PU prepolymer (5 g) was mixed with the desired mass of AChN and 1,4-butanediol as the chain extender in tetrahydrofuran (THF) at room temperature. The value of [NCO]/[OH] in the system was regulated at 1 via the addition of 1,4-butanediol. Fig. 1(C) shows the chain extension reaction between the prepolymer and butanediol, together with the synthesis of castor oil-based PU material. About 30 wt% THF was added to the resulting mixture with solid content (nonvolatile components) and cast on the polytetrafluoroethene mold. The mixture was cured at room temperature for two days to evenly evaporate the solvent, and formed dried films with a thickness of about 0.5 mm. The prepared PU/AChN nanocomposites containing different AChN contents (2, 4, 6, 8, 10 wt%) were coded as PU/AChN-2, PU/AChN-4, PU/AChN-6, PU/AChN-8 and PU/AChN-10. Meanwhile, neat PU film was prepared and coded as PU according to the aforementioned process without the addition of AChN. All the films were vacuum-dried at room temperature for 3 days before measurements were taken.
Analysis and characterization
Elemental analysis. Carbon (C%), nitrogen (N%) and hydrogen (H%) contents were obtained from elemental analysis (Elementar Vario EL cube, Germany). The precision of measurement is 0.01% for C and N, and 0.001% for H. The degree of acetylated substitution (DSsurface acetyl) for AChN was calculated according to eqn (1): |
 | (1) |
where nsurface acetyl is the amount of surface acetyl groups on AChN (without considering the acetyl group on C-2 itself), nsurface-OH is the amount of surface hydroxyl groups on the nanocrystals, and ΔC% is the increment of carbon content after surface acetylation (ΔC% = C%AChN − C%ChN).
Morphology and dimensions. The morphology of the acetylated chitin nanocrystals was observed with transmission electron microscopy (TEM), which was carried out on an H-7000FA electron microscope (Hitachi, Tokyo, Japan) at 75 kV. Aqueous suspension (about 0.1 wt%) containing AChN was homogeneously dispersed with ultrasonic treatment, and then negatively stained with a 2% (w/v) uranyl acetate in ethanol solution before the observation. The dimensions of AChN, including length (L) and width (W) of nanoparticles, were measured using Nano Measurer software. Over 100 rod-like nanocrystals from 10 TEM images were statistically analyzed to determine the average length, width, and distribution.
Crystalline property. The transformation of the crystalline structure for chitin nanocrystals before and after modification as well as the crystalline properties of the nanocomposites were analyzed using X-ray diffraction analysis (XRD). XRD measurements were performed on a D/Max-IIIA X-ray diffractometer (Rigaku Denki, Tokyo, Japan) at ambient temperature, with Cu Ka radiation (λ = 0.154 nm) at 40 kV and 60 mA. The diffraction angle of 2θ ranged from 5 to 50°.The crystallinity indexes (CrI2θ) of ChN and AChN were calculated according to the Segal equation:
|
 | (2) |
in
eqn (2),
I2θ is the overall intensity of the peak at 2
θ, and
Iam represents the intensity of amorphous diffraction at 16.0°.
The crystalline dimensions of different planes of nanocrystals were calculated according to the Scherrer equation:
|
 | (3) |
in
eqn (3),
Bhkl is the average crystalline width of a specific plane;
K is a constant (indicative of crystallite perfection and assumed to be 0.9);
λ represents the wavelength of incident X-rays (
λ = 0.15418 nm);
θ is the center of the peak; and
β1/2 (in radians) represents the full width at half maximum (FWHM) of the reflection peak.
Simultaneous thermal analysis (STA: TG/DSC). The STA technique is useful for the determination of decomposition temperatures and steps for solid samples. STA involves simultaneous thermogravimetric analysis and differential scanning calorimetry analysis. The thermal degradation of native chitin, ChN and AChN were analyzed by an STA 449G Jupiter thermal analyzer (Nietzsch, Germany) under air flow. Samples of ca. 10 mg were heated from 20 to 600 °C at a heating rate of 10 °C min−1.
Atomic force microscopy (AFM). The surface morphology of PU/AChN nanocomposites was investigated by AFM under QNM mode analysis. The film sample was placed on the surface of steel substrate, which was scanned at a frequency of <1 Hz, and the rate was changed according to the scan size.
Transmittance of visible light. The light transmittance ratios of nanocomposites were measured with a Shimadzu UV 2401-(PC) UV-vis spectrophotometer. The film samples were cut at 40 mm × 35 mm, and analyzed within a wavelength range of 200–800 nm. The transmittance spectra were acquired using air as background. The resolution of the spectrophotometer was 1.5 nm and the photometric accuracy was ±0.01 in absorption.
Tensile measurements. The tensile strength (σb), elongation at break (εb) and Young's modulus (E) were measured on a CMT6503 universal testing machine (SANS, Shenzhen, China) with a crosshead rate of 10 mm min−1 according to the ISO 527-3:1995(E) protocol. The tested specimens were cut into quadrate strips with a width of 10 mm, and the distance between testing marks was 30 mm. The average value of at least five replicates was calculated for each sample.
Differential scanning calorimetry (DSC). The thermal properties of PU/AChN nanocomposites were characterized by DSC analysis on a DSC-instrument (Diamond DSC, PerkinElmer, MA) under a nitrogen atmosphere at a heating or cooling rate of 20 °C min−1. The nanocomposite samples were scanned over a range of −50 to 200 °C after a pretreatment of heating from 20 to 100 °C and then cooling to −50 °C to remove any residual solvents or other volatiles.
Fourier transform infrared spectroscopy (FTIR). The hydrogen bonding interactions in PU/AChN nanocomposites were investigated by FTIR spectra, which were recorded on a 5700 FTIR spectrometer (Thermo Fisher, Madison, WI). The nanocomposite samples were scanned in the range of 4000–600 cm−1.
Scanning electron microscope (SEM). The microstructures of the PU/AChN nanocomposites were observed on SEM, which were carried out on an X-650 scanning electron microscope (Hitachi, Tokyo, Japan) with an accelerating voltage of 25 kV. Before the observation, all films were frozen in liquid nitrogen and then immediately snapped. The fractured surfaces of the sheets were sputtered with gold and then observed and photographed.
Results and discussion
Acetylation and properties of chitin nanocrystals
The feasibility of surface acetylation on chitin nanocrystals with acetic anhydride has been validated by the results of solid state 13C cross polarization-magic angle spinning (CP-MAS) NMR spectra and FT-IR in our previous study.27 Here, the DS value of surface acetyl groups to surface hydroxyl groups (nsurface-OH) was calculated from the change of carbon contents in nanocrystals before and after modification. Table 1 summarizes the results from elemental analysis and estimates DSsurface acetyl value according to eqn (1). In general, because the acetylation was controlled on the surface of the chitin nanocrystals, the change of elemental content was slight. However, the carbon content of acetylated chitin nanocrystals (AChN) significantly increased due to the replacement of hydroxyl groups by acetyl groups on the nanocrystals. The change of C/N ratios for the nanocrystals before and after modification further proved the presence of acetylation on the surface of the nanoparticles. Before the estimation of the surface acetyl degree of substitution (DSsurface acetyl) for AChN, the total amount of surface active hydroxyl groups (nsurface-OH) on chitin nanocrystals was calculated from theoretical models of nanocrystals,28 which was about 1.55 mmol g−1 (detailed calculation is shown in ESI†). Then, the DSsurface acetyl of AChN (corresponding to surface hydroxyl groups) was estimated as 51.1% according to eqn (1), which indicated that about half of the surface hydroxyl groups were substituted by acetyl groups during the modification. Due to the different reactivities of the two hydroxyl groups in the structure of chitin (generally accepted as C6–OH > C3–OH), this result reflected the substitution of one hydroxyl groups (C6–OH) and the preservation of another hydroxyl group (C3–OH). Consequently, using the reaction conditions in this study (reagent ratio of 1.0 g ChN/5 mL AA, reaction duration of 5 h), partial surface acetylation of chitin nanocrystals can be achieved, and the original crystalline structure of nanocrystals can also be preserved (as discussed in the following results). In fact, different reagent ratios and durations of acetylation were also attempted on chitin nanocrystals in our experiments (with the range of 1.0 g ChN/2–10 mL AA for 2–12 h), which proved the controllability of varied DSsurface acetyl for chitin nanocrystals by changing the reaction conditions of this method.
Table 1 Dimensions (average length L and diameter D) of ChN and AChN were obtained from TEM images; carbon (C%), nitrogen (N%) and hydrogen (H%) contents for chitin nanocrystals before and after acetylation (ChN and AChN) were measured by elemental analysis; amount of surface hydroxyl groups (nsurface-OH) of chitin nanocrystals was calculated with theoretical models (ESI); and surface acetyl degree of substitution (DSsurface acetyl) for AChN was calculated according to eqn (1)
Samples |
Length (nm) |
Diameter (nm) |
C, % |
N, % |
H, % |
C/N |
nsurface-OH, mmol g−1 |
DSsurface acetyl, % |
ChN |
217.0 ± 72.1 |
12.4 ± 3.7 |
43.56 |
6.38 |
6.323 |
7.96 |
1.55 |
— |
AChN |
211.6 ± 67.4 |
12.2 ± 3.4 |
45.46 |
6.15 |
6.356 |
8.62 |
— |
51.1 |
As with cellulose nanocrystals, the main challenge towards chemical modification of chitin nanocrystals is to conduct a reaction that takes place on the surface of the nanoparticles, while preserving the original morphology and structure to avoid any polymorphic conversion for crystalline integrity.29 As shown in the TEM images in Fig. 2, after the surface acetylation, AChN maintained the rod-like morphology and exhibited better dispersion in comparison with pristine ChN (reported in our previous studies).27 Further statistical analysis of dimensions (length and diameter) and distribution of AChN was done using Nanoscope software (Fig. S1 in ESI†). With the measurement of over 100 individual nanocrystals from TEM images (mainly focusing on the images with the enlargement of ×25
000), the average length and diameter of AChN were about 211.6 nm and 12.2 nm, respectively, which were similar to the dimensions of pristine ChN (as shown in Table 1).
 |
| Fig. 2 TEM images of acetylated chitin nanocrystals (AChN) at different observation scales. (A and B) ×9600; (C and D) ×25 000. | |
Crystalline property is one of the most important physical properties of chitin nanocrystals, which reflects the integrity of the original structure of nanocrystals after surface modification. The X-ray diffraction patterns of ChN and AChN are shown in Fig. 3, and the values of crystallinity index (CrI, %) and crystalline dimensions in different planes are summarized in Table 2. The characteristic diffraction peaks of crystallite crab chitin were observed on the patterns of both ChN and AChN, located at 2θ angles of around 9.3°, 19.2°, 20.7°, 23.4°, and 26.3° corresponding to the typical reflection planes of α-chitin, 020, 110, 120, 101, and 130, respectively. The crystallinity index of the chitin nanocrystals was calculated from two peaks CrI020 and CrI110 according to the Segal method.30,31 In general, the high crystallinity index (about 80%) of both ChN and AChN proved the maintenance of the crystalline integrity of the nanocrystals during the surface acetylation. In addition, the crystalline dimensions of different planes (B020 and B110) of nanocrystals can be calculated according to the Scherrer equation. As shown in Table 2, the result of no change and only a slight decrease of crystalline sizes in the 110 and 020 planes indicated the preservation of the crystalline structure for the chitin crystallites during the modification.32
 |
| Fig. 3 X-ray diffraction patterns of ChN and AChN samples. | |
Table 2 Values of crystallinity index (CrI020, CrI110) and crystalline dimensions (B020, B110 and B130) of chitin nanocrystals before and after acetylation
Samples |
Crystalline index |
Crystalline dimensions |
CrI020 (%) |
CrI110 (%) |
B020 (nm) |
B110 (nm) |
ChN |
78.2 |
83.0 |
9.9 ± 0.06 |
6.7 ± 0.02 |
AChN |
73.6 |
84.0 |
8.7 ± 0.04 |
6.4 ± 0.02 |
Due to the use of tetrahydrofuran (THF) as the solvent for the system for polyurethane-based materials, the dispersion of AChN in THF will affect its reinforcing effect in nanocomposites. Pristine ChN tends to self-aggregate in organic solvents, which is attributed to the strong interactions from the rich hydrophilic hydroxyl groups on the surface of the nanoparticles. As shown in Fig. 4, pristine ChN quickly sedimented to the bottom of the THF suspension after standing for 30 min. However, the THF suspension containing AChN showed outstanding dispersion and stability for 12 h of standing, which indicated the significant improvement of the dispersibility of the chitin nanocrystals after surface acetylation. The good dispersion of AChN in THF derived from the replacement of hydrophilic hydroxyl groups by hydrophobic acetyl groups, and the weakening of intra- and intermolecular hydrogen bonding between nanoparticles.
 |
| Fig. 4 The dispersibility observation of ChN (with 30 min standing at 4 °C) and AChN (with 12 h standing at 4 °C) in the solvent of tetrahydrofuran. | |
The influence of surface acetylation on the thermal stability of the chitin nanocrystals was investigated by simultaneous thermal analysis (TG/DSC), as shown in Fig. 5. From TG curves, the thermal degradation of native chitin appeared at about 270 °C, while pristine ChN started to degrade at about 200 °C. Interestingly, after surface acetylation, the degradation temperature of AChN was about 65 °C higher than that of pristine ChN, which indicated the enhancement of thermal stability of nanocrystals from the presence of stable acetyl groups. In addition, a wide endothermic peak coupled with weight loss appeared on DSC curves for ChN or AChN when heated between 350 and 450 °C, which was primarily attributed to the depolymerization of chitin with the formation of volatile low molecular products and char.33
 |
| Fig. 5 TG and DSC curves of native crab chitin (black curves), ChN (blue curves) and AChN (red curves) obtained from simultaneous thermal analysis at a heating rate of 10 °C min−1. Solid curves = TG analysis; dash curves = DSC analysis. | |
Appearance and light transmittance ratio of nanocomposites
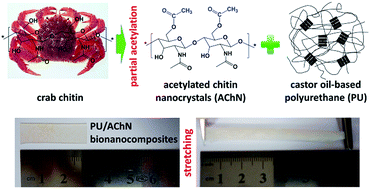
As mentioned before, rigid chitin nanocrystals with high specific modulus were promising candidates as nano-reinforcing biofillers in composites. Furthermore, different from the micro-sized fillers, the introduction of chitin nanocrystals will not sharply affect the optical transparency of composites even with the high filler concentrations.34 Fig. 6(A) shows pictures of PU-based nanocomposites containing different contents of AChN. In general, all nanocomposites exhibited a (semi-)transparent appearance similar to neat castor oil-based PU material, because the well-dispersed and individual AChN with 10–20 nm width was sufficiently thinner than the wavelength of visible light from approximately 400 nm to 700 nm.35 Polyurethane is a kind of thermoplastic and “soft” polymer with special high-elasticity property. Interestingly, this mechanical property was also kept in AChN-loaded composites in spite of the presence of rigid AChN nanoparticles in soft PU matrix (taking PU/AChN-6 sample as the example in Fig. 6(B)).
 |
| Fig. 6 Pictures of thermoplastic PU-based nanocomposites filled with various contents of AChN (Upper image); simple stretching test to check the preservation of high-elasticity of PU-based nanocomposites (sample PU/AChN-6) (Bottom image). | |
The light transmittance ratio of nanocomposites was further measured by UV spectrophotometer, as shown in Fig. 7. The result of high transmittance ratio for all composites (>40% under the visible light of 700 nm) indicated the slight influence of AChN in the PU matrix. Specifically, in comparison with the neat PU material, composites PU/AChN-2 and PU/AChN-4 showed a slight increase in light transmittance ratio, which can be attributed to the homogeneous dispersion and nano-sized effect of AChN in composites. However, high loading levels of AChN in composites may cause the aggregation of nanoparticles, which will induce the transformation of individual nanofillers to larger nanophases, and therefore result in the gradual reduction of the transmittance ratio of the composites (particularly samples PU/AChN-8 and PU/AChN-10).
 |
| Fig. 7 UV transmittance spectra of AChN-filled PU nanocomposites. | |
It has been reported that nanochitin (chitin nanocrystals and chitin nanofibers) possess appropriate filtering speed (9 times faster than nanocellulose),36 which is favorable to the evaporation of moisture and formation of smooth films from suspensions. The surface morphology of nanocomposites was observed by AFM using QNM and Tapping modes. As shown in Fig. 8, the composite PU/AChN-2 (Fig. 8(B)) containing a low nanofiller content exhibited a flat surface similar to the neat PU material (Fig. 8(A)). The slight asperity of the appearance in the two images may result from the bubbles during the casting-evaporation treatment. In comparison with neat PU, a uniform and regular aspect was observed on the amplitude and height images of the composite PU/AChN-6 (Fig. 8(C) and (D)), which indicated good compatibility and miscibility of AChN nanoparticles in polymeric matrix. Regarding the composites PU/AChN-2 and PU/AChN-6, it was difficult to catch the “face” of AChN on the surface images, which may be attributed to the dispersion and existence of nanoparticles inside the composites under these concentrations. However, when checking the surface of the composite PU/AChN-10, nanoscaled dots in some regions were observed from the height image (Fig. 8(E)), which reflected the presence of some AChN nanoparticles on the surface of this composite. Interestingly, due to the presence of AChN in different orientations, varied shapes and morphologies of these dots from the PU/AChN-10 composite were observed by further enlargement of images. As shown in the phase image in Fig. 8(F), white parts in the shapes of cylinder, dot and irregularity may correspond to the lying, vertical end and aggregation of AChN nanoparticles.
 |
| Fig. 8 AFM images of the surface morphology of nanocomposites: (A) amplitude image of PU, (B) amplitude image of PU/AChN-2, (C) amplitude image of PU/AChN-6, (D) height image of PU/AChN-6, (E) height image of PU/AChN-10, and (F) phase image of PU/AChN-10. | |
Mechanical and thermal properties of nanocomposites
Improvement of mechanical properties (particularly stiffness) upon adding pristine chitin nanocrystals was observed for almost all polymeric matrices in pioneering studies.37,38 The interaction between nanoparticles to form a percolating network was proposed to explain the nano-reinforcement of rigid chitin nanocrystals in composites. In order to further enhance the interfacial adhesion between chitin nanocrystals and polymeric matrices, the performance of chemical modification was attempted on chitin nanocrystals, such as surface derivatization with phenyl isocyanate, alkenyl succinic, or 3-isopropenyl-α,α′-dimethylbenzyl isocyanate.14 However, the introduction of these modified chitin nanocrystals in natural rubber induced the loss of mechanical properties of the ensuing composites, which was ascribed to the limited hydrogen bonding interactions between nanocrystals after the replacement of surface hydroxyl groups and the reduction of driving force for network formation. In this study, partial acetylation of chitin nanocrystals (substitution of C6–OH) was expected to improve the interfacial compatibility between modified nanocrystals and the PU matrix; meanwhile surface hydroxyl groups (C3–OH) were preserved for the formation of a rigid network between nanocrystals in composites. Fig. 9 shows the effects of various AChN contents on the mechanical properties of PU-based composites, involving tensile strength (σb), Young's modulus (E) and elongation at break (εb). Attributed to the presence of rigid AChN, the Young's modulus of the nanocomposites gradually enhanced with the increase of nanocrystal content, particularly from 0.98 MPa for neat PU material to 1.87 MPa and 4.01 MPa for composites PU/AChN-6 and PU/AChN-10, respectively. On the other hand, the nano-reinforcing effect of AChN promoted the increase of tensile strength of the nanocomposites, such as the highest value of 5.67 MPa for PU/AChN-6 in comparison with only 2.79 MPa for the neat PU material. Regarding the breaking elongation of nanocomposites, there was an increase for composites PU/AChN-2 and PU/AChN-4, and then a reduction tendency for the composites with AChN loading levels of higher than 6 wt% in comparison with neat PU material.
 |
| Fig. 9 Mechanical performance and nano-reinforcing effect of various loading levels of AChN on tensile strength (σb), Young's modulus (E) and elongation at break (εb) of PU-based composites. | |
As mentioned before, through the strong hydrogen bonding between the nanoparticles (from retained C2–OH on the surface of AChN), a rigid percolating network can form, and contribute to the improvement of the mechanical properties for the nanocomposites. The percolating threshold value is determined by the aspect ratio (L/D) of rod-like nanoparticles, and can be calculated according to eqn (4):39
|
 | (4) |
In this study, the aspect ratio of AChN was estimated as 17.4 from the results in Table 1, so the calculated value of ωRc was about 5.7 wt% for the PU/AChN composites. With low nanofiller content, the mechanical properties of the composites were dependent on interfacial interactions between the nanofillers (AChN) and the matrix (PU), which showed a slight increase of tensile strength and breaking elongation for PU/AChN-2 and PU/AChN-4. A three-dimensional network of AChN can form in composites with AChN loading levels higher than the percolating threshold, such as PU/AChN-6 and PU/AChN-8. Attributed to the presence of a rigid network and stress transferring, both the Young's modulus and the tensile strength of the composite PU/AChN-6 was about double in comparison with the neat PU material. However, superfluous nanofillers will induce the self-aggregation of AChN and further microstructure separation, which may result in the reduction of the strength and tenacity of the composite (PU/AChN-10), despite the sharp increase of modulus (from the rigid network).
Thermal properties of materials are of importance for processing issues and practical application. Regarding thermoplastic polyurethane-based materials, the glass transition temperature (Tg) is an especially significant characteristic since this value can affect the performance of the materials, including mechanical behavior, swelling property, etc. The glass transition temperature is the temperature at which a polymer changes from hard and brittle (glassy state) to soft and ductile (rubbery state). DSC is the most common technique to measure the Tg of materials. Original DSC thermograms of PU/AChN nanocomposites are shown in Fig. S2 (ESI†), and some data on the glass transition of the nanocomposites are summarized in Table 3. On the whole, it was observed that the Tg values of nanocomposites gradually increased with the increase of AChN contents. Two factors from the addition of the reinforcing nanophase in the composites can be used to explain this phenomenon. The presence of rigid nanoparticles (AChN) and a possible rigid network will restrict the free mobility of the soft segments of the PU polymers. Moreover, because of the surface acetylation, co-crystallization may occur between PU chains and neighboring nanocrystals, which will enhance the interactions between the soft and hard segments of the polymeric matrix. A similar result of Tg increasing with the introduction of rigid nanoparticles was also reported for the system of water polyurethane/cellulose nanocrystals.40
Table 3 Heat-capacity increment during the glass transition (ΔCp), glass transition temperatures measured as the onset (Tg,onset), midpoint (Tg,mid), and endpoint (Tg,end) temperature of PU/AChN nanocomposites from DSC thermograms
Samples |
ΔCp (J g−1 °C) |
Tg,onset (°C) |
Tg,mid (°C) |
Tg,end (°C) |
PU |
0.226 |
−1.44 |
5.90 |
13.21 |
PU/AChN-2 |
0.238 |
−0.37 |
5.86 |
12.51 |
PU/AChN-4 |
0.279 |
0.80 |
7.25 |
13.93 |
PU/AChN-6 |
0.213 |
1.79 |
6.52 |
12.07 |
PU/AChN-8 |
0.254 |
1.27 |
7.22 |
13.55 |
PU/AChN-10 |
0.432 |
4.11 |
8.40 |
12.68 |
Crystalline property and microstructure of nanocomposites
The X-ray diffraction (XRD) of neat PU material and PU/AChN composites containing different contents of AChN is presented in Fig. 10. A wide diffused diffraction peak located at 2θ of about 19–20° appeared on all XRD patterns of polyurethane-based materials, which was assigned to a short-range-order arrangement of chain segments of polyurethane molecules.41 Regarding the composites loaded with low AChN content (≤6 wt%), no obvious diffraction peak of chitin was observed, which indicated well-dispersed nanocrystals without any large agglomeration in these composites. However, a weak diffraction peak at 2θ of 19.2° was visible in the pattern of the composite PU/AChN-10, which can be identified as the characteristic peak corresponding to the 110 reflection of chitin. The presence of crystalline features of chitin nanocrystals reflected the preservation of the original structure of the nanocrystals in the composites, but the slight aggregation of the nanoparticles in composite PU/AChN-10.
 |
| Fig. 10 XRD patterns of PU/AChN nanocomposites and neat PU material. | |
The hydrogen bonding in polyurethane-based materials can be investigated by Fourier transform infrared spectroscopy (FTIR) spectra, as shown in Fig. 11. Two important stretching regions for polyurethane, located at 3600–3100 cm−1 and 1800–1650 cm−1, were observed to analyze the effect of rigid AChN on the hydrogen bonding and phase separation of segmented PU-based composites. It was reported that in polyurethane, the infrared peaks at 3480 and 3320 cm−1 were assigned to the free N–H stretching and the hydrogen-bonded N–H stretching, while the bands at 1733 and 1703 cm−1 were associated with the free-of-hydrogen-bonding C
O stretching and the hydrogen-bonded C
O stretching.42 On the chemical structure of acetylated chitin nanocrystal, additional acetyl groups (with carbonyl) allowed for increased hydrogen bonding between nanocrystals and adjacent polymer chains. Indeed, the hydrogen atoms of N–H groups from the hard segment of the polyurethane component can serve as proton donors, and the acetyl carbonyl groups of AChN as well as the urethane carbonyl groups were expected to be proton acceptors.2 As shown in Fig. S3 (ESI†), strong hydrogen-bonded N–H stretching peaks appeared on the spectra of all composites, while weak or even no signal was observed for free N–H stretching.43 This result indicates the high degree of hydrogen-bonded N–H groups in the composites after the addition of the AChN nanoparticles. On the other hand, regarding the C
O stretching located at 1733 and 1703 cm−1 (Fig. S3 in ESI†), the intensities of hydrogen-bonded C
O stretching peaks slightly increased with the higher loading levels of AChN in composites. From the FTIR results, the higher degree of hydrogen-bonded than free N–H or C
O stretching may reflect the good compatibility and enhanced interfacial interactions between acetylated chitin nanocrystals and polyurethane in composites.
 |
| Fig. 11 FTIR spectra of PU/AChN nanocomposites and neat PU material. (a) PU, (b) PU/AChN-2, (c) PU/AChN-4, (d) PU/AChN-6, (e) PU/AChN-8, and (f) PU/AChN-10. | |
The microstructure of the PU/AChN nanocomposites was further observed from the fracture morphology by scanning electron microscope (SEM). As shown in Fig. 12, derived from the homogeneous dispersion, the presence of low-loading levels of AChN showed a rare influence on the structure of the PU-based composites (PU/AChN-2 and PU/AChN-4), which provided the flat and uniform fractured morphologies (Fig. 12(B) and (C)) similar to the neat PU material (Fig. 12(A)). The composite PU/AChN-6 (Fig. 12(D)) exhibited a slightly coarse and irregular fractured morphology, which indicated some changes of the composite microstructure. As mentioned before, a rigid percolating network can form in composites under this loading level of AChN, which will restrict the free mobility of the soft segments of the polyurethane polymers. Higher AChN content caused the coarser fractured morphologies of composites, such as PU/AChN-8 (Fig. 12(E) and PU/AChN-10 Fig. 12(F)). Particularly regarding the composite PU/AChN-10, inhomogeneity and microphase separation between reinforcing nanophases and polymeric matrix may exist to some extent, because of the addition of superfluous AChN nanoparticles.
 |
| Fig. 12 Fracture morphology of PU/AChN nanocomposites with various AChN contents. (A) PU, (B) PU/AChN-2, (C) PU/AChN-4, (D) PU/AChN-6, (E) PU/AChN-8, and (F) PU/AChN-10. | |
Conclusions
In conclusion, novel elastomeric nanocomposites were developed with high-crystallinity “rigid” chitin nanocrystals as biobased fillers and high-elasticity “soft” polyurethane as the polymeric matrix. Through controlled surface acetylation treatment, hydrophilic hydroxyl groups (C6–OH) on the surface of chitin nanocrystals were partially converted to hydrophobic acetyl groups, which was favorable to the improvement of compatibility and hydrogen bonding interactions between nanofillers and matrix. Furthermore, from other preserved hydroxyl groups (C3–OH), a rigid three-dimensional network can form between acetylated chitin nanocrystals under the critical concentration in composites, which provides the enhancement of stiffness and toughness of thermoplastic polyurethane-based nanocomposites. With the addition of 6 wt% acetylated chitin nanocrystals, a castor oil-based nanocomposite with tensile strength of 5.67 MPa, elongation at break of 280.0% and Young's modulus of 1.87 MPa was obtained, which surpassed those of neat polyurethane material by 103%, 40% and 91%, respectively. In this study, the proposed strategy of “trade-off” between interfacial adhesions from the nanofillers and the matrix and the formation of a network from the nanofillers provided an approach to incorporate rigid nanofillers into polymeric matrices and elastomers. The discussion and results of this study are expected to enrich the nano-reinforcing mechanism of biobased chitin nanocrystals in composite materials, and further broaden the practical use of natural polymers as novel value-added products.
Acknowledgements
The authors are grateful for the support of the National Natural Science Foundation of China (51373131), Project of New Century Excellent Talents of Ministry of Education of China (NCET-11-0686), and Fundamental Research Funds for the Central Universities (Self-Determined and Innovative Research Funds of WUT).
Notes and references
- A. Okada, Y. Fukoshima, S. Inagaki, A. Usuki, S. Sugiyama, T. Kurauchi and O. Kamigaito, US Pat., 4.739.007, 1988.
- A. Pei, J.-M. Malho, J. Ruokolainen, Q. Zhou and L. A. Berglund, Macromolecules, 2011, 44, 4422 CrossRef CAS.
- S. Thomas and R. Stephen, Rubber nanocomposites: preparation, properties and applications, John Wiley & Sons (Asia) Pte Ltd, Singapore, 2010, p. 705 Search PubMed.
- A. Dufresne, S. Thomas and L. A. Pothan, Biopolymer nanocomposites: processing, properties, and applications. John Wiley & Sons Inc., Hoboken, New Jersey, 2013, p. 696 Search PubMed.
- R. H. Marchessault, F. F. Morehead and N. M. Walter, Nature, 1959, 184, 632 CrossRef CAS.
- J. F. V. Vincent and U. G. K. Wegst, Arthropod Struct. Dev., 2004, 33, 187 CrossRef PubMed.
- J.-B. Zeng, Y.-S. He, S.-L. Li and Y.-Z. Wang, Biomacromolecules, 2012, 13, 1 CrossRef CAS PubMed.
- M. Mincea, A. Negrulescu and V. Ostafe, Rev. Adv. Mater. Sci., 2012, 30, 225 CAS.
- K. G. Nair and A. Dufresne, Biomacromolecules, 2003, 4, 657 CrossRef CAS PubMed.
- K. G. Nair and A. Dufresne, Biomacromolecules, 2003, 4, 666 CrossRef CAS PubMed.
- A. Saralegi, S. C. M. Fernandes, A. Alonso-Varona, T. Palomares, E. J. Foster, C. Weder, A. Eceiza and M. A. Corcuera, Biomacromolecules, 2013, 14, 4475 CrossRef CAS PubMed.
- J. Huang, J. W. Zou, P. R. Chang, J. H. Yu and A. Dufresne, eXPRESS Polym. Lett., 2011, 5, 362 CrossRef CAS.
- M. Zeng, H. Gao, Y. Wu, L. Fan and A. Li, J. Macromol. Sci., Part A: Pure Appl.Chem., 2010, 47, 867 CrossRef CAS.
- K. G. Nair and A. Dufresne, Biomacromolecules, 2003, 4, 1835 CrossRef CAS PubMed.
- S. Ifuku, S. Morooka, M. Morimoto and H. Saimoto, Biomacromolecules, 2010, 11, 1326 CrossRef CAS PubMed.
- N. Lin, J. Huang, P. R. Chang, J. Feng and J. Yu, Carbohydr. Polym., 2011, 83, 1834 CrossRef CAS PubMed.
- S. Lin, J. Huang, P. R. Chang, S. Wei, Y. Xu and Q. Zhang, Carbohydr. Polym., 2013, 95, 91 CrossRef CAS PubMed.
- D. S. Ogunniyi, Bioresour. Technol., 2006, 97, 1086 CrossRef CAS PubMed.
- H. Mutlu and M. A. R. Meier, Eur. J. Lipid Sci. Technol., 2010, 112, 10 CrossRef CAS.
- E. Hablot, D. Zheng, M. Bouquey and L. Avérous, Macromol. Mater. Eng., 2008, 293, 922 CrossRef CAS.
- M. A. Corcuera, L. Rueda, B. Fernandez d'Arlas, A. Arbelaiz, C. Marieta, I. Mondragon and A. Eceiza, Polym. Degrad. Stab., 2010, 95, 2175 CrossRef CAS PubMed.
- K. M. S. Meera, R. M. Sankar, J. Paul, S. N. Jaisankar and A. B. Mandal, Phys. Chem. Chem. Phys., 2014, 16, 9276 RSC.
- A. Saralegi, M. L. Gonzalez, A. Valea, A. Eceiza and M. A. Corcuera, Compos. Sci. Technol., 2014, 92, 27 CrossRef CAS PubMed.
- S. A. Madbouly, Y. Xia and M. R. Kessler, Macromolecules, 2013, 46, 4606 CrossRef CAS.
- N. Lin, J. Huang, P. R. Chang, L. Feng and J. Yu, Colloids Surf., B, 2011, 85, 270 CrossRef CAS PubMed.
- S. Gao and L. Zhang, Macromolecules, 2001, 34, 2202 CrossRef CAS.
- Q. Zhang, S. Wei, J. Huang, J. Feng and P. R. Chang, J. Appl. Polym. Sci., 2014, 131, 39809 Search PubMed.
- N. Lin, J. Huang and A. Dufresne, Nanoscale, 2012, 4, 3274 RSC.
- N. Lin and A. Dufresne, Nanoscale, 2014, 6, 5384 RSC.
- L. Segal, J. J. Creely, A. E. Martin and C. M. Conrad, Text. Res. J., 1959, 29, 786 CrossRef CAS PubMed.
- Y. Zhang, C. Xue, Y. Xue, R. Gao and X. Zhang, Carbohydr. Res., 2005, 340, 1914 CrossRef CAS PubMed.
- Y. Wang, Y. Chang, L. Yu, C. Zhang, X. Xu, Y. Xue, Z. Li and C. Xue, Carbohydr. Polym., 2013, 92, 90 CrossRef CAS PubMed.
- W. Tang, C. Wang and D. Chen, Polym. Degrad. Stab., 2005, 87, 389 CrossRef CAS PubMed.
- S. Ifuku and H. Saimoto, Nanoscale, 2012, 4, 3308 RSC.
- M. Nogi, K. Handa, A. N. Nakagaito and H. Yano, Appl. Phys. Lett., 2005, 87, 243110 CrossRef PubMed.
- M. I. Shams, S. Ifuku, M. Nogi, T. Oku and H. Yano, Appl. Phys. A, 2011, 102, 325 CrossRef CAS.
- M. Paillet and A. Dufresne, Macromolecules, 2001, 34, 6527 CrossRef CAS.
- A. Morin and A. Dufresne, Macromolecules, 2002, 35, 2190 CrossRef CAS.
- A. Dufresne, Nanocellulose: from nature to high performance tailored materials, Walter de Gruyter GmbH, Berlin and Boston, MA, 2012, p. 460 Search PubMed.
- X. Cao, Y. Habibi and L. A. Lucia, J. Mater. Chem., 2009, 19, 7137–7145 RSC.
- Y. I. Tien and K. H. Wei, Polymer, 2001, 42, 3213 CrossRef CAS.
- R. W. Seymour, G. M. Estes and S. L. Cooper, Macromolecules, 1970, 3, 579 CrossRef.
- X. Yao, X. Qi, Y. He, D. Tan, F. Chen and Q. Fu, ACS Appl. Mater. Interfaces, 2014, 6, 2497 CAS.
Footnote |
† Electronic supplementary information (ESI) available: Models and formulas for the calculation of amount of surface hydroxyl groups (nsurface-OH) on chitin nanocrystals, size statistics for the length (L) and diameter (D) of acetylated chitin nanocrystals, original DSC thermograms and amplified FTIR spectra at the regions of 3600–3100 cm−1 and 1800–1650 cm−1 of PU/AChN nanocomposites were shown in Supporting Information. See DOI: 10.1039/c4ra07899c |
|
This journal is © The Royal Society of Chemistry 2014 |
Click here to see how this site uses Cookies. View our privacy policy here.