Batch and continuous phosphate uptake studies employing a ferrimagnetic calcium silicate hydrate composite

Mathew J. Cairns and Thomas Borrmann *
School of Chemical and Physical Sciences, Victoria University of Wellington, New Zealand. E-mail: mat.cairns@gmail.com; aoc@gmx.li

Received 29th July 2014 , Accepted 9th October 2014

First published on 9th October 2014


Abstract

Composite particles of ferrimagnetic magnetite and a nano-structured calcium silicate hydrate were synthesized and used for the sorption of phosphate from solution. The composite was very effective achieving phosphate uptakes of up to 5.5 mmol phosphate per gram of composite. The amount of phosphate sorbed depended on the ratio of silicate to magnetite in the composite as the silicate component was proven to be far more effective in the uptake than the iron oxide component. Although no definitive distinction was possible the uptake of phosphate appeared to follow second order kinetics and a Freundlich isotherm model. Continuous uptake studies were carried out which showed the importance of controlling the flow rate of liquid through a column containing the sorbent. While the attractive magnetic force kept the sorbent together for lower flow rates, at a high flow of feed solution sorbent material was lost into solution. The continuous uptake studies indicated furthermore that agglomeration limits the number of available active sorption sites and hence the effectiveness of the composite.

Introduction

The low bioavailability of phosphate in the environment has created a great demand worldwide for agricultural fertilizers containing this vital nutrient. This has lead, over the past hundred years or so, to the depletion of much of the world's readily accessible reserves of phosphate minerals. In the Pacific region, one of the prime examples of this is the island of Nauru. Phosphate mining was commenced on Nauru in 1906; all reserves of phosphate ore were exhausted by the mid 1990s.1 It has been estimated that there are perhaps 80–100 years worth of economically recoverable phosphate reserves worldwide.2 After these reserves have been exhausted, lower grade ores, often contaminated with toxic metal ions, such as cadmium, must be used. The alternative to this is a phosphate recycling system, whereby phosphate is recovered from a waste stream at, or near, its source, preventing environmental degradation. The thus recovered phosphate may then be reused, as, for example a feedstock for the fertilizer industry.3

Phosphate sorption

Materials used for phosphate sorption are often based on aluminium-,4–8 calcium-,9–14 or iron-containing7,15–17 materials due to the low solubility of the phosphate minerals of these cations. In recent years, much work has been focused on sorbing phosphate via precipitation as calcium phosphate phases, due to their low solubility product and the low cost of calcium-containing sorbent precursors. Of the various calcium phosphates, the apatites have the lowest solubility; pK-values for hydroxyapatite, Ca5(PO4)3(OH), range from 54.4 to 58.5 at 25 °C.18 Despite the low solubility of the apatites, calcium and phosphate are readily found in solution at concentrations far exceeding that for the precipitation of apatite phases, due to the large activation energy of the precipitation step. Previously it has been shown that the initial calcium phosphate precipitate consists mainly of Ca2+ and H2PO4 ions.19 The phosphate ion, PO43− is not encountered in this initial precipitate, which subsequently ages to form the apatite phase over a period of several hours. The activation energy for this ageing step process been reported as between 95–105 kJ mol−1.19,20

Phosphate sorption by nano-structured calcium silicate hydrate

Southam, in 2004,9 200510 and 200811 conducted extensive studies of the characteristics of nano-structured calcium silicate hydrate (NCSH) with regard to its sorption of phosphate. It was found that the material possessed a maximum sorption capacity for phosphate of 1.94 mmol P per g NCSH. Maximum phosphate sorption was achieved when the phosphate was initially present as the H2PO4 ion. When HPO42− or PO43− were used as the phosphate source, a maximum sorption capacity of 1.78 mmol P per g NCSH (HPO42−) or 1.56 mmol P per g NCSH (PO43−) were attained. The 2-ethoxyethanol washed form of NCSH was found to be a better sorbent material than the water washed or pH adjusted forms. This was attributed to the 2-ethoxyethanol washed material having a higher surface area than the water washed material,21 and a higher calcium content than the pH adjusted NCSH material.

The sorption of phosphate by NCSH was found to occur via a two-step mechanism, both parts of which exhibited second order kinetics. In the first step, the NCSH forms what was presumed to be a positively charged intermediate, either by reaction with H2PO4 or H+. This probably occurs at a Si–O–Ca-site on the NCSH surface, forming Si–(OH)+–Ca, thereby reducing the strength of the Ca–O bond and making the calcium more labile. In the second step of the sorption process, the intermediate reacted with the phosphate, removing it from solution. The first step (reaction of NCSH with H+) was found to be rate limiting for the sorption reaction. Thus, phosphate sorption from solutions of H2PO4 occurred faster than sorption from HPO42− or PO43− solutions due to the lower initial pH and corresponding higher availability of H+. Sorption isotherms, when measured at high loadings of NCSH (up to 25 g NCSH dm−3) indicated that the NCSH exhibited a better conformity to the Freundlich isotherm than the Langmuir or other isotherms.

It was found by Southam that a brushite phase, CaHPO4·2H2O, is formed during the sorption of H2PO4 by NCSH, rather than the more thermodynamically stable apatite phase, (Ca5(PO4)3(OH)). It is known that brushite is an intermediate during the initial stages of hydroxyapatite formation.20 Southam suggested that that the presence of an initial brushite precipitate, or the NCSH surface itself, retarded formation of the apatite phase.10,11

It has also been shown by Lai that reinforced NCSH material exhibits similar adsorption characteristics to those observed by Southam.22 As the reinforced material has lower calcium content than the 2-ethoxyethanol washed material, the sorption capacity is lower, and the material takes longer to attain equilibrium. The reported sorption capacity of the reinforced NCSH was 91% that of the 2-ethoxyethanol washed material.

One of the main challenges in the use of NCSH for the uptake of phosphate from solution is the recovery of the spent sorbent. Time consuming filtration has to be employed. In a prior study it has been shown that superparamagnetic particles can be incorporated in NCSH creating a composite that can be recovered by high gradient magnetic separation. This composite was used in the sorption of copper from solution.23 It was found that while the composite was effective in the removal of copper it degraded due to the acidic nature of the copper solutions. As most mine drainage is even more acidic than the solutions investigated it could be surmised that the composite is unsuitable for the uptake of copper. In contrast the uptake of phosphate occurs usually from waters that have a pH-value close to neutral (usually between pH 6 and 8), such as sewage, lakes and industrial effluents. A preliminary study indicated that a magnetite composite could therefore be employed in the sorption of phosphate.24 In this study the use of a magnetite composite for the uptake of phosphate is presented and compared to the findings for pure NCSH.10,11 The magnetic properties of the NCSH composite were utilized by employing the composite material as the sorbent in a continuous uptake process.

Experimental

General

Materials to produce NCSH and composites were obtained from LobaChemie (calcium hydroxide AR grade; LobaChemie Pty Ltd, Mumbai, India), Orica Chemicals (sodium silicate N grade; Auckland, New Zealand), JaSol (technical grade hydrochloric acid; Auckland, New Zealand) and Bayer (magnetite; Bayer AG, Leverkusen, Germany). Water for all preparations was distilled before use.

Reagents used for phosphate sorption experiments were obtained from Merck (Darmstadt, Germany), and Sigma-Aldrich (Sigma-Aldrich New Zealand Ltd, Auckland, New Zealand) as analytical reagent grade and used as received. Chemicals to carry out the phosphate analysis with the molybdenum blue method for the isotherm studies were purchased from Hach (Hach Pacific, Auckland, New Zealand) and used according to the instructions.25,26

Phosphate analysis

For the continuous uptake and kinetic studies quantitative determination of phosphate was undertaken with a modified molybdenum blue method. The method used was an in-house modification (by FZK – Forschungszentrum Karlsruhe, Germany) of other published methods, and employed bismuth as a stabilizing agent.27,28 Two reagents were prepared in advance and kept separately, a molybdic acid and a reducing reagent.
Molybdic acid reagent. Ammonium molybdate, (NH4)6Mo7O24·4H2O (9.15 g), was dissolved in approximately 700 cm3 of H2O. In a separate beaker, Bi(NO3)3·5H2O (1.5 g) was dissolved in 191 cm3 of concentrated HNO3 (65%, 14 mol dm−3) and then slowly added to the molybdate solution. The resulting solution was allowed to cool and its volume adjusted to 1000 cm3.
Reducing agent. 1-Amino-2-naphthol-4-sulfonic acid (0.750 g), Na2SO3 (41.92 g), and Na2S2O5 (69.85 g), were measured out. All of the sulfonic acid and approximately one half of the Na2S2O5 were ground to a fine powder in a mortar. The remaining solids were dissolved in approximately 800 cm3 H2O; then the ground powder mixture was added to the solution. Once dissolved, the resulting solution was adjusted to a final volume of 1000 cm3.
Storage and use of reagents. Both reagents were stored at 4 °C in glass bottles (the reducing reagent in an amber bottle). They were discarded if they became colored. Before use, the reagents (and any standards or samples) were allowed to warm to room temperature.

To analyze for phosphate, a series of standards containing 0.0, 0.2, 0.4, 0.6, 0.8, 1.0 mg phosphate dm−3 were prepared daily from a stock solution (prepared weekly) containing 10 mg phosphate dm−3 (prepared from Na2HPO4). Aliquots of any samples to be analyzed were placed into 25 cm3 volumetric flasks such that the final phosphate concentration was in the range covered by the standards. Water was added to bring the total volume to approximately 15 cm3. Following this, 2.5 cm3 of the molybdic acid reagent were added, the solution mixed gently, and then 0.5 cm3 of the reducing agent followed. All flasks were made up to volume with water and the molybdenum blue color was allowed to develop for 15 minutes. The absorbance of standards and samples was measured in 1 cm disposable cuvettes at a wavelength of 690 nm using a WTW Mikroprozessor Photometer MPM 1500 (Wissenschaftlich-Technische Werkstätten GmbH, Weilheim, Germany). A calibration chart was prepared and used to determine the phosphate concentration of the samples. The absorbance was found to obey Beer's Law, having a linear response, with a coefficient of determination (R2) typically greater than 0.995.

Typically, the amount of dissolved reactive phosphorus (DRP) was determined, in which case the samples were filtered with 0.45 μm through cellulose membranes (Millipore) before analysis. In some cases total reactive phosphorus (TRP) was quantified, in which case the samples were not filtered before analysis. Occasionally, the concentration of total phosphorus (TP) or total dissolved phosphorus (TDP) was determined. In this case, the unfiltered (TP) or filtered (TDP) samples were digested with concentrated nitric acid in a Teflon lined bomb autoclave at 100 °C overnight. Typically 0.25 cm3 HNO3 was used to digest a 5 cm3 (liquid) sample in a 30 cm3, which were placed in the autoclave and diluted to 100 cm3. At least one standard was similarly treated when TDP or TP were determined.

The procedure for the isotherm studies was similar except that tartaric acid was used instead of bismuth nitrate according to instructions from the literature.25 As silicate and phosphate both give a molybdenum complex of blue coloration, the method was modified using citrate to measure the silicate background by avoiding formation of the phosphate complex25 or by using oxalic acid to selectively only produce the phosphate complex (using reagents containing 0.25 vol% oxalic acid) or the silicate complex (by addition of 10% (w/v) oxalic acid solution to the reaction zone in order to destroy the molybdophosphoric acid).26 For these studies UV/visible absorption spectra were recorded on a Cary Scan 100 instrument (Varian) operating in double beam mode. Samples were transferred into 1 cm quartz cuvettes (Carl Roth GmbH + Co. KG, Karlsruhe, Germany) and spectra were recorded between 200–800 nm, at a scan speed of 200 nm min−1. The spectral bandwidth of the instrument was set to 2 nm.

General synthetic procedure

NCSH was prepared using a batch process. Typically batches of between 200–500 cm3 were prepared. The following relates to the preparation of a sample at a reaction volume of 500 cm3, giving approximately 10 g (dry basis) of calcium silicate:

In a plastic beaker, Ca(OH)2 (78.1 mmol, 5.79 g), was suspended in 250 cm3 of 0.174 mol dm−3 HCl under vigorous mixing provided by a mechanical overhead stirrer (either a Heidolph RZR 1 or an IKA-Werke Eurostar Digital). In a separate plastic beaker sodium silicate (15.91 g of 27 wt% SiO2, 71.5 mmol) was diluted to 250 cm3 with H2O. This provided precursor solutions with the following equivalent concentrations: [Ca] = 0.312 mol dm−3 and [SiO2] = 0.286 mol dm−3.

The sodium silicate solution was rapidly added to the calcium hydroxide suspension, immediately generating a viscous slurry. Stirring of the resulting calcium silicate precipitate was maintained for about one hour. Then the material was aged by allowing it to stand overnight. Various post-synthesis treatments were applied, depending on the requirements for the final material.

It has previously been shown21 that drying the silicate leads to collapse of the pore structure, resulting in a significantly reduced surface area. Therefore, it was necessary to dry the material while maintaining the high surface area. In this case, 2-ethoxyethanol was used as a spacer compound due to its low surface tension compared to H2O. During the filtration step, the filter cake was first washed well with water to remove any salts (Na+ and Cl are spectator ions in the calcium silicate precipitation reaction). After the final water rinse, but before suction through the filter cake was lost, one plug volume of 2-ethoxyethanol was added to the filter funnel. It was allowed to pass through the filter cake, displacing any water present. The filter cake was subsequently dried in a vented oven at 110 °C. Typically, samples were dried for at least two days prior to use.

Magnetite–calcium silicate composite

For the preparation of composite materials containing magnetite, the NCSH was assumed to have an empirical formula of Ca0.8SiO2.8·2H2O, which was used to determine the mass ratio of magnetite to silicate. For example, to synthesise a material containing 25 wt% Fe3O4, magnetite (3.36 g, 14.5 mmol) was added to a sodium silicate solution as detailed in the general procedure. The mixture was blended with a stirring rod for five minutes in order to ensure that the Fe3O4 was thoroughly dispersed. At this point, the magnetite-containing sodium silicate solution was added to the calcium hydroxide suspension as per the general synthetic procedure. Once the material had aged overnight, post-synthesis treatments such as reinforcement or 2-ethoxyethanol washing could be carried out. If large quantities of the material were desired (a total reaction volume greater than 500 cm3), the magnetite was dispersed in the sodium silicate solution via the use of a mechanical overhead stirrer equipped with a plastic mixing blade. This method proved suitable for the synthesis of composites ranging from 1–25 wt% Fe3O4, without significantly degrading the accessible surface area of the silicate. To generate powdered samples the composite filter cake was dried under nitrogen at 110 °C or freeze-dried.

Phosphate uptake studies

Isotherm and sorption capacity studies. Samples of calcium silicate–magnetite composites in the form of filter cakes were added to a series of dry 100 cm3 flasks. Phosphate solutions were prepared from NaH2PO4·H2O in the concentration range from 0.01 to 10 mmol dm−3. These solutions (50 cm3) were added to the composite containing flasks. The flasks were shaken on a orbital shaker (Labnet Orbit 300) for 24 hours at 25 °C. The mixtures were centrifuged at approximately 1000 rpm for 15 minutes. Subsamples of the supernatant were analysed to determine pH and phosphate concentration. The quantity of phosphate sorbed by the silicate was calculated by difference. Isotherms were calculated for samples with sorbent loadings at 0.5, 1.0 and 2.0 g composite dm−3 (dry basis). Isotherm measurements were primarily conducted with a calcium silicate containing 25 wt% (dry basis) magnetite; however the sorption capacity was also determined for composites covering the range of magnetite content – from 0 to 25 wt%, with a control sample of 100% magnetite likewise being analysed.
Kinetic studies. A 2 dm3 flask was loaded with 1 dm3 of a 1.1 mmol dm−3 phosphate solution (prepared from NaH2PO4·H2O). In a separate flask, a Fe3O4–NCSH filter cake containing 25 wt% magnetite (1.1 g dry equivalent) was dispersed in 100 cm3 water under vigorous stirring for 30 min. The silicate suspension was added quickly to the stirred (300 rpm, moderate vortex present) phosphate solution. Over the course of 60 min, nine samples, each of 25 cm3 volume, were withdrawn using a graduated syringe pipette. The samples were promptly filtered through a 0.45 μm membrane into glass vials. The filtrates were subsequently analysed to determine their phosphate content and pH values. The pH value was also monitored in situ during the initial stages of the reaction.
Continuous uptake studies. Column sorption experiments were carried out in up-flow mode as to approximate a fluidized bed sorption. Stock solution (influent) was supplied with a peristaltic pump (PLP 33, Labor-Technik Düsseldorf) via silicone tubing to the inlet of a glass column. The liquid rose through the column and exited (effluent) it at the top where part of it was passed through a 0.45 μm membrane filter and the rest discarded. The filtered liquids as well as the material caught in the filter were analyzed. Glass columns of two different sizes were employed, a 50 cm3 and a 600 cm3. The influent reservoir was a 2 dm3 flask. The smaller column was cylindrical, having parallel sides, whereas the larger column was conical, having been constructed from a 1 dm3 pear-shaped separating funnel by removing its upper half. From the effluent 20–25 cm3 samples were collected in a syringe and passed through a 0.45 μm membrane before storing in glass vials. For the smaller column, the pump was set to deliver 15 column volumes per hour and samples were taken after every two column volumes (two minutes of sampling in every eight minute cycle). For the larger column, the pump was set to maximum speed and delivered four column volumes per hour. A 30 second sampling period was allowed every 10 minutes. Columns were loaded with Fe3O4–NCSH composites containing 25 wt% magnetite (dry basis). The silicate was applied in the form of filter cake at a loading of 0.25 g dry material per liter of influent (10 g per liter of column volume) for the 50 cm3 column. For the 600 cm3 column two experiments were carried out, one using 1.00 g dry material per liter of influent (3.33 g per liter of column volume) and another using 2.00 g dry material per liter of influent (6.67 g per liter of column volume). For the small column and the 1 g loading in the large column, the filter cake was dispersed in water and the column filled with water before the phosphate-containing influent was introduced. In the experiment using a 2 g composite loading and the larger column the filter cake was not pre-dispersed, but instead, was manually stirred with a glass rod as the column filled with influent.

Results and discussion

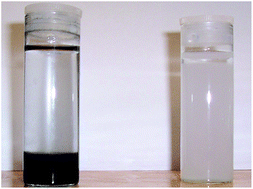
In a prior study superparamagnetic particles were investigated, which were intended to be used in high gradient magnetic separation employing an external magnetic field.23 In this study magnetite particles of a larger size (25 nm instead of 15 nm diameter) were employed. These were ferrimagnetic, not superparamagnetic. The composites generated using the ferrimagnetic particles were comparable to the superparamagnetic ones studied earlier.23 The only noticeable difference was the settling behavior of the ferrimagnetic Fe3O4–NCSH composite (Fig. 1). While pure NCSH and the superparamagnetic composite (in the absence of a magnetic field) took hours to settle the ferrimagnetic magnetite composite settled within a matter of minutes (Fig. 1). This tendency of the composite to spontaneously settle was employed in continuous sorption studies (see below). The characterisation of the ferromagnetic particles is provided as ESI material and can be found in the literature.23
image file: c4ra07744j-f1.tif
Fig. 1 Settling behavior of Fe3O4–NCSH composite (dark on the left) compared to pure NCSH (white on the right).

The sorption of phosphate was investigated in respect to the magnetite content of the silicate (Fig. 2). As expected, the sorption capacity of the composite decreased as the magnetite content increased (Fig. 2). When related to the actual mass of NCSH present (as opposed to the total mass of the composite), the uptake per gram of NCSH was constant within the margin of error. As was found for the uptake of copper, the presence of magnetite led to an increase in the sorption capacity compared to pure NCSH at low levels of magnetite,23 about 1 wt%. This was considered to be a particle size and surface area effect – as the magnetite acted as nucleation site for the silicate during its formation; the composite particles were smaller and had a larger surface area than pure NCSH. While pure magnetite did not take up any copper23 from solution the magnetite modified NCSH was found to absorb (0.4 ± 0.2) mmol phosphate per g magnetite. The maximum sorption of NSCH was found to be (5.1 ± 0.5) mmol phosphate per g silicate. This meant that increasing the amount of magnetite still lowered the overall sorption capacity of the composite. The sorption capacity of pure NCSH was found to be considerably higher (5.1 mmol g−1) than in the prior study by Southam (1.94 mmol g−1).10,11 Based on this, one would consider keeping the magnetite content low. However, as observed for copper higher amounts of magnetite led to a more effective magnetic separation.23 Consequently a composite containing 25 wt% magnetite was used for further experiments. Additionally, it was hoped that the higher iron oxide content would also help to elucidate any effects due to the oxide being present.


image file: c4ra07744j-f2.tif
Fig. 2 Phosphate uptake per gram composite versus weight percent of magnetite in the composite.

Elemental analysis has shown that the calcium silicate (once dried at 110 °C) contains approximately 7.1 mmol Ca per gram NCSH (28 wt% Ca).21 Previous XRD studies have proven that initially brushite, CaHPO4·2H2O, is the preferred crystalline phase formed upon phosphate sorption by NCSH.10,11 The Ca[thin space (1/6-em)]:[thin space (1/6-em)]P ratio of 1.4[thin space (1/6-em)]:[thin space (1/6-em)]1 in NCSH is greater than that found in brushite, (1[thin space (1/6-em)]:[thin space (1/6-em)]1), indicating that either unused calcium remains in the silicate or that calcium was lost into solution or reacted with other species. XRD studies showed that after some time the brushite converted into apatite, Ca5(PO4)3(OH), which has a Ca[thin space (1/6-em)]:[thin space (1/6-em)]P ratio of 1.67[thin space (1/6-em)]:[thin space (1/6-em)]1. In this study similar findings were recorded for the composite. Consequently a 25 wt% composite contained about 5 mmol Ca per g composite of which 3.7 mmol g−1 reacted initially to form brushite. As was found for pure NCSH, the brushite reacted over time to form apatite. For the pure silicate and the composite should it be noted that there was not enough calcium to convert all brushite into apatite (Ca[thin space (1/6-em)]:[thin space (1/6-em)]P ratio available 1.4 compared to 1.67 required), it was thought that the final product was a mixture of apatite and brushite. The formation of apatite was thought to be due to a reaction of the residual calcium with the brushite meaning that the calcium originated either from solution (dissolution of NCSH upon contact with solution) or from the surface of the NSCH. The time scale of the conversion (hours to days) indicated that the calcium was very likely still bound to the NCSH and not free as such calcium from solution would be expected to react faster.

Isotherm studies

Isotherm studies were conducted with a calcium silicate composite containing 25 wt% magnetite (dry basis). Initially, the NCSH composite was applied at a loading of 0.5, 1.0 and 2.0 g dm−3 (dry basis). The data (Fig. 3 and Table 1) obtained from the experiments conducted at sorbent loadings of 0.5 g dm−3 were readily modeled by the Langmuir and Freundlich isotherms. For a loading of 0.5 g dm−3 the data conformed best to the Langmuir model (Fig. 3 and Table 1). At higher loadings coefficients of determination for the Freundlich isotherm were higher than those for the Langmuir isotherm. Materials conforming to the Freundlich isotherm are considered to have inhomogeneous binding sites and interactions between the sorbed particles; these could be expected to be more noticeable for higher loadings, which the change in behavior indicated.
image file: c4ra07744j-f3.tif
Fig. 3 Isotherm studies for magnetite composite at different loadings.
Table 1 Key data for isotherm model studies with different loadings of composite [g dm−3]
Loading 0.5 1.0 2.0 Overall
Langmuir isotherm
n [mmol g−1] 3.4 ± 0.1 3.6 ± 0.1 3.7 ± 0.4 3.4 ± 0.2
K [dm3 mmol−1] 2.5 ± 0.4 0.7 ± 0.2 1.7 ± 0.6 1.7 ± 0.4
R2 0.991 0.985 0.944 0.942
[thin space (1/6-em)]
Freundlich isotherm
na 1.70 ± 0.10 1.36 ± 0.05 1.88 ± 0.09 1.66 ± 0.07
C2 2.6 ± 0.3 2.1 ± 0.1 2.6 ± 0.2 2.5 ± 0.2
R2 0.968 0.995 0.984 0.962


Plotting all data at the same scale shows that the sorption capacity of the composite was independent of the loading within the margin of error and behaved according to the Freundlich isotherm. However, the difference between the Langmuir and Freundlich isotherms is below the margin of error for the experiments. As such either model might be applicable.

Attempts were also made to model the data by other isotherms (such as Tempkin, Frumkin and BET). The coefficients of determination for these were on the order of 0.90 to 0.95 and as such less representative of the system than the Langmuir and Freundlich models.

The maximum sorption capacity reached in the isotherm studies was 3.7 mmol g−1 about 73% of the capacity of pure NCSH ((5.1 ± 0.5) mmol g−1). While this could mean that equilibrium had not been reached, the value was in line with the consideration that only 75% of the sample was comprised of NCSH and earlier measurements (Fig. 2).

Kinetic studies

The sorption of H2PO4 was modeled well by a second-order kinetic model with respect to phosphate (Fig. 4 and Table 2), with an R2 value of 0.997. By comparison, the first-order kinetic model provided an R2 value of 0.983. As these values are both relatively high, a second-order model could not definitively be ascribed to the reaction. During the 60 minutes for which data were recorded, the concentration of H2PO4 decreased from (0.99 ± 0.01) mmol dm−3, to (0.138 ± 0.001) mmol dm−3. This means that the calculated residual phosphate concentration the second order kinetics ((0.14 ± 0.01) mmol dm−3) matched the measured value ((0.138 ± 0.001) mmol dm−3) closer than the value for 1st order kinetics ((0.19 ± 0.02) mmol dm−3). Consequently the second order model was more likely than a first-order one. This is in agreement with findings by Southam, who reported second-order kinetics for the non-magnetic NCSH material.10,11 Southam reported two distinct processes occurring in the reaction of NCSH with H2PO4: an initial second order process (with respect to H+) occurring during the first 30 minutes of sorption, attributed to the reaction of NCSH with H+, leading to an increase in the pH of the solution, followed by a second second-order process (with respect to phosphate) in which predominantly H2PO4 reacts with NCSH precipitating calcium phosphate phases such as brushite (CaHPO4·2H2O).
image file: c4ra07744j-f4.tif
Fig. 4 Kinetic studies.
Table 2 Calculated rate data for phosphate sorption by 1 g dm−3 Fe3O4–NCS composite and an initial phosphate load of 0.989 mmol dm−3
  1st order 2nd order
Residual phosphate [mmol dm−3] 0.19 ± 0.02 0.14 ± 0.01
Uptake [mmol dm−3] 0.80 ± 0.05 0.85 ± 0.02
k [1st order: min−1; 2nd order: dm3 mmol−1 min−1] 0.33 ± 0.06 0.8 ± 0.1
R2 0.983 0.997


Continuous uptake studies

The results of the continuous uptake studies of H2PO4 are presented in Fig. 5. Fig. 5a shows the results of an experiment performed with a smaller, 50 cm3, column, whereas Fig. 5b and c display the results from two experiments with the larger 600 cm3 column. As can be seen from the figures, the smaller column achieved saturation, with the phosphate effluent concentration eventually exceeding the influent concentration indicating that breakthrough occurred. A maximum sorption capacity of (0.82 ± 0.06) mmol P per g was calculated for the smaller column. This is significantly less that the 3.7 mmol P per g as measured in the isotherm sorption experiments. The lower sorption capacity is partially explained by the fact that nearly half the mass of sorbent was lost from the column in the effluent stream. The 0.82 mmol P per g figure calculated above is based on the assumption that all sorbent remained in the column and did not react any further. This is only partially realistic, as NCSH is known to degenerate at pH-values below 9, albeit slowly above pH-values of 4.21
image file: c4ra07744j-f5.tif
Fig. 5 Continuous phosphate uptake studies. (a) Using a 50 cm3 column and a sorbent loading of 0.5 g. (b) Using a 600 cm3 and a sorbent loading of 2 g. (c) Using a 600 cm3 and a sorbent loading of 4 g.

By comparison, the two experiments conducted with the larger column (Fig. 5b and c) did not reach saturation. This was shown as the measured phosphate effluent concentration was less than the influent concentration for the duration of the experiment. These experiments exhibited very similar total phosphate sorption (1.4 ± 0.2) mmol P (Fig. 5b) and (1.48 ± 0.08) mmol P (Fig. 5c), despite one experiment having double the loading of NCSH present. This could be due to agglomeration of the sorbent particles limiting the available surface area. As adding more particles did not increase the volume taken up by sorbent in the column it can be surmised that the additional particles only caused further agglomeration and hence did not offer more active sorption sites. The tendency of NCSH to agglomerate has been found in prior studies21 and can be surmised based on a close study of Fig. 1a and 6b and d, where visible clumps of agglomerates can be observed.


image file: c4ra07744j-f6.tif
Fig. 6 Experimental setup of continuous sorption experiments. (a to c) Using a 50 cm3 column; (d) using a 600 cm3.

As can be seen from the images of the experimental set-up (Fig. 6), the Fe3O4–NCSH was dispersed throughout the small column (Fig. 6a to c) to a much greater degree than in the larger column (Fig. 6d). The majority of the sorbent lost from the column was removed in the initial few column volumes of effluent. Fig. 6c demonstrates this. This image shows the discoloration of the 0.45 μm membranes used to filter effluent subsamples subsequent to their collection. It can be seen that the Fe3O4–NCSH was initially lost at a significant rate (as indicated by the black sorbent trapped in the leftmost filter cartridge, labeled ‘A’, in Fig. 6c). By the time the fifth subsample was taken very little sorbent was being lost (the rightmost filter cartridge, labeled ‘E’, shows almost no discoloration).

For the smaller column, a comparatively large fraction of the sorbent was lost into the effluent stream (approximately 44% of the initial mass of sorbent). In contrast, no sorbent was lost from the larger column within the margin of error. This may be explained by examining the solution velocity in the column. The smaller column had an internal diameter of 20 mm, a cross-section of 3.14 cm2. At the flow rate used, this equates to an upward velocity of 3.9 cm min−1. With the larger column, the diameter varied, as it was cone shaped. At the exit point of the column, the internal diameter was 120 mm with a cross-section of 117 cm2. During operation of the large column, the Fe3O4–NCSH material remained dispersed in the lower half of the column (Fig. 6d). The internal column diameter at the upper edge of this Fe3O4–NCSH layer was estimated as 90 mm. This means that the effluent at the upper level of the sorbent layer was moving at a rate of 0.6 cm min−1 and the point of exiting the larger column at a rate of 0.35 cm min−1 (approximately one sixth (or one eleventh respectively) the velocity in the smaller column). As mentioned above the Fe3O4-composite retained the ferrimagnetic properties of the magnetite precursor. The force of the magnetic attraction between the particles was strong enough to keep the sorbent particles together at the flow rates in the large column but too weak to resist the higher flow rates in the smaller column.

Conclusions

Ferrimagnetic Fe3O4–NCSH composite was found to be a suitable sorbent material for phosphate. The composite agglomerates spontaneously and settles within minutes. The sorption capacity for the materials was found to be dependant on the quantity of NCSH present. As Fe3O4 was introduced into the composite material, the sorption capacity decreased accordingly with Fe3O4 accounting for very little of the observed phosphate sorption. For the unmodified NCSH, a sorption capacity of (5.1 ± 0.5) mmol P per g was recorded for phosphate as the H2PO4 ion; sorption capacities of NCSH for other forms of phosphate were not determined. While this is significantly higher than the 1.94 mmol P per g sorption capacity previously reported by Southam10,11 for sorption of H2PO4 on to NCSH, the amount of phosphate sorbed is lower than the amount of calcium present in the material allowing for the formation of brushite (calcium to phosphate molar ratio of 1 to 1).

When isotherm measurements were conducted with the Fe3O4–NCSH composite material (25 wt% Fe3O4) present at a loading of 0.5 g dm−3, the system exhibited good conformity to the Langmuir isotherm and had a calculated maximum sorption capacity, n, of 3.88 mmol P per g, which was similar to pure NCSH per g of silicate. As the loading of Fe3O4–NCSH was increased the sorption behaved more according to the Freundlich isotherm model. However, the differences between the fits to the Langmuir and Freundlich models were too small to allow a confident decision for the applicability of either isotherm model.

The sorption of H2PO4 by Fe3O4–NCSH over a 60 minute time period was adequately described by a second-order kinetic model, having a rate constant of k = (0.8 ± 0.1) dm3 mmol−1 min−1, with a coefficient of determination with a value of 0.997. Similar behavior has been observed by Southam10,11 who attributed this to an acid/base reaction between the acidic H2PO4 solution and the basic NCSH.

Continuous uptake studies were performed in upflow mode using two different reactor sizes and shapes, a small 50 cm3 cylindrical reactor and a large 600 cm3 conical reactor. Under the conditions employed the flow of liquid in the smaller column was too high and overcame the attractive force between the ferrimagnetic particles leading to a significant loss of sorbent. By comparison, the Fe3O4–NCSH sorbent remained in the lower part of the column; no composite was lost within the margin of error. Overall between 33–35% of the phosphate from the influent stream was sorbed by the composite. The system did not reach saturation though, which was probably due to agglomeration of the sorbent particles, which could be visibly observed. Adding more sorbent did not increase the volume the sorbent took up in the column indicating that this might indeed be the case. However the formation of channels in the sorbent due to the cone shape of the column could also account for the fact that the system did not reach saturation. Consequently only a comparatively small amount of surface area was available for sorption. Future experiments could clarify this and allow optimization of the continuous uptake.

The Fe3O4–NCSH sorbent performed well in uptake studies and outperformed many other sorbents (e.g. it has 3–6 times the capacity of zeolites applied under identical conditions22). However, these studies have shown that it has some issues, which will preclude uptake of the material by industry for the purpose of phosphate capture. First amongst these is that Fe3O4–NCSH is consumed during the uptake due to the irreversible loss of calcium from the NCSH component. The brushite and apatite formed have a use as fertilizer but are products of insufficient value to justify use of Fe3O4–NCSH for their production, even if environmental benefits are considered. As the magnetite component does not take part in the sorption, its use adds production costs. Other methods for the recovery of spent NCSH and captured phosphates such as cyclone separation and continuous filtration need to be explored. Even the use of NCSH, if produced from artificial sources of silicate, is barely economical for the uptake of phosphate and production of fertilizers from wastewater. Other more valuable or harmful species would need to be targeted following similar examples of magnetic nanocomposites reported in the literature.29 NCSH would have to be produced from geothermal water, where other factors offset production costs, such as the removal of unwanted silica from the geothermal process. This possibility will be explored in future studies.

Acknowledgements

Part of the work reported in this article was carried out during a research visit at the Water and Geotechnology Division of the Institute for Technical Chemistry at the Forschungszentrum Karlsruhe (FZK), Karlsruhe, Germany. The work was supported by Professor Wolfgang Höll, who passed away in 2010 and will be missed dearly. We would also like to thank Matthias Franzreb of the FZK for his support.

Notes and references

  1. C. G. Weeramantry, Nauru: environmental damage under international trusteeship, Oxford University Press, Melbourne, 1992 Search PubMed.
  2. M. E. Sumner, Handbook of Soil Science, CRC Press, Boca Raton, 2000 Search PubMed.
  3. N. M. Agyei, C. A. Strydom and J. H. Potgieter, Cem. Concr. Res., 2002, 32(12), 1889,  DOI:10.1016/s0008-8846(02)00888-8.
  4. T. Kasama, Y. Watanabe, H. Yamada and T. Murakami, Clay Sci., 2004, 25(3–4), 167,  DOI:10.1016/j.clay.2003.09.005.
  5. D. A. Georgantas and H. P. Grigoropoulou, J. Colloid Interface Sci., 2007, 315(1), 70,  DOI:10.1016/j.jcis.2007.06.058.
  6. J. Berkowitz, M. A. Anderson and C. Amrhein, Water Res., 2006, 40(5), 911,  DOI:10.1016/j.watres.2005.12.018.
  7. G. M. Ayoub, B. Koopman and N. Pandya, Water Environ. Res., 2001, 73, 478 CrossRef CAS , http://www.jstor.org/stable/25045524.
  8. M. S. Onyango, D. Kuchar, M. Kubota and H. Matsuda, Ind. Eng. Chem. Res., 2007, 46(3), 894,  DOI:10.1021/es030488e.
  9. D. C. Southam, T. W. Lewis, A. J. McFarlane and J. H. Johnston, Curr. Appl. Phys., 2004, 4(2–4), 355,  DOI:10.1016/j.cap.2003.11.047.
  10. D. C. Southam, Phosphate in the environment: its analysis and removal using advanced materials, Ph.D. thesis, University of Tasmania, 2005.
  11. D. C. Southam, T. W. Lewis, A. J. McFarlane, T. Borrmann and J. H. Johnston, J. Colloid Interface Sci., 2008, 319, 489,  DOI:10.1016/j.jcis.2007.12.012.
  12. J. Chen, H. Kong, D. Wu, X. Chen, D. Zhang and Z. Sun, J. Hazard. Mater., 2007, 139(2), 293,  DOI:10.1016/j.jhazmat.2006.06.034.
  13. Y. Song, P. G. Weidler, U. Berg, R. Nüesch and D. Donnert, Chemosphere, 2006, 63, 236,  DOI:10.1016/j.chemosphere.2005.08.021.
  14. S. Karaca, A. Gürses, M. Ejder and M. Acikyildiz, J. Colloid Interface Sci., 2004, 277, 257,  DOI:10.1021/es061836q.
  15. J.-Z. Zhang and X.-L. Huang, Environ. Sci. Technol., 2007, 41(8), 2789,  DOI:10.1021/es061836q.
  16. M. B. M. Monte, A. C. P. Duarte, J. A. P. Bonapace, J. Do Amaral, R. Manoel, A. Vieyra and F. De Souza-Barros, Origins Life Evol. Biospheres, 2003, 33(1), 37,  DOI:10.1023/a:1023974424070.
  17. Y. M. Tzou, M. K. Wang and R. H. Loeppert, Arch. Environ. Contam. Toxicol., 2003, 44(4), 445,  DOI:10.1007/s00244-002-2090-6.
  18. V. E. Badillo-Almaraz and J. Ly, J. Colloid Interface Sci., 2003, 258(1), 27,  DOI:10.1016/s0021-9797(02)00178-9.
  19. C. Liu, Y. Huang, W. Shen and J. Cui, Biomaterials, 2001, 22, 301,  DOI:10.1016/s0142-9612(00)00166-6.
  20. J. C. Heughebaert and G. Montel, Calcif. Tissue Int., 1982, 34, S103 CrossRef.
  21. A. J. McFarlane, The Synthesis and Characterisation of Nanostructured Calcium Silicate, Ph.D. thesis, Victoria University of Wellington, 2008.
  22. J. C. Lai, T. Borrmann, M. J. Cairns, J. H. Johnston, B. G. Anderson, N. B. Milestone and W. H. Hoell, Nanostructured Calcium Silicate as Micro-Sorbent Material, Nano- & Bionano-Technology, Quantum Transport & Quantum Functional Semiconductors (NBT-QT), Wellington, New Zealand, 8–10 Feb 2007 Search PubMed.
  23. M. J. Cairns, G. M. Barassi and T. Borrmann, Environ. Chem., 2014, 11(3), 303,  DOI:10.1071/en13183.
  24. M. J. Cairns, C. Krauss and J. H. Johnston, NSTI-Nanotech 2013, 2013, vol. 3, p. 746, ISBN 978-1-4822-0586-2, http://www.nsti.org Search PubMed.
  25. G. H. Jeffery, J. Bassett, J. Mendham and R. C. Denney, Vogel’s Textbook of Quantitative Chemical Analysis, Wiley & Sons, New York, fifth edition, 1989 Search PubMed.
  26. C. X. Galhardo and J. C. Masini, Anal. Chim. Acta, 2000, 417, 191,  DOI:10.1016/s0003-2670(00)00933-8.
  27. H.-N. Chou and C. A. Naleway, Anal. Chem., 1984, 56(9), 1737,  DOI:10.1021/ac00273a048.
  28. ISO Standard 6878:2004, Water Quality – Determination of phosphorus – Ammonium molybdate spectrographic method, International Organisation for Standardization, Geneva, Switzerland, 2004 Search PubMed.
  29. C. Gao, X.-Y. Yu, T. Luo, Y. Jia, B. Sun, J.-H. Liu and X.-J. Huang, J. Mater. Chem. A, 2014, 2, 2119,  10.1039/c3ta13526h.

Footnotes

Electronic supplementary information (ESI) available. See DOI: 10.1039/c4ra07744j
Present address: Othbergstr. 10, 37632 Eschershausen, Germany. E-mail: E-mail: aoc@gmx.li; Tel: +49 5534 869.

This journal is © The Royal Society of Chemistry 2014
Click here to see how this site uses Cookies. View our privacy policy here.