Reinforced magnetic epoxy nanocomposites with conductive polypyrrole nanocoating on nanomagnetite as a coupling agent

Jiang Guoab, Xi Zhangab, Hongbo Gua, Yiran Wangab, Xingru Yanab, Daowei Dingab, Jun Long*ac, Sruthi Tadakamallaa, Qiang Wangd, Mojammel A. Khane, Jingjing Liuf, Xin Zhangg, Brandon L. Weeksg, Luyi Sunf, David P. Younge, Suying Wei*ab and Zhanhu Guo*a
aIntegrated Composites Lab (ICL), Dan F. Smith Department of Chemical Engineering, Lamar University, Beaumont, TX 77710, USA. E-mail: zhanhu.guo@lamar.edu; nanomaterials2000@gmail.com
bDepartment of Chemistry and Biochemistry, Lamar University, Beaumont, TX 77710, USA. E-mail: suying.wei@lamar.edu
cSchool of Chemical Engineering and Technology, Harbin Institute of Technology, Harbin, Heilongjiang 150001, China. E-mail: longjun@hit.edu.cn
dCollege of Environmental Science and Engineering, Beijing Forestry University, Beijing 100083, China
eDepartment of Physics and Astronomy, Louisiana State University, Baton Rouge, LA 70803, USA
fDepartment of Chemical & Biomolecular Engineering Polymer Program, Institute of Materials Science University of Connecticut, Storrs, CT 06269, USA
gDepartment of Chemical Engineering, Texas Tech University, Lubbock, Texas 79409, USA

Received 20th July 2014 , Accepted 1st August 2014

First published on 1st August 2014


Abstract

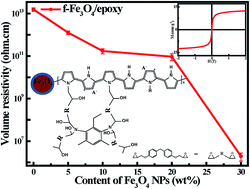
The new function of polypyrrole (PPy) to serve as a coupling agent has been demonstrated in preparing conductive epoxy resin nanocomposites with PPy coating on magnetite (f-Fe3O4) nanoparticles. The effects of magnetic nanofiller loading level on the rheological behavior, thermal stability, dynamic mechanical properties, mechanical properties, electrical conductivity, dielectric properties and magnetic properties were systematically studied. Compared with pure epoxy suspension, a reduced viscosity was observed in epoxy nanosuspensions with 5.0 wt% f-Fe3O4 nanoparticles, and the viscosity increased with further increasing f-Fe3O4 nanoparticle loading. Increased glass transition temperature (Tg) and enhanced mechanical tensile strength were observed in the cured solid epoxy polymer nanocomposites (PNCs) with f-Fe3O4 nanoparticles. The volume resistivity of the cured epoxy PNCs with 30.0 wt% f-Fe3O4 nanoparticles was decreased almost 7 orders of magnitude compared with the cured pure epoxy (1.6 × 10¹³ Ω cm). The cured epoxy PNCs exhibited good magnetic properties, and the surface functionality and epoxy matrix have little effect on the magnetic moment of the Fe3O4 nanoparticles. The role of PPy nanocoating on the nanocomposite formation mechanism was investigated by using the Fourier transform infrared spectroscopy (FT-IR) and thermogravimetric analysis (TGA) tests.

1. Introduction

Adding functional nanofillers, such as carbon nanotubes, carbon nanofibers, iron oxide nanoparticles, silicon carbide nanoparticles and silica nanoparticles, to polymeric materials has attracted tremendous interest because of the combined advantages of both the polymers and the nanoparticles. This combination could make the polymer-based nanocomposite materials suitable for many potential applications such as energy storage devices,1–3 sensors,4–7 electrochromic smart windows,8–12 conducting membranes for fuel cells,13 microwave absorbers,14 capacitors,15,16 anticorrosive coating,17 and fire retardant composites.18–20 Due to the high tensile strength, Young's modulus, chemical resistance, and good thermal and electrical insulating properties, epoxy is one of the most widely used engineering thermosetting materials21 and has been deployed in different industries including coatings, adhesives, marine, aerospace, semiconductor encapsulation and electronics.22,23 In order to improve the mechanical properties and introduce new physicochemical properties, such as electrical conductivity, magnetic and optical properties,24 various nanofillers have been introduced into the epoxy matrix. For example, Zhu et al. used carbon nanofibers to improve the mechanical property and electrical conductivity of the epoxy.22

Magnetite (Fe3O4), because of its unique catalytic, biocompatibility and relatively high saturation magnetization25 has been widely applied in many fields, such as catalysis, information storage, color imaging, and adsorbents for removing heavy metals from contaminated water.26 Incorporating Fe3O4 can introduce magnetic property into the magnetic inert epoxy and could widen the applications of epoxy in electronic, biomedical, and environment remediation fields.21 However, due to the large specific surface area and strong dipole–dipole interaction,26 the magnetite nanoparticles can become agglomerated easily. On the other hand, the poor interfacial compatibility between the magnetite nanoparticles and the polymer matrix would reduce the mechanical property of the nanocomposites.

The surface treatment of nanofillers can improve dispersion quality and enhance interfacial interactions between inorganic nanofillers and polymer matrix through chemical modifications22,27–29 and microwave heating.30 Recently, polymers have also been reported as an effective way to functionalize the nanofillers. For example, Gu et al. have used polyaniline (PANI) as a coupling agent to improve the dispersion quality and to enhance the interfacial interactions between Fe3O4 nanoparticles and epoxy matrix,21 and reported the flame retardant epoxy nanocomposites reinforced with PANI-stabilized silica nanoparticles.18 Zhang et al. have reported high dielectric permittivity and reduced flammability of epoxy barium titanate nanocomposites with PANI as the coupling agent.20 Except the high conductivity (21.14 S cm−1),26 low cost, and easy preparation, polypyrrole (PPy)31 with the secondary amines in its backbone32 has great potential to serve as a coupling agent to improve the dispersion quality and interaction between Fe3O4 nanoparticles and epoxy matrix, which has not been reported yet. With high conductivity and magnetic property, the polymer nanocomposites (PNCs) with PPy functionalized Fe3O4 (f-Fe3O4) nanoparticles have potential applications, for example, electromagnetic interference (EMI) shielding, microwave absorbers and magnetic field sensing.7,33

In this work, the coupling role of polypyrrole was demonstrated in synthesizing magnetic epoxy PNCs filled with different loading levels of the Fe3O4 nanoparticles coated with PPy. The facile surface initiated polymerization (SIP) method was used to coat PPy on the Fe3O4 nanoparticle surface. The effects of the nanoparticle loading, surface functionalization of Fe3O4 nanoparticles, and temperature on the viscosity of epoxy resin nanosuspensions were investigated. For the cured solid nanocomposites, the roles of PPy coating on the thermal stability, mechanical properties including the tensile and thermomechanical properties, dielectric permittivity, volume resistivity, and magnetic properties were studied in the composites and compared with those filled with the as-received Fe3O4 (u-Fe3O4) nanoparticles. The PNCs formation mechanism was investigated by the Fourier transform infrared spectroscopy (FT-IR) and thermogravimetric analysis (TGA).

2. Experimental section

2.1 Materials

The Epon 862 (bisphenol F epoxy) and the curing agent EpiCure W were provided by Miller-Stephenson Chemical Company, Inc. Scheme 1 shows the molecular structures of these chemicals. Pyrrole (C4H5N, ≥98%), ammonium persulfate (APS, (NH4)2S2O8, 98%) and p-toluene sulfonic acid (PTSA, C7H8O3S, ≥98.5%) were purchased from Sigma-Aldrich. The Fe3O4 nanoparticles with an average diameter of 20 nm were obtained from Nanjing Emperor Nano Material Co., Ltd., China. All the chemicals were used as-received without any further treatment.
image file: c4ra07359b-s1.tif
Scheme 1 Molecular structure of Epon 862 and the used curing agent Epicure W.

2.2 Preparation of Fe3O4/epoxy PNCs nanosuspensions

Epon resin nanosuspensions containing 5.0, 10.0, 20.0 and 30.0 wt% u-Fe3O4 and f-Fe3O4 nanoparticles were prepared (the method for the surface functionalization of Fe3O4 nanoparticles is described in the ESI). Both u-Fe3O4 and f-Fe3O4 nanoparticles were immersed in Epon resin overnight without any disturbance to wet the nanoparticles completely. Then the suspension was mechanically stirred for one hour (600 rpm, Heidolph, RZR 2041). All the procedures were carried out at room temperature.

2.3 Rheology

The viscosity of liquid epoxy nanosuspensions was studied in a Rheometer (TA Instruments, AR2000ex ETC system). The measurements were performed in a cone-plate geometry with a diameter of 40 mm and a truncation of 64 μm. The steady state flow procedure was used, and the measurements were done at 25, 70 and 120 °C, respectively. The shear rate was from 1 to 1000 s−1. The specimens placed between the cone and plate were allowed to equilibrate for approximately two minutes prior to each test.

2.4 Curing of the Fe3O4/epoxy PNCs

The curing agent EpiCure W was added into the Epon monomers or the above prepared Fe3O4 nanoparticles Epon resin nanosuspensions with a monomer/curing agent ratio of 100/26.5 for one hour mechanical stirring (200 rpm). Then the solution was mechanically stirred at 70 °C for 2–3 h (200 rpm), which was essential to remove the bubbles and to prevent the sedimentation of Fe3O4 nanoparticles during the curing process. Cautions: when the temperature was 70 °C, the viscosity of epoxy nanosuspensions with 30.0 wt% f-Fe3O4 nanoparticles was very high. In order to decrease the viscosity, the epoxy solution with 30.0 wt% f-Fe3O4 nanoparticles was mechanically stirred at 85 °C. Finally, the solutions were poured into the silicone molds and cured at 120 °C for 5 hours. In order to remove the bubbles, the silicone molds were put into the vacuum oven at 120 °C for one hour. Then the molds were cooled down to room temperature naturally.

2.5 Morphology and dispersion quality examination

A system with a JEOL field emission scanning electron microscope (SEM, JSM-6700F) was used to observe the morphologies of the u-Fe3O4 and f-Fe3O4 nanoparticles and the fracture surfaces of the cured epoxy PNCs after doing the tensile test. The SEM specimens were prepared by sputter coating a thin gold layer (ca. 3 nm). The morphologies of epoxy nanosuspensions were examined by a Hitachi S4300 scanning electron microscopy. The samples were made by dropping each liquid into carbon tapes and then were dried at room temperature in a vacuum oven for one hour. All the samples were sputter coated with a thin layer of gold (about 5 nm) to ensure good conductivity for better imaging. The morphologies of the u-Fe3O4 and f-Fe3O4 nanoparticles were further characterized by a transmission electron microscopy (TEM, JEOL 2010 FasTEM) with a field-emission gun, operated at an accelerating voltage of 200 kV. The TEM samples were prepared by drying a drop of ethanol suspension on a carbon-coated 400-mesh copper grid.

2.6 FT-IR characterization

The chemical structure of the u-Fe3O4 nanoparticles, f-Fe3O4 nanoparticles, and pure PPy was analyzed by a Fourier transform infrared spectroscopy (FT-IR), coupled with an ATR accessory (Burker Vector 22) in the range of 500–4000 cm−1 with a resolution of 4 cm−1.

2.7 Thermal property

The thermal stability was studied in a thermogravimetric analysis (TGA, TA Instruments, Q-500) with a heating rate of 10 °C min−1 under an air flow rate of 60 mL min−1 from 30 to 800 °C. Differential scanning calorimeter (DSC, Q2000, TA Instruments) measurements were implemented under a nitrogen flow rate of approximately 20 mL min−1 at a heating rate of 10 °C min−1 from 25 to 300 °C.

2.8 Mechanical property

Tensile tests were carried out following ASTM, D412-98a in a unidirectional tensile test machine (ADMET tensile strength testing system 2610). The parameters (displacement and force) were controlled by a digital controller (MTESTQuattro) with MTESTQuattro Materials Testing Software. The samples (dog-bone shaped) were designed according to the ASTM standard requirement and prepared as described for epoxy PNCs in the molds. A crosshead speed of 1 mm min−1 was used and the strain (mm/mm) was calculated by dividing the jogging displacement by the original gauge length. Dynamic mechanical analysis (DMA) was performed in the torsion rectangular mode by using an AR2000ex (TA Instruments) with a strain of 0.05%, a frequency of 1 Hz and a heating rate of 2 °C min−1 in the range of 30–250 °C. The sample dimensions were 12 × 3 × 40 mm3.

2.9 Volume resistivity and dielectric permittivity

The volume resistivity was measured by testing the DC resistance along the disc samples with a diameter of about 60 mm with an Agilent 4339B high resistance meter, which allows the resistivity measurement up to 1016 Ω cm and by a four-probe technique (C4S 4-Point Probe Head Cascade Microtech, the probe tips were made of tungsten carbide). The same samples were also used to measure the dielectric properties on a LCR meter (Agilent, E4980A) equipped with a dielectric test fixture (Agilent, 16451B) in the frequency range from 20 to 2[thin space (1/6-em)]000[thin space (1/6-em)]000 Hz at room temperature. A piece of rectangular standard Teflon sample with a permittivity of 2.1 to 2.4 was used for calibration before each test.

2.10 Magnetic property

The magnetic properties were investigated in a 9-Tesla Physical Properties Measurement System (PPMS) by Quantum Design at room temperature.

2.11 Polymer nanocomposite formation mechanism: role of polypyrrole coating

To investigate the PNCs formation mechanism (the interaction between PPy and epoxy matrix), the f-Fe3O4 and PPy nanoparticles epoxy nanosuspensions without adding the curing agent were prepared. First, the f-Fe3O4 nanoparticles (5.0 wt% loading) (or PPy) were mechanically stirred (600 rpm) with epoxy monomers at room temperature for one hour. Second, the above solution was performed at low speed mechanical stirring (200 rpm) for one hour. In order to study the reaction between PPy and epoxy, the curing agent was not added. Then the solution was further treated at 70 °C for 2 hours combined with mechanical stirring (200 rpm). Finally, the suspended solution was cured at 120 °C for 5 hours and then cooled down to room temperature naturally. The final viscous solution was washed with excessive acetone and vacuum filtered to remove any excessive epoxy monomers. The obtained powders were dried in an oven overnight at 50 °C for FT-IR and TGA tests. A small amount of viscous solution was used to do the TGA test as well.

3. Results and discussion

3.1 Rheological behavior of the liquid epoxy resin nanosuspensions

Effect of Fe3O4 nanoparticle loading. Fig. 1(a) depicts the viscosity as a function of nanoparticle loading in the f-Fe3O4 suspended epoxy solution at room temperature. The viscosity decreases with increasing the shear rate and increases with increasing the f-Fe3O4 nanoparticle loading. For pure epoxy, the Newtonian behavior (viscosity being independent of shear rate) is observed when the shear rate is lower than 400 s−1. When the shear rate is higher than 400 s−1, the viscosity slightly deceases with increasing the shear rate, which is attributed to the entanglement of Epon resin molecular chains.24 For epoxy nanosuspensions with different loadings of f-Fe3O4 nanoparticles, the viscosity of epoxy resin nanosuspensions with 5.0 wt% f-Fe3O4 nanoparticles is lower than that of pure epoxy. Some studies related the decreased viscosity to the dilution effect of the nanoparticles, which provides constraint release and leads to the viscosity reduction.34 However, the shape of nanoparticles is reported to have an important effect on the viscosity and the spherical nanoparticles was reported to decrease the viscosity.35 From the SEM and TEM images of the f-Fe3O4 nanoparticle in Fig. S1, the shape of nanoparticles is ball-like. Therefore, the decreased viscosity of epoxy resin nanosuspensions with 5.0 wt% f-Fe3O4 nanoparticles is mainly induced by the spherical f-Fe3O4 nanoparticles. The epoxy resin nanosuspensions with 5.0 wt% f-Fe3O4 nanoparticles with a decreased viscosity is beneficial for the nanocomposites processing and manufacturing. The epoxy nanosuspensions with 10.0 wt% f-Fe3O4 nanoparticles show a lower viscosity compared with pure epoxy, when the shear rate is lower than 600 s−1. However, when the loading of f-Fe3O4 nanoparticles is 20.0 wt%, the viscosity increases significantly due to the agglomeration of the f-Fe3O4 nanoparticles. The shear stress increases with increasing the shear rate, Fig. S5, in pure epoxy and its nanosuspensions with 5.0 and 10.0 wt% f-Fe3O4 nanoparticles. The Newtonian behavior is also observed in the epoxy nanosuspensions with 5.0 and 10.0 wt% f-Fe3O4 nanoparticles at low shear rates (<400 s−1) and the pseudoplastic behavior (the viscosity decreases with increasing the shear rate) is observed at high shear rates (>400 s−1). The epoxy nanosuspensions with 20.0 wt% f-Fe3O4 nanoparticles exhibit the pseudoplastic behavior within the whole measured shear rate, which is due to the increased solution inertia arising from high f-Fe3O4 nanoparticle loading.36
image file: c4ra07359b-f1.tif
Fig. 1 (a) Viscosity vs. shear rate of the epoxy nanosuspensions with different loadings of f-Fe3O4 nanoparticles at room temperature; (b) the effect of surface functionalization on the viscosity of epoxy nanosuspension with 10.0 wt% u-Fe3O4 and f-Fe3O4 nanoparticles at room temperature; and (c) the effect of temperature on the viscosity of epoxy suspensions with 10.0 wt% u-Fe3O4 and f-Fe3O4 nanoparticles.
Effect of surface modification. Fig. 1(b) shows the surface functionalization effect on the viscosity of epoxy nanosuspensions with u-Fe3O4 and f-Fe3O4 nanoparticles at room temperature. The viscosity of epoxy nanosuspensions with f-Fe3O4 nanoparticles is a little higher than that of the epoxy nanosuspensions with u-Fe3O4 nanoparticles, indicating that the surface modification increases the interaction between nanoparticles and epoxy matrix.21 The pseudoplastic behavior is observed in the epoxy nanosuspensions with both u-Fe3O4 and f-Fe3O4 nanoparticles at high shear rates (>400 s−1). However, the viscosity difference between epoxy nanosuspensions with u-Fe3O4 and f-Fe3O4 nanoparticles is not diminished at higher shear rates, different from the result of polyaniline stabilized magnetite nanoparticles epoxy nanocomposites.21 Because of the high loading of Fe3O4 nanoparticles in the epoxy nanosuspensions, the nanoparticles cannot be aligned well in the epoxy even at higher shear rates.
Effect of temperature. The viscosity of epoxy nanosuspensions is strongly dependent on the temperature. Fig. 1(c) shows the viscosity of epoxy nanosuspensions with a u-Fe3O4 and f-Fe3O4 nanoparticle loading of 10.0 wt% at 25, 70 and 120 °C. The viscosity of epoxy nanosuspensions with u-Fe3O4 and f-Fe3O4 nanoparticles decreases with increasing the temperature, which is due to the relaxation of polymer chains.37,38 The viscosity of epoxy nanosuspensions with f-Fe3O4 nanoparticles is higher than that of the epoxy nanosuspensions with u-Fe3O4 nanoparticles due to the interactions between the PPy layer on the f-Fe3O4 nanoparticles and the epoxy monomer molecules, which make the epoxy nanosuspensions more resistant to external stress and thus cause a higher viscosity.22 The viscosity difference between epoxy nanosuspensions with u-Fe3O4 and f-Fe3O4 nanoparticles is not diminished with increasing the temperature. It is interesting to note that the viscosity difference is decreased at very low shear rates only when temperature is 70 and 120 °C.

3.2 Thermal stability analysis

Fig. 2(a) shows the effect of f-Fe3O4 nanoparticle loading and surface functionalization on the thermal stability of the cured epoxy PNCs. Both the cured pure epoxy and its PNCs show similar decomposition profiles. Two main degradation stages are observed during the decomposition. A slight weight loss from ∼200 to 300 °C is due to the hemolytic scission of chemical bonds in the network.23 Due to the elimination of water molecule from the oxypropylene group, –CH2–CH(OH)–, and the simultaneous breakdown of epoxy network when the temperature range is about 350 to 450 °C, the weight loss of cured pure epoxy and PNCs is very huge.39 The second weight loss at about 460 to 510 °C arises from the degradation of benzene rings of the cured epoxy, because the C–C bonding energy in benzene is 566 kJ mol−1, which is between the bonding energy of C–C (611 kJ mol−1) and C[double bond, length as m-dash]C (348 kJ mol−1) in benzene ring.40
image file: c4ra07359b-f2.tif
Fig. 2 TGA curves of (a) the cured pure epoxy and its PNCs filled with different f-Fe3O4 nanoparticle loadings, and (b) the cured epoxy PNCs with a u-Fe3O4 and f-Fe3O4 nanoparticle loading of 10.0 wt%.

The 5.0% weight loss temperature (T5%), first (Td1) and second (Td2) onset decomposition temperatures are summarized in Table 1. Compared with the cured pure epoxy, the thermal stability of the cured epoxy PNCs with different loadings of f-Fe3O4 nanoparticles is slightly decreased, which is due to the obstructive effect of the f-Fe3O4 nanoparticles on the formation of high cross-linked molecular structure of epoxy matrix or the increased free volume fractions in the PNCs.41,42 There is a peak observed at round 260 °C in the DSC curve of cured epoxy PNCs with 10 wt% f-Fe3O4 nanoparticles, Fig. S4, indicating the obstructive effect of the f-Fe3O4 nanoparticles on the cross-link structure formation of epoxy matrix. Zhu et al. also reported a decreased thermal stability of epoxy PNCs with different core–shell structured Fe@FeO nanoparticles.24 From Table 1, the T5%, Td1 and Td2 are observed to change slightly with increasing the f-Fe3O4 nanoparticles. For the cured epoxy PNCs with a f-Fe3O4 nanoparticle loading of 30.0 wt%, the T5%, Td1, and Td2 are observed to decrease by 42.5, 23.3 and 41.2 °C, respectively, compared with that of the cured pure epoxy.

Table 1 TGA results of the cured pure epoxy and PNCs with different loadings of Fe3O4 nanoparticles
Sample T5% (°C) Td1 (°C) Td2 (°C)
Epoxy 367.0 374.5 517.6
5.0 wt% f-Fe3O4 334.1 359.5 461.6
10.0 wt% f-Fe3O4 330.0 352.9 458.2
10.0 wt% u-Fe3O4 353.3 357.9 450.0
20.0 wt% f-Fe3O4 316.6 355.1 461.6
30.0 wt% f-Fe3O4 324.5 351.2 476.4


Fig. 2(b) shows the comparison of the thermal stability of the cured epoxy PNCs filled with 10.0 wt% f-Fe3O4 and u-Fe3O4 nanoparticles. The T5% of the cured epoxy PNCs with 10.0 wt% f-Fe3O4 nanoparticles is about 23.3 °C lower than that of the cured epoxy PNCs with 10.0 wt% u-Fe3O4 nanoparticles, Table 1, which is due to the decomposition of PPy on the f-Fe3O4 nanoparticles in the cured epoxy PNCs.31 The Td1 for the cured epoxy PNCs with 10.0 wt% f-Fe3O4 nanoparticles is almost the same as that of the cured epoxy PNCs with 10.0 wt% u-Fe3O4 nanoparticles. The Td2 for the cured epoxy PNCs with 10.0 wt% f-Fe3O4 is 8.2 °C higher than that of the cured epoxy PNCs with 10.0 wt% u-Fe3O4 nanoparticles, which may be due to the fact that the cured epoxy PNCs with u-Fe3O4 nanoparticles have more free volume fractions than that of the cured epoxy PNCs with f-Fe3O4 nanoparticles.

3.3 Dynamic mechanical properties

Dynamic mechanical analysis provides information on the storage modulus (G′), loss modulus (G′′), and loss factor (tan[thin space (1/6-em)]δ) of the cured pure epoxy and its PNCs with different f-Fe3O4 loadings within the measured temperatures. The G′ represents the elastic property of the nanomaterials during the test, while the G′′ is related to the energy dissipation that is associated with the motion of the polymer chains of nanomaterials.43,44 Fig. 3(a) depicts the G′ as a function of temperature of the cured pure epoxy and its PNCs filled with different f-Fe3O4 nanoparticle loadings. At the glass state below 30 °C, the molecules are “frozen” and the polymer chains cannot move.45 The G′ of the cured epoxy PNCs with a f-Fe3O4 loading of 5.0, 10.0, 20.0 and 30.0 wt% is 1.34, 1.42, 1.32 and 1.51 GPa, respectively. The cured pure epoxy has a low G′ of only 1.17 GPa at the glass state. At the rubbery state above 200 °C, the molecules can wiggle around and the polymer chains are able to make movements.46 The G′ of the cured epoxy PNCs with different f-Fe3O4 loadings (7.65 MPa for 5.0 wt%, 12.2 MPa for 10.0 wt%, 15.7 MPa for 20.0 wt%, and 18.3 MPa for 30.0 wt%) is higher than that of cured pure epoxy (6.71 MPa). The increased G′ of the cured epoxy PNCs with different f-Fe3O4 loadings is due to the confinement of polymer chains, which is also observed in the carbon nanofibers reinforced epoxy nanocomposites.22 Fig. 3(b) shows the G′′ as a function of temperature of the cured pure epoxy and its PNCs with different loadings of f-Fe3O4 nanoparticles. The G′′ shows a similar trend as G′. The tan[thin space (1/6-em)]δ is the ratio of the G′′ to the G′, and the peak of the tan[thin space (1/6-em)]δ is used to determine the glass transition temperature (Tg). Fig. 3(c) shows the tan[thin space (1/6-em)]δ as a function of temperature of the cured pure epoxy and its PNCs with different f-Fe3O4 loadings. The Tg (87.4 °C) of the cured epoxy PNCs with a f-Fe3O4 loading of 5.0 wt% is very close to that of the cured pure epoxy (88.2 °C), which is due to less confinement imposed on the polymer chains.22 However, the Tg of the cured epoxy PNCs filled with 10.0, 20.0 and 30.0 wt% f-Fe3O4 nanoparticles is 12.4, 19.2, and 25.3% higher than that of the cured pure epoxy, respectively. The Tg of the cured epoxy PNCs increases with increasing the f-Fe3O4 loading, indicating the increased interaction between f-Fe3O4 nanoparticles and epoxy matrix. The increased f-Fe3O4 loading in the PNCs restricts the segmental movement of the polymer chains that would cause a higher Tg. This phenomenon was also observed in the epoxy nanocomposites reinforced with PANI stabilized multi-walled carbon nanotubes.23
image file: c4ra07359b-f3.tif
Fig. 3 The (a) storage modulus (G′), (b) loss modulus (G′′), and (c) tan[thin space (1/6-em)]δ vs. temperature of the cured pure epoxy and its PNCs with different f-Fe3O4 nanoparticle loadings.

The effect of the nanoparticle surface functionalization on the DMA properties of the cured epoxy PNCs was investigated. Fig. 4 shows the G′, G′′ and tan[thin space (1/6-em)]δ for the cured epoxy PNCs with 20.0 wt% u-Fe3O4 and f-Fe3O4 nanoparticles. In Fig. 4(a), the G′ of the cured epoxy PNCs with u-Fe3O4 nanoparticles is higher than that of the cured epoxy PNCs with f-Fe3O4 nanoparticles at both glassy and rubbery states. The decreased G′ for the cured epoxy PNCs with f-Fe3O4 nanoparticles is delayed by 10.2 °C compared with that of the epoxy PNCs with u-Fe3O4 nanoparticles, indicating that the thermomechanical stability is improved due to the strong interaction between the f-Fe3O4 nanoparticles and the epoxy matrix. The Tg of the cured epoxy PNCs with f-Fe3O4 nanoparticles is about 10.7 °C higher than that of the cured epoxy PNCs with u-Fe3O4 nanoparticles, Fig. 4(c). Due to the surface functionalization of the Fe3O4 nanoparticles, the cross-linking between the f-Fe3O4 nanoparticles and epoxy matrix would be formed and restrict the segmental motions of polymer chains in the PNCs. And it is well known that the change of Tg reflects the effects of fillers on the segmental motions in the PNCs.47 In this project, the f-Fe3O4 nanoparticles restrict the motion of polymer chains, however, the u-Fe3O4 nanoparticles have less effect on the motion of polymer chains. Therefore, the cured epoxy PNCs with f-Fe3O4 nanoparticles exhibit a higher Tg than that of the PNCs with u-Fe3O4 PNCs.


image file: c4ra07359b-f4.tif
Fig. 4 The (a) storage modulus (G′), (b) loss modulus (G′′), and (c) tan[thin space (1/6-em)]δ vs. temperature of the cured epoxy PNCs with 20.0 wt% loading of u-Fe3O4 and f-Fe3O4 nanoparticles.

3.4 Tensile properties

The effects of particle functionalization and loading level on the tensile strength and Young's modulus were investigated by the tensile test. Fig. 5 shows the representative stress–strain curves of the cured pure epoxy and its PNCs filled with different loadings of u-Fe3O4 and f-Fe3O4. The tensile strength of the cured epoxy PNCs with 5.0 wt% u-Fe3O4 nanoparticles is 86.9 MPa, which is slightly higher than that of the cured pure epoxy, 83.0 MPa. When increasing the u-Fe3O4 nanoparticle loading, the tensile strength of the cured epoxy PNCs with 20.0 wt% u-Fe3O4 decreases dramatically to 43.9 MPa, which is due to the poor interaction between the u-Fe3O4 nanoparticles and the epoxy matrix.21 Compared with the cured pure epoxy, the tensile strength of the cured epoxy PNCs with 5.0 wt% f-Fe3O4 increases by 10.5% (8.7 MPa), indicating that the surface functionalization of the Fe3O4 nanoparticles has improved the tensile strength of epoxy arising from the enhanced interfacial reaction between the Fe3O4 nanoparticles and the epoxy matrix.48 For the cured epoxy PNCs with 20.0 wt% f-Fe3O4 nanoparticles, the tensile strength is decreased to 44.5 MPa, which is induced by the agglomeration of the Fe3O4 nanoparticles. The Young's modulus of the cured epoxy PNCs with 5.0 and 20.0 wt% f-Fe3O4 is higher than that of the cured pure epoxy, which is due to the introduced stiff interfacial layer formed between the f-Fe3O4 nanoparticles and the epoxy matrix making the deformation of polymer more difficult.21
image file: c4ra07359b-f5.tif
Fig. 5 Stress–strain curves of (a) cured pure epoxy and its PNCs with (b) 5.0 wt% f-Fe3O4, (c) 5.0 wt% u-Fe3O4, (d) 20.0 wt% f-Fe3O4, and (e) 20.0 wt% u-Fe3O4 nanoparticles, respectively.

3.5 Microstructures of the fracture surface

Fig. 6 shows the SEM microstructures of the fracture surface of the cured pure epoxy and its PNCs with different f-Fe3O4 and u-Fe3O4 nanoparticle loadings. The cured pure epoxy, Fig. 6(a) and (b), depicts a relatively smooth fracture surface with “river-like” patterns, which belong to a brittle failure because of the rapid crack propagation.49 However, compared with the cured pure epoxy, the fracture surface of the cured epoxy PNCs with different loadings of f-Fe3O4 and u-Fe3O4 nanoparticles, Fig. 6(c), (e) and (g), is rougher, which is due to the matrix shear yielding or polymer deformation between the Fe3O4 nanoparticles. Similar results were also observed in the alumina nanoparticles reinforced vinyl ester resin nanocomposites.50 The mechanical properties of the cured epoxy PNCs are related to the interfacial interactions between the nanoparticles and the epoxy matrix. For the cured epoxy PNCs with 5.0 wt% u-Fe3O4 nanoparticles, Fig. 6(c) and (d), the fracture surface of the cured epoxy PNCs with 5.0 wt% u-Fe3O4 nanoparticles is rougher than that of the cured pure epoxy. The enlarged SEM image, Fig. 6(d), shows that the u-Fe3O4 nanoparticles have a good dispersion in the epoxy matrix. However, for the cured epoxy PNCs with 5.0 wt% f-Fe3O4 nanoparticles in the enlarged SEM image, Fig. 6(f), the observed cracks pass around the nanoparticles without damaging them, which indicates a good adhesion between the nanoparticles and the epoxy matrix with an effective load transfer from weak polymer matrix to the strong f-Fe3O4 nanoparticles with a resultant higher mechanical strength.21 Fig. 6(g) and (h) shows the fracture surface of the cured epoxy PNCs with 20.0 wt% f-Fe3O4 nanoparticles, the agglomeration of f-Fe3O4 nanoparticles is obviously observed, marked by the red cycles, causes the decreased tensile strength, Fig. 5. The same agglomeration phenomenon was also observed in the polyaniline stabilized Fe3O4 nanoparticles reinforced epoxy nanocomposites.21
image file: c4ra07359b-f6.tif
Fig. 6 SEM microstructures of the fracture surface of (a and b) cured pure epoxy and its PNCs with (c and d) 5.0 wt% u-Fe3O4, (e and f) 5.0 wt% f-Fe3O4, and (g and h) 20.0 wt% f-Fe3O4, respectively.

3.6 Dielectric property

Fig. 7 shows the dielectric property of the cured pure epoxy and its PNCs filled with different loadings of f-Fe3O4 nanoparticles as a function of frequency (5 × 10⁴ to 2 × 10⁶ Hz) at room temperature. The dielectric property of the cured epoxy PNCs with u-Fe3O4 nanoparticles is shown in the ESI. In Fig. 7(a), the cured pure epoxy and its PNCs with f-Fe3O4 nanoparticles show positive permittivity and the ε′ of the cured epoxy PNCs increases with increasing the f-Fe3O4 nanoparticle loading. The cured epoxy PNCs with higher f-Fe3O4 loadings show a higher positive permittivity, which is due to the interfacial polarization between the epoxy and Fe3O4 nanoparticles in the PNCs.20 The protons provided by the doped acid (PTSA) can move along the PPy chains on the surface of the f-Fe3O4 nanoparticles. However, these charge carriers would be hindered by the Fe3O4 and epoxy matrix, which caused the space charge carriers accumulated at the interface of PPy and Fe3O4 (or epoxy matrix) and thus caused a higher permittivity.51 The ε′ value of the cured pure epoxy and its PNCs with 5.0 wt% f-Fe3O4 nanoparticles is almost constant within the measured frequency range, which can be used in the electronic industries.52 However, the ε′ of the cured epoxy PNCs with f-Fe3O4 nanoparticles of 10.0, 20.0 and 30.0 wt% decreases with increasing the frequency, which is due to the fact that the dipolar groups cannot orient themselves at the same rate as the alternating electric filed at higher frequencies.43 The ε′′ of the cured pure epoxy and its PNCs, Fig. 7(b), increase with increasing the f-Fe3O4 loading. The ε′′ of the cured pure epoxy and its PNCs with 5.0 wt% f-Fe3O4 nanoparticles increase with increasing the frequency. For the cured epoxy PNCs with 10.0 and 20.0 wt% f-Fe3O4 nanoparticles, the ε′′ decreases with increasing the frequency. The tan[thin space (1/6-em)]δ of the cured epoxy PNCs with f-Fe3O4 nanoparticles, Fig. 7(c), is higher than that of the cured pure epoxy, which is due to the free charge motion difference, indicating the interfacial polarization occurred in the cured epoxy PNCs.20 The tan[thin space (1/6-em)]δ of the cured epoxy with 20.0 wt% f-Fe3O4 nanoparticles increases with increasing the frequency and reaches a peak at a certain frequency, then decreases with further increasing the frequency, which is due to the resonance effect. In the resonance effect, the system tends to oscillate with greater amplitude than others at certain frequency.53
image file: c4ra07359b-f7.tif
Fig. 7 (a) Real permittivity (ε′), imaginary permittivity (ε′′), and dielectric loss tangent (tan[thin space (1/6-em)]δ) as a function of frequency for cured pure epoxy and its PNCs with different loadings of f-Fe3O4 nanoparticles.

3.7 Electrical conductivity

Fig. 8 depicts the volume resistivity of the cured pure epoxy and its PNCs as a function of the u-Fe3O4 and f-Fe3O4 nanoparticle loading. The volume resistivity of cured pure epoxy is about 1.6 × 10¹³ Ω cm. The volume resistivity of the cured epoxy PNCs with u-Fe3O4 nanoparticles of 5.0, 10.0, 20.0 and 30.0 wt% is 1.3489 × 10¹³, 1.0189 × 10¹³, 2.0577 × 10¹³ and 1.6296 × 10¹³ Ω cm, respectively. It is worth noting that the volume resistivity barely changes, which indicates the u-Fe3O4 nanoparticles do not construct a network in the epoxy matrix even when the loading of u-Fe3O4 nanoparticles is 30.0 wt%. However, for the cured epoxy PNCs with f-Fe3O4 nanoparticles, the volume resistivity decreases with increasing the f-Fe3O4 nanoparticle loading. When the loading of f-Fe3O4 nanoparticles is 5.0 wt% in the cured epoxy PNCs, the volume resistivity decreases to 1.2688 × 10¹² Ω cm. The volume resistivity of the cured epoxy PNCs with 10.0 and 20.0 wt% f-Fe3O4 nanoparticles is 1.7267 × 10¹¹ and 9.4211 × 10¹⁰ Ω cm, respectively. When the weight percentage of the f-Fe3O4 nanoparticles is 30.0 wt%, the volume resistivity decreases significantly, almost 7 orders of magnitude compared with that of the cured pure epoxy. The variation of volume resistivity of the cured epoxy PNCs with different loadings of f-Fe3O4 nanoparticles indicates the formation of percolation networks. Similar phenomenon was also observed in the epoxy nanocomposites with iron-core–carbon-shell nanoparticles.54 At lower loadings, the f-Fe3O4 nanoparticles are well dispersed and almost do not contact each other, which makes electron hopping very difficult due to the large spacing. And because of the PPy coated on the f-Fe3O4 nanoparticle, the volume of the f-Fe3O4 nanoparticle is larger than that of u-Fe3O4 nanoparticle. Then the spacing between the nanoparticles becomes smaller, which make the formation of percolation networks much easier. Therefore the volume resistivity decreases with increasing the f-Fe3O4 nanoparticle loadings. When the loading of f-Fe3O4 reaches the percolation threshold,54 there will be a conductive network formed in the epoxy matrix and thus a huge volume resistivity decrease is observed in the PNCs with a f-Fe3O4 loading of 30 wt%.
image file: c4ra07359b-f8.tif
Fig. 8 Volume resistivity of the cured pure epoxy and its PNCs filled with u-Fe3O4 and f-Fe3O4 nanoparticles.

3.8 Magnetic properties

Fig. 9 shows the magnetization curves of the cured epoxy PNCs with 20.0 wt% f-Fe3O4 nanoparticles, f-Fe3O4, and u-Fe3O4 nanoparticles at room temperature. Magnetization is a phenomenon that describes the response of the magnetic materials to an applied external magnetic field.55 For all the samples, there is no hysteresis loops observed, indicating a superparamagnetic behavior.56 The magnetization of all the samples did not reach saturation even at high magnetic field. The saturation magnetization (Ms) can be determined by the extrapolated saturation magnetization obtained from the intercept of MH−1 at high field.57 The calculated Ms of the u-Fe3O4 nanoparticles is 60.8 emu g−1, which is smaller than that of the bulk Fe3O4 (92.0 emu g−1).58 The Ms of the f-Fe3O4 nanoparticles is 50.6 emu g−1, the Fe3O4 nanoparticle loading in the f-Fe3O4 nanoparticles is calculated to be 83.2%, which is consistent with the initial 80 wt% Fe3O4 in the f-Fe3O4 nanoparticles. The Ms value of the cured epoxy PNCs with 20.0 wt% f-Fe3O4 nanoparticle loading is about 13.1 emu g−1. As the magnetization of the composites is related to the weight percentage of Fe3O4.21,59 The calculated weight percentage of Fe3O4 in the cured epoxy PNCs is about 17.1 wt%, which is consistent with the initial 20.0 wt% Fe3O4 in the epoxy nanocomposites.
image file: c4ra07359b-f9.tif
Fig. 9 Room temperature magnetization curves of the cured epoxy PNCs with 20.0 wt% f-Fe3O4 nanoparticles, f-Fe3O4 and u-Fe3O4 nanoparticles.

For the superparamagnetic system, the magnetic properties can be described on the basis of the Langevin eqn (1):7

 
image file: c4ra07359b-t1.tif(1)
where, M is the magnetization (emu g−1) in H (Oe), x = aH; the parameter a is related to the electron spin magnetic moment m of the individual molecule as described in eqn (2):
 
image file: c4ra07359b-t2.tif(2)
where, kB is the Boltzmann constant, T is the absolute temperature.

The best fit to eqn (1) is obtained by nonlinear fitting of M and H by using the polymath software. The a for the u-Fe3O4, f-Fe3O4, and cured epoxy PNCs with 20.0 wt% f-Fe3O4 nanoparticle loading is 2.98, 3.29 and 3.29 T−1, respectively. According to eqn (2), the magnetic moment “m” can be calculated from parameter “a”. The magnetic moment m for u-Fe3O4, f-Fe3O4, and the cured epoxy PNCs with 20.0 wt% f-Fe3O4 nanoparticles is 1.19, 1.32, and 1.32 μB, respectively. The m is almost the same, indicating that the PPy and epoxy matrix have little effect on the magnetic moment of the Fe3O4 nanoparticles.

3.9 PNCs formation mechanism exploration

PPy, one of the conjugated polymers, is formed from the polymerization of pyrrole. Theoretically, the secondary amines on the PPy can chemically react with the epoxide groups. To better understand the reaction between PPy on the surface of f-Fe3O4 nanoparticles and the epoxy resins, the f-Fe3O4 nanoparticles and PPy before and after being treated with epoxy resin monomers at 70 °C for 2 hours and washed with excessive acetone were tested with FT-IR and TGA. Fig. 10(A) shows the FT-IR spectra of f-Fe3O4 nanoparticles without treatment with epoxy and acetone, f-Fe3O4 nanoparticles after being treated with epoxy and acetone, and epoxy monomers, respectively. After treated by epoxy and acetone, the excessive epoxy monomers should be removed from the surface of f-Fe3O4 nanoparticles if there is no reaction between PPy and epoxy resin. However, major difference is observed between the spectrum of f-Fe3O4 nanoparticles without being treated by epoxy and acetone and that of f-Fe3O4 nanoparticles being treated by epoxy and acetone in the 1600 to 1400 cm−1 region, Fig. 10(A)(a) and (b). The peak at 1505 cm−1 that reflects the strong absorption of aromatic ring stretch vibration of epoxy monomers is also observed in the spectrum of f-Fe3O4 nanoparticles after 2 hour treatment with epoxy at 70 °C and washed with acetone.60 There is no aromatic ring in the chemical structure of PPy, only the epoxy monomers have the aromatic ring. These results indicate the reaction between epoxy monomers and the PPy on the f-Fe3O4 nanoparticles. For the f-Fe3O4 nanoparticles, the APS and PTSA on the surface of the Fe3O4 nanoparticles initiate the polymerization of pyrrole on the surface of Fe3O4 nanoparticles, which has also been observed in the polyaniline coated alumina nanoparticles.61
image file: c4ra07359b-f10.tif
Fig. 10 (A) FT-IR spectra of the (a) f-Fe3O4 nanoparticles without being treated with epoxy and acetone, (b) f-Fe3O4 nanoparticles after being treated with epoxy and acetone, and (c) epoxy monomers; (B) the TGA curves of (a) epoxy monomers, (b) epoxy monomer mixture with pure PPy, (c) epoxy monomer mixture with f-Fe3O4 nanoparticle; (C) TGA curves of (a) pure PPy after being treated with epoxy and acetone, (b) pure PPy nanoparticles without being treated with epoxy and acetone, (c) f-Fe3O4 nanoparticles after being treated with epoxy and acetone, (d) f-Fe3O4 nanoparticles without being treated with epoxy and acetone.

Fig. 10(B) shows the TGA curves of epoxy monomer, epoxy monomers mixed with 5 wt% pure PPy, and epoxy monomers mixed 5 wt% with f-Fe3O4 nanoparticles. For the epoxy monomers, Fig. 10(B)(a), two major weight losses are observed within the measured temperature range. The first weight loss from 250 to 350 °C is due to the degradation of the C–O–C group in the epoxy monomers and the second weight loss is due to the degradation of the benzene ring.23 Compared with the epoxy monomers, the epoxy monomers mixed with pure PPy (or f-Fe3O4 nanoparticles) have three weight losses in Fig. 10(B)(b) and (c). The extra weight loss from 400 to 450 °C is due to the degradation of PPy. Fig. 10(C) shows the TGA curves of pure PPy after being treated by epoxy and acetone, pure PPy without being treated by epoxy and acetone, f-Fe3O4 nanoparticles after treated by epoxy and acetone, and f-Fe3O4 nanoparticles without being treated by epoxy and acetone. In Fig. 10(C)(a) and (b), when the temperature is above 550 °C, the weight residue of the pure PPy with treatment by epoxy and acetone is relatively lower than that of pure PPy without treatment by epoxy and acetone, which is due to the decomposition of the benzene ring (from the TGA curve of epoxy monomer, Fig. 10(B)(a)) on the PPy. The weight residue of f-Fe3O4 nanoparticles with treatment by epoxy and acetone, Fig. 10(C)(c), is 60.3%, which is lower than that of f-Fe3O4 nanoparticles (about 79.8%), Fig. 10(C)(d). These results indicate that there are Epon molecules attached on the PPy after the curing and washed with acetone, indicating that there is a chemical bonding formed between the secondary amines and the epoxide groups. Then the f-Fe3O4 nanoparticles after washed with acetone consist of Fe3O4, PPy, and Epon molecules, so the weight percentage of Fe3O4 in the f-Fe3O4 nanoparticles treated with acetone is decreased. In summary, the proposed PNCs formation mechanism is presented in Scheme 2. The first step is that the secondary amines in the PPy on the f-Fe3O4 nanoparticle surface react with the epoxide groups, Scheme 2(a), to form epoxide–PPy-f-Fe3O4 complex (b); the second step is that the epoxy resins and the linked epoxy on the nanoparticle surface react further with the curing agent to form the crossing link structure, Scheme 2(b) and (c).


image file: c4ra07359b-s2.tif
Scheme 2 PNCs formation mechanism (a) the f-Fe3O4 nanoparticles, (b) epoxy resin linked on the f-Fe3O4 nanoparticles after reacting with the epoxy resin, and (c) the crossing link structure formed by the epoxy resin and curing agent.

4. Conclusions

High performance magnetic epoxy PNCs reinforced with different loadings of u-Fe3O4 and f-Fe3O4 nanoparticles have been successfully synthesized. The viscosity increases with increasing the nanoparticle loading and decreases with increasing the shear rates. The DMA results indicate that the adding of f-Fe3O4 nanoparticles into the epoxy matrix improves the Tg to a higher temperature, compared with cured pure epoxy. The enhanced mechanical property for the cured epoxy PNCs with 5.0 wt% f-Fe3O4 is due to the interaction between the f-Fe3O4 nanoparticles and the epoxy matrix. The rough fracture surface of the cured epoxy nanocomposites filled with f-Fe3O4 nanoparticles indicates the effective load transfer from the weaker epoxy matrix to the stronger f-Fe3O4 nanoparticles and good interfacial interaction between f-Fe3O4 nanoparticles and epoxy matrix. The TGA results indicate that the cured epoxy PNCs exhibit a good thermal stability. These cured epoxy PNCs show a good magnetic properties as well. The conductivity of the cured epoxy PNCs with 30.0 wt% f-Fe3O4 nanoparticles is decreased significantly, compared with that of the cured pure epoxy. The cured epoxy PNCs with f-Fe3O4 nanoparticles show positive permittivity, and the permittivity increases with increasing the particle loading. The PNCs formation mechanism is proposed based on the f-Fe3O4 nanoparticles and pure PPy before and after being treatment with epoxy resin monomers at 70 °C for 2 hours and washed with excessive acetone as analysed by FT-IR and TGA, which explains the improved mechanical properties of the cured epoxy PNCs with f-Fe3O4 nanoparticles.

Acknowledgements

This project is financially supported by the National Science Foundation (NSF) USA (CMMI 10-30755 and CMMI 13-14486). D. P. Young acknowledges the support from the NSF USA under Grant no. DMR 13-06392.

References

  1. V. L. Pushparaj, M. M. Shaijumon, A. Kumar, S. Murugesan, L. Ci, R. Vajtai, R. J. Linhardt, O. Nalamasu and P. M. Ajayan, Proc. Natl. Acad. Sci. U. S. A., 2007, 104, 13574–13577 CrossRef CAS PubMed.
  2. J. Zhu, M. Chen, Q. He, L. Shao, S. Wei and Z. Guo, RSC Adv., 2013, 3, 22790–22824 RSC.
  3. H. Qu, S. Wei and Z. Guo, J. Mater. Chem. A, 2013, 1, 11513–11528 CAS.
  4. T. Shimada, K. Ookubo, N. Komuro, T. Shimizu and N. Uehara, Langmuir, 2007, 23, 11225–11232 CrossRef CAS PubMed.
  5. H. Gu, X. Zhang, H. Wei, Y. Huang, S. Wei and Z. Guo, Chem. Soc. Rev., 2013, 42, 5907–5943 RSC.
  6. J. Zhu, H. Gu, Z. Luo, N. Haldolaarachige, D. P. Young, S. Wei and Z. Guo, Langmuir, 2012, 28, 10246–10255 CrossRef CAS PubMed.
  7. H. Gu, Y. Huang, X. Zhang, Q. Wang, J. Zhu, L. Shao, N. Haldolaarachchige, D. P. Young, S. Wei and Z. Guo, Polymer, 2012, 53, 801–809 CrossRef CAS.
  8. H. Wei, J. Zhu, S. Wu, S. Wei and Z. Guo, Polymer, 2013, 54, 1820–1831 CrossRef CAS.
  9. H. Wei, X. Yan, S. Wu, Z. Luo, S. Wei and Z. Guo, J. Phys. Chem. C, 2012, 116, 25052–25064 CAS.
  10. H. Wei, X. Yan, Y. Li, H. Gu, S. Wu, K. Ding, S. Wei and Z. Guo, J. Phys. Chem. C, 2012, 116, 16286–16293 CAS.
  11. H. Wei, X. Yan, Y. Li, S. Wu, A. Wang, S. Wei and Z. Guo, J. Phys. Chem. C, 2012, 116, 4500–4510 CAS.
  12. J. Zhu, S. Wei, M. J. Alexander, T. D. Dang, T. C. Ho and Z. Guo, Adv. Funct. Mater., 2010, 20, 3076–3084 CrossRef CAS.
  13. S.-W. Chuang, S. L.-C. Hsu and Y.-H. Liu, J. Membr. Sci., 2007, 305, 353–363 CrossRef CAS.
  14. Z. Guo, T. Y. Kim, K. Lei, T. Pereira, J. G. Sugar and H. T. Hahn, Compos. Sci. Technol., 2008, 68, 164–170 CrossRef CAS.
  15. J. Zhu, M. Chen, H. Qu, X. Zhang, H. Wei, Z. Luo, H. A. Colorado, S. Wei and Z. Guo, Polymer, 2012, 53, 5953–5964 CrossRef CAS.
  16. H. Wei, H. Gu, J. Guo, S. Wei and Z. Guo, J. Electrochem. Soc., 2013, 160, G3038–G3045 CrossRef CAS.
  17. H. Wei, D. Ding, S. Wei and Z. Guo, J. Mater. Chem. A, 2013, 1, 10805–10813 CAS.
  18. H. Gu, J. Guo, Q. He, S. Tadakamalla, X. Zhang, X. Yan, Y. Huang, H. A. Colorado, S. Wei and Z. Guo, Ind. Eng. Chem. Res., 2013, 52, 7718–7728 CrossRef CAS.
  19. Z. Guo, Q. He, T.-T. Yuan and S. Wei, J. Mater. Chem. A, 2013, 1, 13064–13075 Search PubMed.
  20. X. Zhang, Q. He, H. Gu, S. Wei and Z. Guo, J. Mater. Chem. C, 2013, 1, 2886–2899 RSC.
  21. (a) H. Gu, S. Tadakamalla, Y. Huang, H. A. Colorado, Z. Luo, N. Haldolaarachchige, D. P. Young, S. Wei and Z. Guo, ACS Appl. Mater. Interfaces, 2012, 4, 5613–5624 CrossRef CAS PubMed; (b) B. Qiu, C. Xu, D. Sun, Q. Wang, H. Gu, X. Zhang, B. Weeks, J. Hopper, T. C. Ho, Z. Guo and S. Wei, Appl. Surf. Sci., 2014 DOI:10.1016/j.apsusc.2014.07.039 , in press.
  22. J. Zhu, S. Wei, J. Ryu, M. Budhathoki, G. Liang and Z. Guo, J. Mater. Chem., 2010, 20, 4937–4948 RSC.
  23. H. Gu, S. Tadakamalla, X. Zhang, Y. Huang, Y. Jiang, H. A. Colorado, Z. Luo, S. Wei and Z. Guo, J. Mater. Chem. C, 2013, 1, 729–743 RSC.
  24. J. Zhu, S. Wei, J. Ryu, L. Sun, Z. Luo and Z. Guo, ACS Appl. Mater. Interfaces, 2010, 2, 2100–2107 CAS.
  25. M. K. Niranjan, J. P. Velev, C.-G. Duan, S. S. Jaswal and E. Y. Tsymbal, Phys. Rev. B: Condens. Matter Mater. Phys., 2008, 78, 104405 CrossRef.
  26. J. Guo, H. Gu, H. Wei, Q. Zhang, N. Haldolaarachchige, Y. Li, D. P. Young, S. Wei and Z. Guo, J. Phys. Chem. C, 2013, 117, 10191–10202 CAS.
  27. W. Li, C. Gao, H. Qian, J. Ren and D. Yan, J. Mater. Chem., 2006, 16, 1852–1859 RSC.
  28. C. A. Dyke and J. M. Tour, Nano Lett., 2003, 3, 1215–1218 CrossRef CAS.
  29. Z. Guo, S. Wei, B. Shedd, R. Scaffaro, T. Pereira and H. T. Hahn, J. Mater. Chem., 2007, 17, 806–813 RSC.
  30. A. R. Harutyunyan, B. K. Pradhan, J. Chang, G. Chen and P. C. Eklund, J. Phys. Chem. B, 2002, 106, 8671–8675 CrossRef CAS.
  31. P. Mavinakuli, S. Wei, Q. Wang, A. B. Karki, S. Dhage, Z. Wang, D. P. Young and Z. Guo, J. Phys. Chem. C, 2010, 114, 3874–3882 CAS.
  32. D. Kumar and R. C. Sharma, Eur. Polym. J., 1998, 34, 1053–1060 CrossRef CAS.
  33. J. Zhu, S. Wei, N. Haldolaarachchige, D. P. Young and Z. Guo, J. Phys. Chem. C, 2011, 115, 15304–15310 CAS.
  34. X. Zhang, O. Alloul, Q. He, J. Zhu, M. J. Verde, Y. Li, S. Wei and Z. Guo, Polymer, 2013, 54, 3594–3604 CrossRef CAS.
  35. A. Tuteja, P. M. Duxbury and M. E. Mackay, Macromolecules, 2007, 40, 9427–9434 CrossRef CAS.
  36. D. Zhang, A. B. Karki, D. Rutman, D. P. Young, A. Wang, D. Cocke, T. H. Ho and Z. Guo, Polymer, 2009, 50, 4189–4198 CrossRef CAS.
  37. L. Sun, W.-J. Boo, J. Liu, A. Clearfield, H.-J. Sue, N. E. Verghese, H. Q. Pham and J. Bicerano, Macromol. Mater. Eng., 2009, 294, 103–113 CrossRef CAS.
  38. T. G. Fox and P. J. Flory, J. Am. Chem. Soc., 1948, 70, 2384–2395 CrossRef CAS.
  39. N. Grassie, M. I. Guy and N. H. Tennent, Polym. Degrad. Stab., 1986, 14, 125–137 CrossRef CAS.
  40. R. Heyrovska, 2008, arXiv preprint arXiv:0807.4140.
  41. Y. Pan, Y. Xu, L. An, H. Lu, Y. Yang, W. Chen and S. Nutt, Macromolecules, 2008, 41, 9245–9258 CrossRef CAS.
  42. Y. Shi, S. Peterson and D. Y. Sogah, Chem. Mater., 2007, 19, 1552–1564 CrossRef CAS.
  43. X. Zhang, Q. He, H. Gu, H. A. Colorado, S. Wei and Z. Guo, ACS Appl. Mater. Interfaces, 2013, 5, 898–910 CAS.
  44. B. Fabry, G. N. Maksym, J. P. Butler, M. Glogauer, D. Navajas and J. J. Fredberg, Phys. Rev. Lett., 2001, 87, 148102 CrossRef CAS PubMed.
  45. A. Quach and R. Simha, J. Phys. Chem., 1972, 76, 416–421 CrossRef CAS.
  46. A. Makke, M. Perez, O. Lame and J.-L. Barrat, J. Chem. Phys., 2009, 131, 014904 CrossRef PubMed.
  47. W. Brostow, R. Chiu, I. M. Kalogeras and A. Vassilikou-Dova, Mater. Lett., 2008, 62, 3152–3155 CrossRef CAS.
  48. Z. Guo, K. Lei, Y. Li, H. W. Ng, S. Prikhodko and H. T. Hahn, Compos. Sci. Technol., 2008, 68, 1513–1520 CrossRef CAS.
  49. S. Wang, Z. Liang, P. Gonnet, Y. H. Liao, B. Wang and C. Zhang, Adv. Funct. Mater., 2007, 17, 87–92 CrossRef CAS.
  50. Z. Guo, T. Pereira, O. Choi, Y. Wang and H. T. Hahn, J. Mater. Chem., 2006, 16, 2800–2808 RSC.
  51. J. Lu, K.-S. Moon, B.-K. Kim and C. P. Wong, Polymer, 2007, 48, 1510–1516 CrossRef CAS.
  52. L. H. Sinh, B. T. Son, N. N. Trung, D.-G. Lim, S. Shin and J.-Y. Bae, React. Funct. Polym., 2012, 72, 542–548 CrossRef CAS.
  53. H. Gu, H. Wei, J. Guo, N. Haldolaarachige, D. P. Young, S. Wei and Z. Guo, Polymer, 2013, 54, 5974–5985 CrossRef CAS.
  54. X. Zhang, O. Alloul, J. Zhu, Q. He, Z. Luo, H. A. Colorado, N. Haldolaarachchige, D. P. Young, T. Shen and S. Wei, RSC Adv., 2013, 3, 9453–9464 RSC.
  55. Z. Guo, H. T. Hahn, H. Lin, A. B. Karki and D. P. Young, J. Appl. Phys., 2008, 104, 014314–014315 CrossRef.
  56. S. Xuan, L. Hao, W. Jiang, X. Gong, Y. Hu and Z. Chen, J. Magn. Magn. Mater., 2007, 308, 210–213 CrossRef CAS.
  57. (a) D. Zhang, A. B. Karki, D. Rutman, D. P. Young, A. Wang, D. Cocke, T. H. Ho and Z. Guo, Polymer, 2009, 50, 4189–4198 CrossRef CAS; (b) Z. Guo, L. L. Henry, V. Palshin and E. J. Podlaha, J. Mater. Chem., 2006, 16, 1772–1777 RSC.
  58. P. Hu, S. Zhang, H. Wang, D. a. Pan, J. Tian, Z. Tang and A. A. Volinsky, J. Alloys Compd., 2011, 509, 2316–2319 CrossRef CAS.
  59. Z. Guo, S.-E. Lee, H. Kim, S. Park, H. Hahn, A. Karki and D. Young, Acta Mater., 2009, 57, 267–277 CrossRef CAS.
  60. K.-t. Lau, M. Lu, L. Chun-ki, H.-y. Cheung, F.-L. Sheng and H.-L. Li, Compos. Sci. Technol., 2005, 65, 719–725 CrossRef CAS.
  61. J. Zhu, S. Wei, L. Zhang, Y. Mao, J. Ryu, N. Haldolaarachchige, D. P. Young and Z. Guo, J. Mater. Chem., 2011, 21, 3952–3959 RSC.

Footnote

Electronic supplementary information (ESI) available. See DOI: 10.1039/c4ra07359b

This journal is © The Royal Society of Chemistry 2014
Click here to see how this site uses Cookies. View our privacy policy here.