Crystallization behaviour of a polymeric membrane based on the polymer PVdF–HFP and the ionic liquid BMIMBF4

Shalu, S. K. Chaurasia and R. K. Singh*
Ionic Liquid & Solid State Ionics Laboratory, Department of Physics, Banaras Hindu University, Varanasi-221005, India. E-mail: rksingh_17@rediffmail.com; rajendrasingh.bhu@gmail.com; Fax: +91 542 2368390; Tel: +91 542 6701541

Received 14th July 2014 , Accepted 15th September 2014

First published on 16th September 2014


Abstract

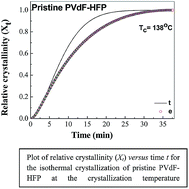
The crystallization behaviour of the polymer poly(vinylidenefluoride)–hexafluoropropylene (PVdF–HFP) in the presence and absence of the ionic liquid (IL) (1-butyl-3-methylimidazolium tetrafluoroborate; [BMIMBF4]) were studied by isothermal and non-isothermal crystallization processes using differential scanning calorimetry. The well-known Avrami equation is used to describe the isothermal crystallization process of pristine PVdF–HFP or PVdF–HFP + x wt% of IL BMIMBF4, where x = 10 and 30, respectively. It was found that the presence of the IL BMIMBF4 in the PVdF–HFP matrix suppresses the crystallization of the polymer PVdF–HFP, resulting in low crystal growth rates. Three kinetic methods (i.e., those of Jeziorny, Ozawa and Mo) were used to analyze the non-isothermal crystallization process. The Avrami equation modified by Jeziorny could only describe the initial stage of crystallization and the Ozawa method failed to describe the non-isothermal crystallization behavior, but Mo's method explains the results better.


Introduction

The study of the crystallization kinetics of polymers and polymer electrolytes is an attractive area for researchers because it has a direct relationship to the structures and properties of the polymeric materials.1,2 Polymer electrolytes are very important for the development of solid-state electrochemical devices with electro-active properties. Generally, these polymer electrolytes are formed by using ionic salts (e.g., LiClO4, LiBF4, NaClO4, NH4ClO4, Mg(ClO4)2, and so on) with polymer matrices such as polyethylene oxide (PEO), polypropylene oxide (PPO), polyvinyl acetate (PVA), and polyvinylidenefluoride (PVdF), but these polymer electrolytes are relatively poorly conducting at room temperature and are not thermally very stable.3–6 To obtain higher conductivity, many approaches7–11 such as addition of ceramic fillers, plasticizers, copolymerization and blending have been adopted but the solvents used for the preparation of these polymer electrolytes are volatile in nature. Therefore, these polymer electrolytes are not electrochemically and thermally stable, which limits their application in some devices. The previously mentioned problem can be addressed by incorporating ionic liquids (ILs) into the polymer matrix. Recently, the incorporation of room temperature ionic liquids (RTILs) into polymers, and polymer electrolytes have been found to be a very promising approach for enhancing the ionic conductivity as well as for maintaining mechanical and thermal stability of polymer electrolyte membranes.12–14 Ionic liquids are generally considered to be salts that have melting temperatures below 100 °C, and are mainly composed of dissociated cations and anions, and RTILs are those ionic liquids that are in the liquid state at room temperature. However, it has been recently found that IL ions exist in layers.15 ILs play important roles in electrochemical devices, especially in rechargeable batteries, because of some exotic properties such as non-volatility, non-flammability, high thermal stability, wide electrochemical window and excellent ionic conductivity up to their decomposition temperatures.16–18 Ionic liquids act as suppliers of large numbers of free charge carriers and also as plasticizers.19 Polymeric membranes based on poly(vinylidenefluoride-co-hexafluoropropylene) (PVdF–HFP) (which consist of both crystalline and amorphous phases) have drawn much research attention because of their high dielectric constant (ε = 8.4) which facilitates high charge dissociation. The crystalline phase of the polymer acts as a mechanical support for the polymer electrolyte, whereas the amorphous phase of the polymer helps in ion conduction.20,21 Generally, in polymer electrolytes, the amorphous phase is found to be highly conducting when compared to the crystalline phase.22 Therefore, it is very important to study the crystallization kinetics of the polymer. Several studies have reported changes that occur to the crystallization behavior of various polymers such as PEO, PMMA, PVdF, PVA, and PAN upon changing the polymer's molecular weight, adding complexing salts, using inorganic fillers such as SiO2 and TiO2, adding ferrite nanoparticles such as CoFe2O4 and NiFe2O4, using carbon nanotubes and also when the polymer is confined.23–28 However, very few studies are available that have shown the effect of an IL on the crystallization behavior of the polymers and polymer electrolytes.29 To the best of our knowledge, results are not available for the crystallization kinetics of PVdF–HFP and for the role of the IL in modifying its crystallization behavior. The present study reports on the crystallization kinetic behavior of PVdF–HFP, and of PVdF–HFP combined with different percentage weights of the ionic liquid: 1-butyl-3-methylimidazolium tetrafluoroborate (BMIMBF4). This behavior was investigated by using isothermal and non-isothermal crystallization methods and differential scanning calorimetry (DSC).

Experimental details

Materials

Starting materials PVdF–HFP, molecular weight = 400[thin space (1/6-em)]000 g mol−1 and the ionic liquid BMIMBF4 (purity >99.99%) were purchased from Sigma-Aldrich. The IL was dried under a vacuum of ∼10−6 torr for two days before use. The PVdF–HFP plus ionic liquid gel membranes were prepared using a conventional solution cast method. In order to synthesize polymeric gel membranes, the desired amount of host polymer (PVdF–HFP) was dissolved in acetone by stirring at 50 °C for 2 hours until a clear homogeneous solution was obtained. Different amounts of ionic liquid BMIMBF4 were added to the resulting solution under continuous stirring for about ∼5–6 hours at 50 °C until a clear, viscous, homogeneous mixture was obtained. The resulting viscous solution was cast over polypropylene petri dishes and, after complete evaporation of the solvent, freestanding rubbery films of polymeric gel membranes containing different amounts of the IL were obtained.

Isothermal and non-isothermal crystallization kinetic measurements were carried out using DSC with a Mettler Toledo DSC 1 system that was calibrated with indium and zinc metals. All the DSC measurements were performed in a nitrogen atmosphere (at a flow rate of 25 ml min−1) and the weight of the samples was kept constant (at ∼10 mg) to here.

Results and discussion

Isothermal crystallization kinetics

DSC analysis is one of the most suitable methods for studying the crystallization and phase transition occurring in semi-crystalline polymers. The original plug-in software developed by Lorenzo et al. was used to perform the isothermal crystallization kinetics calculations and for the comparison of the experimental and theoretical results.30 DSC curves for pristine PVdF–HFP and PVdF–HFP + x wt% of IL BMIMBF4 (where x = 10 and 30, respectively) are shown in Fig. 1. For isothermal crystallization, the samples were heated to 165 °C (which is above the ∼147 °C melting temperature of pure PVdF–HFP), held there for 10 min to remove any thermal history, and then quickly cooled (at a rate −50 °C min−1) to various crystallization temperatures (Tc). In the present case, Tc was kept different for different concentrations of IL because incorporation of IL into the polymer matrix reduces the melting temperature due to the decrease in crystallite size and increase in its interfacial area.31 Fig. 1 shows the exothermic curves of the prepared samples during isothermal crystallization. It can be seen from Fig. 1 that, at higher Tc, the exothermic peak becomes flatter and the polymeric membranes are taking more time to crystallize. Fig. 1(a) shows the exothermic curves for pristine PVdF–HFP at Tc = 138 and 136 °C while Fig. 1(b) and (c) show the exothermic curves for PVdF–HFP + x wt% of IL BMIMBF4 for x = 10%, Tc = 116 and 114 °C, and for x = 30%, Tc = 108 and 106 °C, respectively. From Fig. 1a–c it is found that (i) IL BMIMBF4 reduces the crystallization temperature (Tc) and (ii) IL-containing samples take a much longer time to crystallize as compared to pristine PVdF–HFP due to the plasticization effect of the IL. The relative degree of crystallinity (Xt) (expressed as relative ΔH values, i.e., total heat evolved) with time t can be calculated using DSC exothermic curves (Fig. 2). The relative crystallinity (Xt) is defined as the ratio of crystallinity at any time t, to the crystallinity as time approaches infinity, and can be calculated by the equation32
 
image file: c4ra07085b-t1.tif(1)
where dH/dt is the rate of heat evolution, ΔHt is the total heat evolved at any time t, and ΔH is the heat evolved when time approaches infinity (∞).

image file: c4ra07085b-f1.tif
Fig. 1 DSC exothermic curves for the isothermal crystallization (a) pristine PVdF–HFP, PVdF–HFP + x wt% of IL BMIMBF4 where (b) x = 10 and (c) 30 at different crystallization temperatures (Tc).

image file: c4ra07085b-f2.tif
Fig. 2 Plots of relative crystallinity (Xt) (expressed as relative ΔH values) vs. time t for the isothermal crystallization of (a) pristine PVdF–HFP, PVdF–HFP + x wt% of IL BMIMBF4 where (b) x = 10 and (c) 30 at different crystallization temperature (Tc).

The plots of relative crystallinity (Xt) (expressed as relative ΔH values) vs. time (t) for the isothermal crystallization of pristine PVdF–HFP and PVdF–HFP + x wt% of IL BMIMBF4 (for x = 10 and 30) at different crystallization temperatures are shown in Fig. 2. For pristine PVdF–HFP, the time required for complete crystallization is around 14 min at a crystallization temperature of ∼136 °C, and this crystallization time increases with increasing crystallization temperature. It can be seen from Fig. 2 that as the crystallization temperature increases, a typical sigmoidal-shaped curve is obtained for all the samples, and these curves shift towards higher time scales (i.e., take longer time to crystallize). In the present work, the Avrami equation33,34

 
Xt = 1 − exp(−ktn) (2a)
is used to study the isothermal crystallization kinetics, where Xt is the relative crystallinity at any time t (and is plotted in Fig. 2 for different Tc values), n is the Avrami exponent and k is the crystallization rate constant, which depends on the nature of nucleation and growth geometry parameters. The above equation can be converted to the following linear equation:
 
log[−ln(1 − Xt)] = log[thin space (1/6-em)]k + n[thin space (1/6-em)]log[thin space (1/6-em)]t (2b)

Fig. 3 shows a graphic representation of log[−ln[thin space (1/6-em)](1−Xt)] versus log[thin space (1/6-em)]t for the pristine PVdF–HFP and PVdF–HFP + x wt% of IL BMIMBF4 (where x = 10 and 30 respectively). The value of the Avrami exponent n (slope of the straight line in Fig. 3) and crystallization rate constant k (intersection with the ordinate axis in Fig. 3) are determined by fitting the data to a double logarithm plot using Avrami fit software. The Avrami equation rarely explains the complete crystallization conversion process which is a measure of the extent or degree of crystallisation and is usually applicable only for primary crystallization.35 Therefore, in order to determine the value of the conversion degree of crystallinity that yields the best fit, we have used the aforementioned software.30 For a good fit, the value of the correlation coefficient should be very high (i.e. in our case r2 ≥ 0.999 in all cases). The fitted line (shown by an arrow in each plot of Fig. 3) is plotted separately in Fig. 4. Fig. 4 shows the fitting with a relative conversion of 5–30%. In the present study, the Avrami plots for PVdF–HFP and PVdF–HFP + x wt% of IL BMIMBF4 membranes give rise to a series of straight lines, as shown in Fig. 4. By knowing the slope and intercept of these straight lines, the values of the Avrami exponent (n) and the crystallization rate constant (k) can be obtained, and corresponding values of n and k at different crystallization temperatures are listed in Table 1. It can be seen from Table 1 that the value of the Avrami exponent n for all the membranes is between 1 and 2 at various crystallization temperatures (Tc), indicating a 2-dimensional crystal growth.36 The crystallization half-life (t1/2, which is defined as the time required to achieve 50% crystallization) (listed in Table 1) is also an important parameter for the discussion of crystallization kinetics. The values of t1/2 (theoretical as well as experimental values) for the prepared membranes at different crystallization temperatures are given in Table 1. By determining the value of t1/2, the crystallization rate (which is the inverse of t1/2) can be estimated. It can be seen from Table 1 that the crystallization half-life (t1/2) increases (or 1/t1/2 decreases) when increasing the crystallization temperature (Tc) as well as IL content in the membranes, indicating that the overall crystallization rate decreases.37,38


image file: c4ra07085b-f3.tif
Fig. 3 Plots of log[−ln(1 − Xt)] versus log[thin space (1/6-em)]t of (a) pristine PVdF–HFP, PVdF–HFP + x wt% of IL BMIMBF4 where (b) x = 10 and (c) 30 at different crystallization temperatures (Tc).

image file: c4ra07085b-f4.tif
Fig. 4 Linear fitting plots of log[−ln(1 − Xt)] vs. log[thin space (1/6-em)]t with the relative conversion of 5–30% (i.e., at the initial stage of nucleation growth) of (a) pristine PVdF–HFP, PVdF–HFP + x wt% of IL BMIMBF4 where (b) x = 10 and (c) 30 at different crystallization temperatures (Tc).
Table 1 Different crystallization parameters of (a) pristine PVdF–HFP, PVdF–HFP + x wt% of IL BMIMBF4 where (b) x = 10 and (c) 30 obtained by Avrami plots using an isothermal crystallization method
Sample Tc (°C) n K minn t1/2/mine t1/2/mint t0 (min) ΔH (J g−1) R2
Pure PVdF–HFP 136 1.63 0.035 7.016 6.18 0.63 12.58 0.999
138 1.64 0.023 9.33 7.89 1.15 11.75 0.999
PVdF–HFP + 10% BMIMBF4 114 2.01 0.062 3.61 3.33 0.55 15.09 0.999
116 1.95 0.036 4.92 4.564 1.08 14.96 0.999
PVdF–HFP + 30% BMIMBF4 106 2.03 0.033 5.46 4.46 0.16 6.94 0.998
108 1.72 0.034 6.63 5.72 0.91 7.00 0.999
PVdF–HFP + 10% BMIMBF4+5% SiO2 114 2.32 0.11 2.32 2.18 0.33 8.24 0.999
116 2.61 0.035 3.4 3.10 0.016 9.31 0.999


A small change of the Avrami exponent with crystallization temperature and IL content indicates that the crystallization mechanism does not change within the investigated crystallization temperature range despite the variation of IL content. Incorporation of ionic liquid in the semi-crystalline/semi-amorphous polymer PVdF–HFP matrix leads to the disruption of the crystalline phase of PVdF–HFP by reducing the interactions between the polymer chain segments, which results in increased polymer chain flexibility. Therefore, the incorporation of IL into the polymeric matrices can subsequently influence the crystallization kinetics of the crystalline segment of the polymer.

Non-isothermal crystallization kinetics

The non-isothermal crystallization kinetics of pristine PVdF–HFP and PVdF–HFP + x wt% of IL BMIMBF4 (where x = 10 and 30) were also studied, and the corresponding exothermic curves at different cooling rates (i.e., 5, 10, 15 and 20 °C min−1) are shown in Fig. 5. It can be seen from Fig. 5 that, as we increase the cooling rate, the exothermic crystallization peaks of pristine PVdF–HFP and PVdF–HFP + x wt% of IL BMIMBF4 membranes (where x = 10 and 30) shift to lower temperatures and become broader. On the basis of the crystallization exotherms of the prepared membranes, the relative crystallinities (Xt) at different cooling rates (ϕ) were calculated (using eqn (1)). The procedure employed to calculate the relative crystallinity (Xt) here is similar to that used in the isothermal crystallization study. Fig. 6 shows the relative crystallinity (Xt) with respect to temperature for the non-isothermal crystallization kinetics process. In this process, crystallization temperature (T) could be transformed into the time scale to correlate the relative crystallinity (Xt) and crystallization time (t) using the following equation (eqn (3)).
 
T = (TT0)/ϕ (3)
where T0 is the initial temperature when crystallization starts (i.e., at t = 0)

image file: c4ra07085b-f5.tif
Fig. 5 Exothermic curves for the non-isothermal crystallization kinetics of (a) pristine PVdF–HFP, PVdF–HFP + x wt% of IL BMIMBF4 where (b) x = 10 and (c) 30 at different cooling rates (ϕ).

image file: c4ra07085b-f6.tif
Fig. 6 Relative crystallinity (Xt) with respect to temperature for the non-isothermal crystallization kinetics process of (a) pristine PVdF–HFP, PVdF–HFP + x wt% of IL BMIMBF4 where (b) x = 10 and (c) 30 at different cooling rates (ϕ).

Using eqn (3), curves for Xt versus t can be obtained, as shown in Fig. 7. The exothermic curves of the prepared membranes broadened, the crystallization peak temperature (Tp) shifted to a lower temperature, and the amount of heat released upon crystallization decreased as cooling rates increased. Because the mobility and flexibility of the polymer chain decreased at high cooling rates, the segments of the polymer took a longer time to crystallize, which further lowered Tp (crystallization peak temperature, see Fig. 5). Hence, the exothermic trace of the two samples became wider and shifted to lower temperatures when increasing the cooling rate.


image file: c4ra07085b-f7.tif
Fig. 7 Relative crystallinity (Xt) with respect to time for the non-isothermal crystallization kinetics process of (a) pristine PVdF–HFP, PVdF–HFP + x wt% of IL BMIMBF4 where (b) x = 10 and (c) 30 at different cooling rates (ϕ).

For the present study, various approaches were employed to analyze the non-isothermal crystallization kinetics of pristine PVdF–HFP and PVdF–HFP + x wt% of IL BMIMBF4.

The Avrami equation was used to analyze the non-isothermal crystallization process at the initial crystallization state and is given as

 
1 − Xt = exp(−Zttn) (4)
where Xt is the relative degree of crystallinity, which is a function of crystallization temperature T; the exponent n′ is a mechanism constant depending on the types of nucleation parameters and growth process parameters, and Zt is a crystallization rate constant involving both nucleation and growth rate parameters. Fig. 8 shows plot of log[−ln(1 − Xt)] versus log[thin space (1/6-em)]t. It can be seen from these curves that the non-isothermal crystallization kinetics can be fitted by the Avrami equation only at the initial stage of crystallization. Plotting log[−ln(1 − Xt)] against log[thin space (1/6-em)]t for the initial stage of crystallization gives a straight line for each cooling rate (see Fig. 9, see also below). Thus two parameters, n′ and Zt, are obtained from the slope and intercept respectively of the straight-line portion of the plot. It should be noted here that the values of n′ and Zt for the non-isothermal crystallization rate do not have the same physical significance as for isothermal crystallization, because in non-isothermal crystallization, the temperature changes at a constant rate.29 The values of these parameters affect the rates of both nuclei formation and spherulite growth, which depend on temperature.


image file: c4ra07085b-f8.tif
Fig. 8 Plot of log[−ln(1 − Xt)] versus log[thin space (1/6-em)]t for the non-isothermal crystallization kinetics process of (a) pristine PVdF–HFP, PVdF–HFP + x wt% of IL BMIMBF4 where (b) x = 10 and (c) 30 at different cooling rates (ϕ).

image file: c4ra07085b-f9.tif
Fig. 9 Linear fitting plots of log[−ln(1 − Xt)] versus log[thin space (1/6-em)]t for the non-isothermal crystallization kinetics process of (a) pristine PVdF–HFP, PVdF–HFP + x wt% of IL BMIMBF4 where (b) x = 10 and (c) 30 at different cooling rates (ϕ).

Since the crystallization rate depends upon the cooling rate (ϕ), Jeziorny39 suggested that the non-isothermal crystallization rate (Zc) should be corrected by the cooling rate (ϕ) to obtain the corresponding corrected rate constant (Zc).

 
log[thin space (1/6-em)]Zc = log[thin space (1/6-em)]Zt/ϕ (5)

However, the nonlinear dependence of log[−ln(1 − Xt)] against log[thin space (1/6-em)]t (see Fig. 8) suggests that the Avrami equation modified by Jeziorny is not suitable for the entire non-isothermal crystallization process because this modified equation is valid only at the initial stage of the non-isothermal crystallization process.

Linear fittings of the log[−ln(1 − Xt)] against log[thin space (1/6-em)]t plots at the initial stage of crystallization for pristine PVdF–HFP and PVdF–HFP + x wt% of IL BMIMBF4 are shown in Fig. 9, as mentioned above. The values of the Avrami constant n′ and Zc obtained by the modified Avrami equation in the non-isothermal crystallization method are given in Table 2. From Table 2, it can be seen that the value of n′ varies slightly between 1 and 2, suggesting that the non-isothermal crystallization mechanism for the pristine PVdF–HFP and PVdF–HFP + x wt% of IL BMIMBF4 membranes did not change much as the heating rate changed. It can also be concluded from Table 2 that the value of Zc, i.e., the corrected rate constant, increases with increasing the heating rate, since the time needed for the complete crystallization decreased as the heating rates increased.

Table 2 Different crystallization parameters of (a) pristine PVdF–HFP, PVdF–HFP + x wt% of IL BMIMBF4 where (b) x = 10 and (c) 30 obtained by Avrami plots using the non-isothermal crystallization method
PVdF–HFP + x wt% of BMIMBF4 Heating rate (φ) (°C min−1) n Zt (minn) Zc t1/2 (min)
X = 0 5 1.05 0.037 0.517 11.13
10 1.16 0.076 0.773 5.23
15 1.45 0.141 0.877 3.23
20 1.57 0.2 0.922 2.35
X = 10 5 1.03 0.051 0.552 7.46
10 1.11 0.115 0.805 3.50
15 1.34 0.230 0.906 2.20
20 1.51 0.374 0.952 1.55
X = 30 5 1.04 0.053 0.556 7.17
10 1.09 0.120 0.814 3.02
15 1.13 0.178 0.897 2.17
20 1.62 0.382 0.951 1.39


Ozawa's method. According to the Ozawa theory,40 non-isothermal crystallization is the result of an infinite number of small isothermal crystallization steps. The corresponding equation for relative degree of crystallinity is given by
 
1 − Xt = exp(−K(T)/ϕm) (6)
where K(T) is the cooling crystallization function, which is related to the overall crystallization rate and indicates how fast crystallization occurs, and m is the Ozawa exponent, which depends on the dimensions of crystal growth. The double-logarithm form of eqn (6) is
 
log[−ln (1 − Xt)] = log(−K(T) − m[thin space (1/6-em)]log[thin space (1/6-em)]ϕ (7)

By studying the non-isothermal crystallization process at different cooling rates, from log[−ln(1 − Xt)] vs. log[thin space (1/6-em)]ϕ plots at a given temperature, a straight line should be obtained and values of m and K(T) can be found out by the slope and the intercept, respectively. But in our case, this theory was not valid. The non-linear dependence of log[−ln(1 − Xt)] vs. log[thin space (1/6-em)]ϕ (see Fig. S1 in ESI) shows that the Ozawa equation is not appropriate to illustrate the non-isothermal crystallization process.

Mo's method. In order to understand the crystallization behaviour, a method proposed to describe the non-isothermal crystallization process by Mo's group41 has been used. By combining the Ozawa and Avrami equations, Mo derived the following equation for non-isothermal crystallization kinetics behaviour:
 
log[thin space (1/6-em)]ϕ = log[thin space (1/6-em)]F(T) – b[thin space (1/6-em)]log[thin space (1/6-em)]t (8)
where F(T) = [K(T)/Zt]1/m, m is the Ozawa exponent, and b is the ratio between the Avrami exponent and Ozawa exponent (b = n/m). F(T) refers to the value of the cooling rate chosen at unit crystallization time when the system has a defined degree of crystallinity. For the non-isothermal crystallization kinetics of pristine PVdF–HFP and PVdF–HFP + x wt% of IL BMIMBF4, a good linear relationship between log[thin space (1/6-em)]ϕ vs. log[thin space (1/6-em)]t could be seen for all the prepared membranes (see Fig. 10) and the values of log[thin space (1/6-em)]F(T) and b as the intercept and the slope respectively are given in Table 3. It is shown that the F(T) systematically decreases and the value of b increases with a rise in the relative degree of crystallinity.

image file: c4ra07085b-f10.tif
Fig. 10 Plots of log[thin space (1/6-em)]ϕ vs. log t for the non-isothermal crystallization kinetics process of (a) pristine PVdF–HFP, PVdF–HFP + x wt% of IL BMIMBF4 where (b) x = 10 and (c) 30 at different relative degrees of crystallinity (Xt).
Table 3 Non-isothermal crystallization kinetics parameters of (a) pristine PVdF–HFP, PVdF–HFP + x wt% of IL BMIMBF4 where (b) x = 10 and (c) 30 at different degrees of crystallinity
PVdF–HFP + x wt% of BMIMBF4 XT (%) F(T) b
X = 0% 10 0.0828 0.9423
20 0.0453 1.0325
30 0.0269 1.1094
40 0.0172 1.1663
50 0.0146 1.1252
60 0.0129 1.0875
70 0.0115 1.0638
80 0.0098 1.0703
90 0.0093 1.0320
100 0.0085 1.0267
X = 10% 10 0.0880 1.0959
20 0.0723 0.9929
30 0.0546 0.9873
40 0.0309 1.1046
50 0.0215 1.1293
60 0.0177 1.1053
70 0.0146 1.1014
80 0.0129 1.0698
90 0.0107 1.0959
100 0.0094 1.0943
X = 30% 10 0.0841 1.1416
20 0.0383 1.2058
30 0.0348 1.1160
40 0.0277 1.1334
50 0.0221 1.1498
60 0.017 1.1756
70 0.0146 1.1563
80 0.0123 1.1573
90 0.0106 1.1565
100 0.0095 1.1488


In addition, an approach often used to evaluate the activation energy at different cooling rates was proposed by Kissinger,42 based on the following equation:

 
d[ln[thin space (1/6-em)]ϕ/Tp2]/d(1/Tp)] = −ΔE/R (9)
where R is the gas constant and ΔE is the activation energy for the crystallization. The slopes of the plots of log(ϕ/Tp2) vs. log(1/Tp) were used to determine the activation energies (ΔE) for the non-isothermal crystallizations of pristine PVdF–HFP and PVdF–HFP + x wt% of IL BMIMBF4 (Fig. 11). These activation energy values for pristine PVdF–HFP and the PVdF–HFP + x wt% of IL BMIMBF4 (where x = 10 and 30) were determined to be ∼162, 124 and 108 KJ per mole respectively. The decreasing activation energy with increasing amount of ionic liquid in PVdF–HFP indicates easier ionic transport in PVdF–HFP + IL gel membranes having higher amount of ionic liquid, as a result of increasing plasticization/amorphization of the polymeric membranes, which suppresses the crystallization rate.


image file: c4ra07085b-f11.tif
Fig. 11 ln(ϕ/t2p) versus a (1/tp) plot for evaluating the non-isothermal crystallization activation energy for (a) PVdF–HFP, PVdF–HFP + x wt% of IL BMIMBF4 where (b) x = 10 and (c) x = 30.

Conclusions

In the present study, the crystallization behaviours of pristine PVdF–HFP and PVdF–HFP + x wt% of IL BMIMBF4 (where x = 10 and 30) were studied by isothermal and non-isothermal crystallization processes using DSC. The isothermal crystallization process of pristine PVdF–HFP and prepared membranes was well described by the Avrami equation. The values of the Avrami exponent n lie between 1 and 2 for all the prepared membranes indicating two-dimensional growth of spherulites. It has been found that the presence of the ionic liquid BMIMBF4 in the PVdF–HFP matrix suppresses the crystallization of polymer PVdF–HFP, resulting in low crystal growth rates. This effect occurs because the presence of IL (which amorphizes/plasticizes the polymers) hinders the chain folding, and thereby increases the time it takes for crystallization to occur when the crystallization depends on a folded polymer. The flexible nature of a polymer allows it to sample the conformations necessary for joining a crystal, but such flexibility is decreased in the presence of IL. Various kinetics methods such as those of Jeziorny, Ozawa and Mo have been employed to study the non-isothermal crystallization process. The Avrami equation modified by Jeziorny could only describe the initial stage of crystallization and the Ozawa method failed to describe the non-isothermal crystallization behavior, but Mo's method (i.e., the combination of the Avrami and Ozawa equations) clarifies the results better. All parameters such as the Avrami exponent, crystallization rate constant and crystallization half time are found to be strongly dependent on the cooling rate and concentration of IL. The activation energy (ΔE) of the prepared membranes varies with IL loading.

Acknowledgements

R.K. Singh is grateful to the BRNS-DAE, India, for financial assistance. Shalu and S.K.C wish to thank the U.G.C. and CSIR New Delhi, India, respectively, for their Research Fellowships.

References

  1. J. Dou and Z. Liu, Polym. Int., 2013, 62, 1698 CrossRef CAS .
  2. S. Acierno, N. Grizzuto and H. H. Winter, Macromolecules, 2002, 35, 5043 CrossRef CAS .
  3. A. Fernicola, S. Panero and B. Scrosati, J. Power Sources, 2008, 178, 591 CrossRef CAS PubMed .
  4. M. Watanabe, K. Sanui and N. Ogata, J. Appl. Phys., 1985, 57, 123 CrossRef CAS PubMed .
  5. S. A. Hashmi, A. Kumar, K. K. Maurya and S. Chandra, J. Phys. D: Appl. Phys., 1990, 23, 1307 CrossRef CAS .
  6. Polymer Electrolytes: Fundamental and Technological Applications, ed. F. M. Gray, VCH Publishers, New York, 1991 Search PubMed .
  7. K. Shahi and J. B. Wagner Jr, Solid State Ionics, 1981, 3–4, 295 CrossRef CAS .
  8. F. Croce, G. B. Appetecchi, L. Persi and B. Scrosati, Nature, 1998, 394, 456 CrossRef CAS PubMed .
  9. G. B. Appetecchi, F. Crore and B. Scrosati, Electrochim. Acta, 1995, 40, 991 CrossRef CAS .
  10. J. Y. Song, Y. Y. Wang and C. C. Wang, J. Power Sources, 1999, 77, 183 CrossRef CAS .
  11. N. Rajeswari, S. Selvasekarapandian, M. Prabu, S. Karthikeyan and C. Sanjeeviraja, Bull. Mater. Sci., 2014, 36, 333 CrossRef PubMed .
  12. T. Itoh, K. Fujita, K. Inoue, H. Iwama, K. Kondoh, T. Uno and M. Kubo, Electrochim. Acta, 2013, 112, 221 CrossRef CAS PubMed .
  13. S. K. Chaurasia, R. K. Singh and S. Chandra, Solid State Ionics, 2011, 183, 32 CrossRef CAS PubMed .
  14. Shalu, S. K. Chaurasia, R. K. Singh and S. Chandra, J. Phys. Chem. B, 2013, 117, 897 CrossRef CAS PubMed .
  15. A. M. Smith, K. R. J. Lovelock, N. N. Gosvami, P. Licence, A. Dolan, T. Welton and S. Perkin, J. Phys. Chem. Lett., 2013, 4, 378 CrossRef CAS .
  16. A. L. Saroj and R. K. Singh, J. Phys. Chem. Solids, 2012, 73, 162 CrossRef CAS PubMed .
  17. Electrochemical Aspects of ionic Liquids, ed. H. Ohno, John Wiley & Sons, inc, Hoboken NJ, 2005 Search PubMed .
  18. M. P. Singh, R. K. Singh and S. Chandra, Prog. Mater. Sci., 2014, 64, 73 CrossRef CAS PubMed .
  19. M. P. Scott, C. S. Brazel, M. G. Benton, J. W. Mays, J. D. Holbrey and R. D. Rogers, Chem. Commun., 2002, 1370 RSC .
  20. S. Das, P. Kumar, K. Dutta and P. P. Kundu, Appl. Energy, 2014, 113, 169 CrossRef CAS PubMed .
  21. N. Angulakshmi, S. Thomas, K. S. Nahm, A. Manuel Stephan and R. Nimma Elizabeth, Ionics, 2011, 17, 407 CrossRef CAS .
  22. S. Ramesh, C.-W. Liew and A. K. Arof, J. Non-Cryst. Solids, 2011, 357, 3654 CrossRef CAS PubMed .
  23. B. Choi, Solid State Ionics, 2004, 168, 123 CrossRef CAS PubMed .
  24. V. Sencadas, P. Martins, A. Pites, M. Benelmekki, J. L. G. Ribelles and S. L. Mendez, Langmuir, 2011, 27, 7241 CrossRef CAS PubMed .
  25. J. Yeh, M. Yang, C. Wu, X. Wu and C. Wu, Polym.-Plast. Technol. Eng., 2008, 47, 1289 CrossRef CAS .
  26. J. Jin, M. Song and F. Pan, Thermochim. Acta, 2007, 456, 25–31 CrossRef CAS PubMed .
  27. A. K. Gupta, R. K. Singh and S. Chandra, RSC Adv., 2014, 4, 22277 RSC .
  28. J. jang and D. K. Lee, Polymer, 2003, 44, 8139 CrossRef CAS PubMed .
  29. S. K. Chaurasia, R. K. Singh and S. Chandra, CrystEngComm, 2013, 15, 6022 RSC .
  30. A. T. Lorenzo, M. Luisa Arnal, J. Albuerne and A. J. Muller, Polym. Test., 2007, 26, 222 CrossRef CAS PubMed .
  31. J. Maiz, J. Martin and C. Mijangos, Langmuir, 2012, 28, 12296 CrossRef CAS PubMed .
  32. M. Naffakh, C. Marco and M. A. Gomez-Fatou, J. Phys. Chem. B, 2011, 115, 2248 CrossRef CAS PubMed .
  33. M. Avrami, J. Chem. Phys., 1939, 7, 1103 CrossRef CAS PubMed .
  34. M. Avrami, J. Chem. Phys., 1941, 9, 177 CrossRef CAS PubMed .
  35. A. Boschetti-de-Fierro, A. T. Lorenzo, A. J. Muller, H. Schmalz and V. Abetz, Macromol. Chem. Phys., 2008, 209, 476 CrossRef CAS .
  36. P. Martins, C. M. Costa, J. C. C. Ferreira and S. LancerosMendez, J. Phys. Chem. B, 2012, 116, 794 CrossRef CAS PubMed .
  37. V. Sencadas, P. Martins, A. Pitaes, M. Benelmekki, J. L. G. Ribelles and S. Lanceros-Mendez, Langmuir, 2011, 27, 7241 CrossRef CAS PubMed .
  38. Y. Yang and Z. Qiu, CrystEngComm, 2011, 13, 2408 RSC .
  39. A. Jeziorny, Polymer, 1978, 19, 1142 CrossRef CAS .
  40. T. Ozawa, Polymer, 1971, 12, 150 CrossRef CAS .
  41. T. Liu, Z. Mo, S. Wang and H. Zhang, Polym. Eng. Sci., 1997, 37, 568 CAS .
  42. H. E. Kissinger, Anal. Chem., 1957, 29, 1702 CrossRef CAS .

Footnote

Electronic supplementary information (ESI) available. See DOI: 10.1039/c4ra07085b

This journal is © The Royal Society of Chemistry 2014
Click here to see how this site uses Cookies. View our privacy policy here.