
 Open Access Article
 This Open Access Article is licensed under a
 Creative Commons Attribution 3.0 Unported Licence
Single-step green synthesis of imine-functionalized carbon spheres and their application in uranium removal from aqueous solution†
Shashi Prabha
Dubey
ab,
Amarendra Dhar
Dwivedi
b,
Mika
Sillanpää
b,
Young-Nam
Kwon
*a and
Changha
Lee
*a
aSchool of Urban and Environmental Engineering, Ulsan National Institute of Science and Technology (UNIST), 100 Banyeon-ri, Eonyang-eup, Ulju-gun, Ulsan 698-805, Republic of Korea. E-mail: kwonyn@unist.ac.kr; clee@unist.ac.kr; Tel: +82-52-217-2810 Tel: +82-52-217-2812
bLaboratory of Green Chemistry, LUT Chemtech, Lappeenranta University of Technology, Sammonkatu 12, 50130 Mikkeli, Finland
First published on 8th September 2014
Abstract
Carbon spheres (CSs) have become a recent focus of attention in environmental remediation techniques. In this study, imine-functionalized CSs were synthesized from plant extract (peCSs) for the first time and effectively used in U(VI) removal from contaminated water. Plant extracts of Sorbaria sorbifolia were utilized for the synthesis of peCSs via a single-step hydrothermal carbonization, and the physico-chemical properties of the synthesized peCSs were characterized by spectroscopic analysis. The peCSs showed high nitrogen content (∼7.49%) due to the presence of naturally occurring cyanogenic glycosides and mesoporosity (8.31 nm). The plant extract concentration played an important role in determining the size of the peCSs, which ranged from 0.5 to 3.0 μm. The adsorption capacity (Qm) of peCSs for U(VI) (Qm ≈ 113 mg g−1) was higher than that of the glucose-derived CSs (Qm ≈ 57 mg g−1) and commercial powdered activated carbon (Qm ≈ 44 mg g−1). A plausible mechanism for the higher adsorption efficacy of peCSs was proposed via sorbate–sorbent interactions. The ionic strength (0.01 M to 1 M NaCl) showed the weakest effect on the U(VI) adsorption. The multiple adsorption–desorption cycling test revealed that the efficacy of peCSs does not significantly decrease after repetitive use.
Introduction
Various carbon materials ranging from micrometre- to nanometre-scale are of great interest due to their applications in environmental remediation, catalysis, energy and gas storage. Carbon-based materials, including carbon nanotubes, graphene oxide and carbon spheres (CSs), have been studied as alternative catalyst supports and novel adsorbents for pollutant removal due to their unique physical/chemical characteristics.1 Recently, CSs have attracted significant research interest due to their low surface energy, low density, tunable sphere size, high mechanical stability and desirable surface chemical properties.2 Most synthesized CS surfaces exhibit graphitic character and dangling bonds, which significantly enhance their surface chemical reactivity towards a variety of inorganic and organic interactions, favouring application as an adsorbent and catalysis support.3 Many studies have reported the fabrication of CSs, with the most commonly used methods being chemical vapour deposition, chemical metathesis, direct pyrolysis of hydrocarbons, two-step polymerization, ultrasonic treatment and hydrothermal carbonization.4–9 Si-template carbonization followed by HF etching recently produced nitrogen-doped hollow CSs.10 Among all of these methods, hydrothermal carbonization allows the production of CSs under mild conditions.11Uranium is a radioactive heavy metal that can cause cancer in humans subjected to long-term exposure via drinking water. Naturally occurring uranium is usually found at low levels in aquifers. However, the presence of U(VI) at high concentrations is sometimes reported in ground water and surface water as a result of uranium mining and milling activities.12 Considering the irreparable damage caused by U(VI) in drinking water, the guidelines of the World Health Organization suggest 30 μg L−1 as the maximum allowable uranium concentration in drinking water.13 Meanwhile, the recovery of uranium from wastewater and seawater is another important issue for the nuclear fuel industry and related areas. From an economic and technical perspective, adsorptive removal processes are an efficient and viable option. Carbon materials such as activated carbon, carbon fibres, carbon nanotubes, graphene oxide and mesoporous carbon, along with minerals and magnetic metal oxides, have been explored for the removal and the recovery of U(VI).14–20 More recently, Zhang et al. explored the application of CSs in the selective adsorption of U(VI).21,22
The literature showed that hydrothermal carbonization generally utilizes 50–100% of the contents of carbohydrate solutions for the synthesis of CSs.1,23–26 Considering carbohydrate utilization in CS synthesis, our desire was to find a novel and simple method for the synthesis of CSs using natural plant extract, which can also help to reduce the increasing chemical burden of synthesis routes. For this purpose, the Sorbaria sorbifolia (Rosaceae family) plant was chosen due to the presence of bioactive cyanogenic glycosides in the aerial part of the plant, which is a natural nitrogen-containing sugar source.27,28 This plant is a deciduous perennial shrub and commonly grows in temperate areas of Asia, including Korea, Japan and northern China.
The purpose of the present study is to synthesize plant-extract-derived CSs (peCSs) using a green synthetic approach. To the best of our knowledge, there is no report available on the synthesis of CSs from plant extract via a hydrothermal route. Moreover, compared to conventional hydrothermal carbonization, our method for peCS fabrication has the following advantages: (i) the peCSs are fabricated by a completely green synthetic approach in the absence of toxic chemicals, which increases its biocompatibility and potential for medical applications; (ii) the peCSs are fabricated by a simple single-step synthesis using aqueous plant extract as the carbon source; and (iii) the synthesized peCSs exhibit excellent U(VI) adsorption, exceeding that of glucose-derived CSs (gCSs) and commercial powdered activated carbon (PAC).
Experimental section
Reagents
All chemicals used in the study were of reagent grade. Uranyl nitrate hexahydrate (UO2(NO3)2·6H2O), hydrochloric acid (HCl), sodium hydroxide (NaOH) and sodium chloride (NaCl) were obtained from Sigma-Aldrich Co. (USA). D-Glucose and PAC were purchased from Daejung Chemical Co. (Korea). All of the chemicals were used as received without further purification. All solutions were prepared using 18 MΩ cm Milli-Q water from a Millipore system.Preparation of peCS
Fresh leaves of Sorbaria sorbifolia were collected locally from Ulsan city in April. First, 75 g of fresh leaves was weighed and washed several times with ultrapure water to remove any dirt. The weighed leaves were boiled in 250 mL of ultrapure water in a 500 mL Erlenmeyer flask for 120 min and cooled at room temperature. The solution was then filtered through Whatman filter paper (no. 40), and the filtrate (denoted as 100% plant extract) was stored at −20 °C for further use in the synthesis of the peCS. A 100 mL sample of the plant extract was placed in a 200 mL Teflon vessel for hydrothermal carbonization. The reaction was carried out at 175 °C for 5 h. After natural cooling of the hydrothermal reaction, peCS was collected by centrifugation at 15![[thin space (1/6-em)]](https://www.rsc.org/images/entities/char_2009.gif) 000 rpm for 20 min and washed with water and ethanol to remove potential impurities before being dried in oven at 80 °C for 5 h. In a similar way, 50% and 25% plant extracts were prepared by diluting 100% plant extract with ultrapure water and then used for peCS synthesis. Additionally, the glucose-derived CS (gCS) was prepared from D-glucose precursor using a method reported earlier.1
000 rpm for 20 min and washed with water and ethanol to remove potential impurities before being dried in oven at 80 °C for 5 h. In a similar way, 50% and 25% plant extracts were prepared by diluting 100% plant extract with ultrapure water and then used for peCS synthesis. Additionally, the glucose-derived CS (gCS) was prepared from D-glucose precursor using a method reported earlier.1
Characterizations
Microscopic images of the peCSs were recorded by a cold field-emission-gun scanning electron microscope (FE-SEM; S4800, Hitachi, Japan) at 10 kV. The presence of different elements in peCS was determined by the energy dispersive spectrum (EDS). Powder diffraction data were collected for 2θ angles between 5° and 80° with a scanning speed of 0.05° s−1 using a high-power X-ray diffractometer (XRD; D/MAX 2500 V/PC, Rigaku, Japan). X-ray photoelectron spectroscopy (XPS; K-alpha, Thermo Fisher, USA) study was performed to confirm the chemical composition of native peCSs and U(VI)-loaded samples. A micro-Raman system (Raman: Alpha 300R, WITec, Germany) with a 532 nm helium–neon laser source was used to collect Raman scattering patterns. The surface functionality was measured by Fourier Transform infrared spectroscopy (FTIR; Nicolet 6700, Thermo Fisher, USA) using a spectral range of 4000 to 400 cm−1 with a resolution of 4 cm−1. The surface charge of peCS was measured on a Zeta-sizer Nano S (ZEN 3600, Malvern Instruments, UK). The pH of the peCS solutions was varied from pH 2.0 to 10.0 by adjusting with 0.1 N HNO3 and NaOH solutions. The specific surface area of peCS was calculated by the Brunauer–Emmett–Teller (BET) method on a Gemini V system (Micromeritics, USA), and the pore size was determined using the Barrett–Joyner–Halenda (BJH) method. Simultaneous differential scanning calorimetry (DSC) thermogravimetric analysis (TGA) was performed on 10 mg samples placed in alumina crucibles using a SDT Q600 instrument (TA Instruments, USA) at a heating rate of 10 °C min−1 from room temperature to 900 °C to identify the stability of peCSs under air and nitrogen atmospheres.U(VI) adsorption
Batch adsorption experiments were performed to evaluate the adsorption efficacy of peCSs for U(VI) removal. First, 5 mg of adsorbent was mixed with 20 mL of 5 mg L−1 U(VI) solution prepared by diluting a stock solution of uranyl nitrate hexahydrate. The reaction pH was adjusted with 0.1 N HNO3 and NaOH solutions. After the optimized contact time, the solution was filtered through a 0.45 μm nylon filter, and the remaining concentration of U(VI) was determined spectrophotometrically using arseno-azo(III) as a colour reagent.29 The effects of various parameters, including pH, adsorbent dose, contact time, initial U(VI) concentration and ionic strength, were examined.Desorption and reusability experiments
The reusability of peCSs was tested using multiple adsorption–desorption cycles. First, U(VI) was adsorbed on the surface of peCSs by mixing 10 mg of peCS with 40 mL of 5 mg L−1 U(VI) solution at pH 4. After 6 h of stirring, the peCSs were separated by centrifugation at 3000 rpm for 15 min, and the residual U(VI) in the solution was analysed to calculate the amount of adsorbed U(VI). For the desorption of U(VI), the separated peCSs were mixed with 40 mL of 0.1 N NaOH, and the mixture was stirred for 3 h. The peCSs were then centrifuged, and the concentration of U(VI) in the solution was measured. The separated peCSs were washed with ultrapure water three times, dried at 80 °C for 6 h and reused in the next cycle of the adsorption–desorption test. Five cycles were run consecutively.Results and discussion
Synthesis of peCSs and effect of plant extract concentration
The preparation of the plant extract and the synthesis of peCSs are discussed in the Experimental section. Various cyanogenic glycosides are present in the aerial parts of Sorbaria sorbifolia,28,30 as shown in Fig. 1.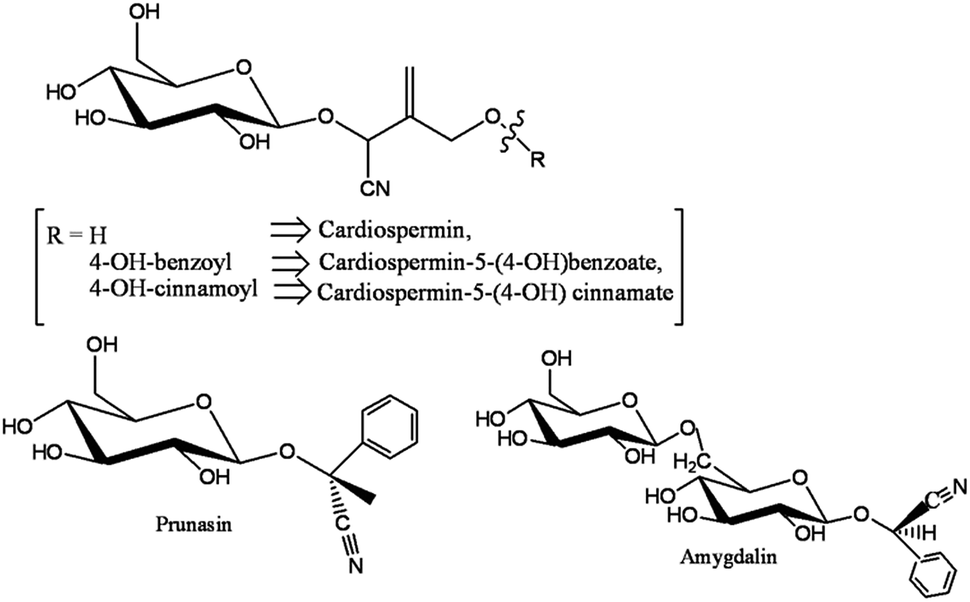 | ||
| Fig. 1 Various popular cyanogenic glycosides from Sorbaria sorbifolia (Rosaceae family). | ||
The cyanogenic glycosides could be converted to imino glycosides during hydrothermal reaction by simple hydrolysis. Furthermore, polymerization and carbonization of the aqueous extract during hydrothermal treatment resulted in the formation of peCSs. A possible mechanism for the conversion of the cyanogenic group to an imine group has been proposed and is presented in Scheme 1. It is believed that three steps (I to III) are involved in the production of the imine-derived functionality: (i) activation of nitrile by a weak nucleophile (H2O) and protonation, increasing its electrophilicity, (ii) the attack by the nucleophilic centre of water (O) on the electrophilic C centre in CN and (iii) deprotonation of the oxygen from H2O, forming the imine-functionalized group, which led to the formation of imine-functionalized CSs after polymerization and carbonization.
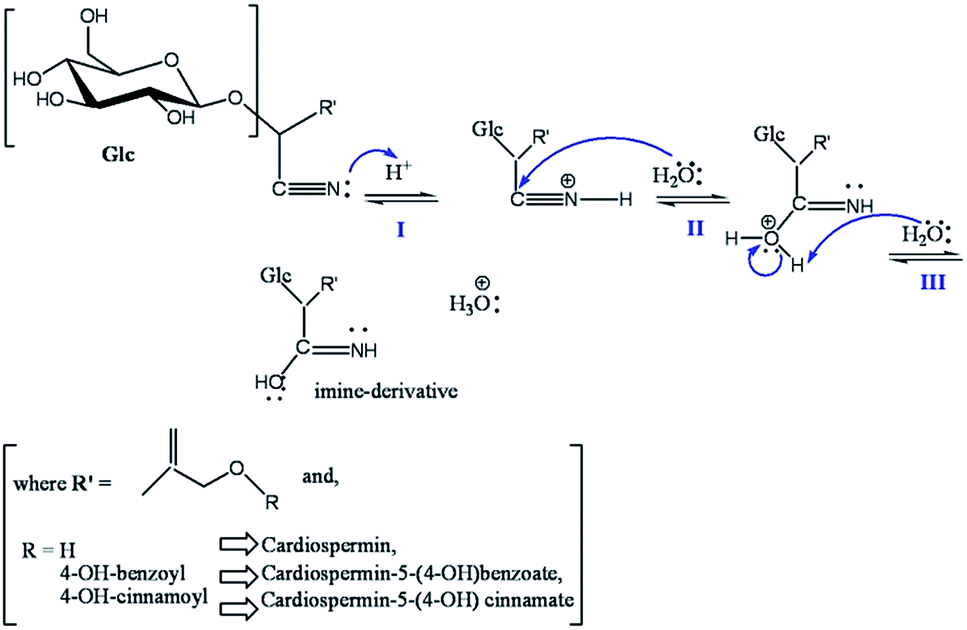 | ||
| Scheme 1 Possible hydrothermal routes of plant-extract-derived cyanogenic glycosides. | ||
The effect of plant extract concentration on the size of peCSs formed after hydrothermal treatment was investigated (Fig. 2). Keeping other experimental conditions and the solution volume constant, the plant extract concentration was varied from 100% to 50% to 25%. The particle size of the peCSs decreased with decreasing concentration of plant extract concentration. At 100% plant extract concentration, 1.5 to 3.0 μm peCSs were observed. However, at 50% and 25% plant extract concentrations, 1.0 to 2.0 μm and 0.5 to 1.0 μm peCSs were observed, respectively. Similar observations have been made in glucose-based CS synthesis.25 The rest of the study was performed using the peCSs obtained from 50% plant extract.
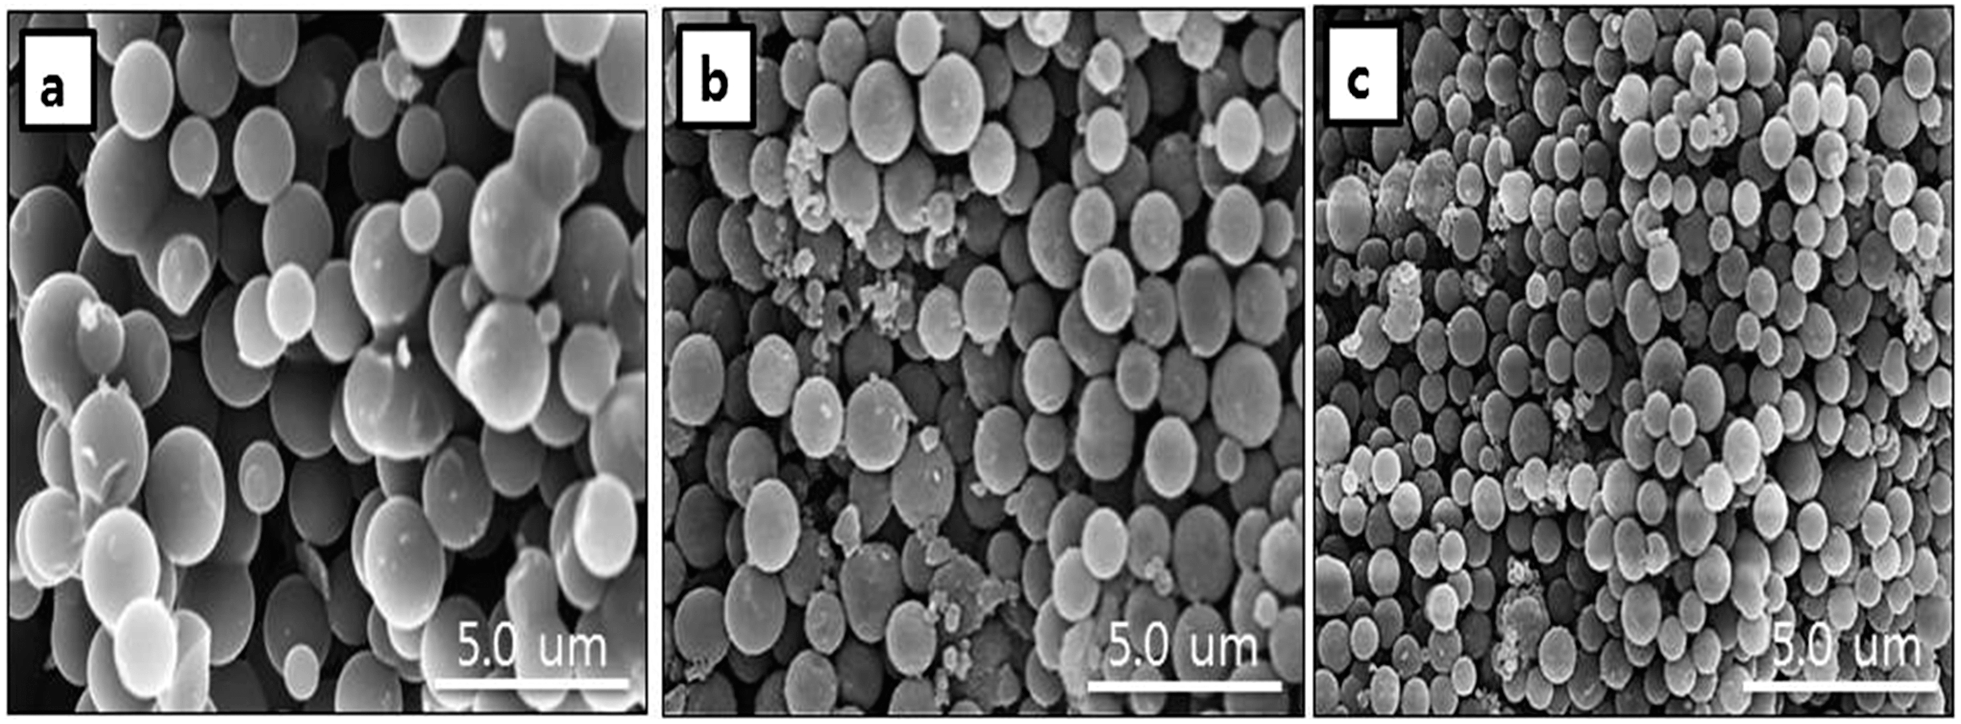 | ||
| Fig. 2 Microscopic images of peCS samples at different plant extract concentrations: (a) 100%, (b) 50%, (c) 25%. | ||
Characterizations
The physico-chemical properties of the synthesized peCSs were investigated by various spectroscopic techniques and other analyses. The FTIR spectrum showed a broad absorption band at 3202 cm−1, which could be assigned to the stretching vibrations of NH groups31 (ESI Fig. S1a†). The band at 2966 cm−1 was due to the CH stretching vibrations.31 The vibrational bands at 1603 and 1574 cm−1 were mainly associated with C![[double bond, length as m-dash]](https://www.rsc.org/images/entities/char_e001.gif) N stretching,31,32 confirming the presence of imine groups in the peCS samples. The bands observed at 1509 and 1438 cm−1 were possibly due to CC stretching and CH2 deformation.33 The band at 836 cm−1 may have represented the presence of CCH bending vibrations. Other bands at 1357, 1179, 1096 and 1014 cm−1 were attributed to C–H, C–O, C–O–H and C–C stretching in the sugar,34–36 which confirmed the involvement of glycosidic compounds in peCS synthesis. Furthermore EDS spectra of peCS composition showed the presence of C, O and N (76.52, 15.59 and 7.49%), also confirmed the nitrogen containing groups in peCS samples.
N stretching,31,32 confirming the presence of imine groups in the peCS samples. The bands observed at 1509 and 1438 cm−1 were possibly due to CC stretching and CH2 deformation.33 The band at 836 cm−1 may have represented the presence of CCH bending vibrations. Other bands at 1357, 1179, 1096 and 1014 cm−1 were attributed to C–H, C–O, C–O–H and C–C stretching in the sugar,34–36 which confirmed the involvement of glycosidic compounds in peCS synthesis. Furthermore EDS spectra of peCS composition showed the presence of C, O and N (76.52, 15.59 and 7.49%), also confirmed the nitrogen containing groups in peCS samples.
Raman spectra recorded to analyse the nature of the peCS carbon structure showed two prominent peaks (ESI Fig. S1b†). The disorder (D) and graphitic (G) bands, representing sp3- and sp2-bonded C, respectively, were centred at 1360 and 1590 cm−1, respectively. It could be seen that the G peak was more intense than the D peak. The intensity ratio of the D and G band (ID/IG), used to estimate the order and disorder of the carbon network, was lower in peCSs (0.901), indicating the presence of fewer defects and a more extensive sp2-bonded carbon structural network.
The structural compositions of peCSs were studied by XPS. Survey spectra and detailed analyses of each element are correspondingly presented in Fig. 3a and b. A single, clear peak at 284.38 eV could be assigned to a sp2 hybrid C 1s core structure, indicating the presence of graphitic carbon, as already confirmed by the Raman spectrum. The presence of O 1s species was confirmed by the peak at 532.48 eV. XPS analysis was valuable for further confirming the nature of the N 1s component in peCSs. We observed a N 1s peak at 399.78 eV, which is very close to the expected value for imine N (399.3 eV).37 The synthetic procedure and IR analyses mentioned above also indicated the formation of imine N in the peCS samples.
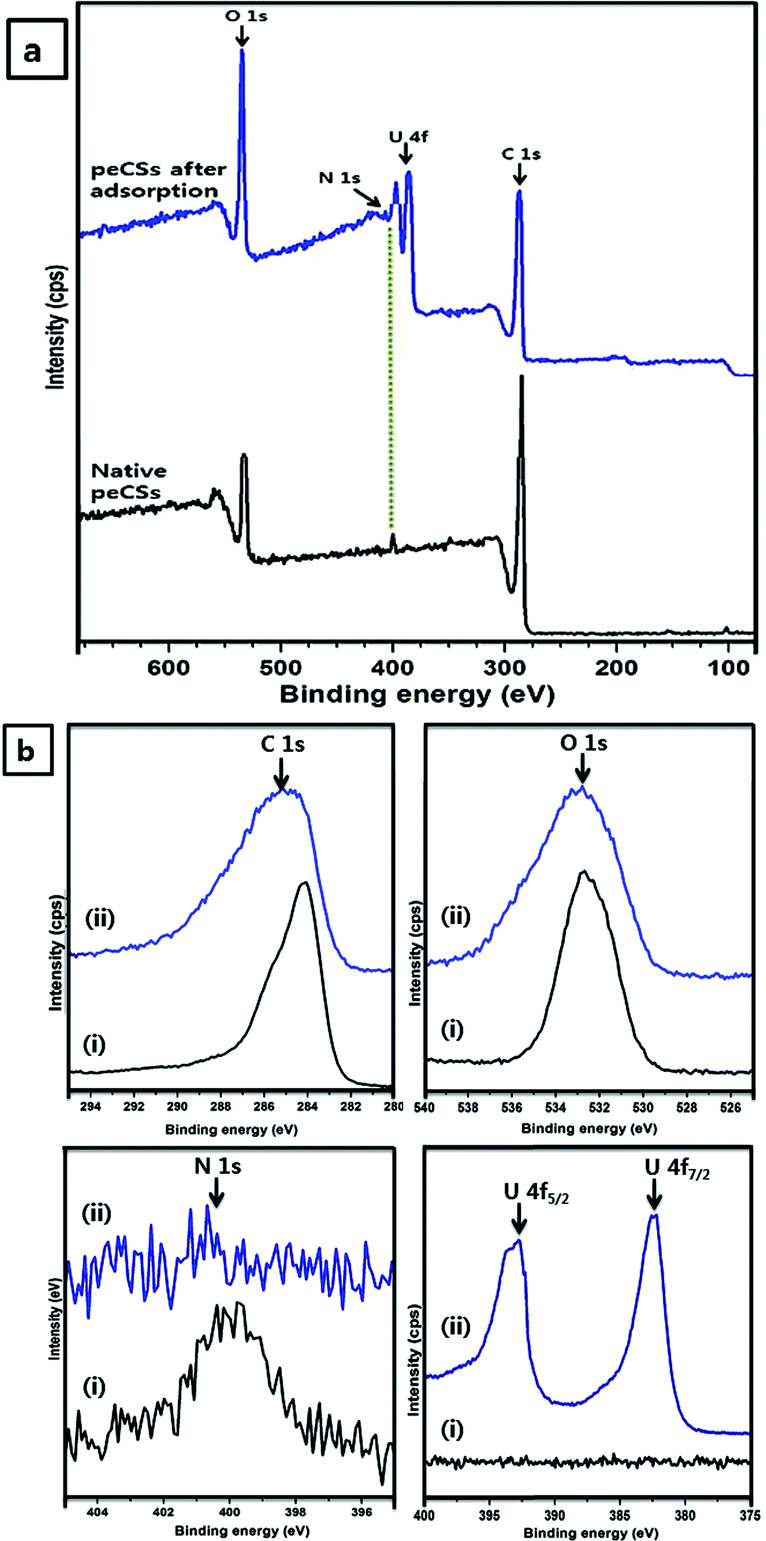 | ||
| Fig. 3 (a) XPS survey spectra of native peCSs and peCSs after U(VI) adsorption. (b) C 1s, O 1s, N 1s and U 4f regions of (i) native peCSs and (ii) peCSs after U(VI) adsorption. | ||
The XRD pattern exhibited two broad peaks corresponding to the (002) and (100) phases, confirming the presence of the amorphous carbon phase in peCS samples (ESI Fig. S2a†).38
N2 adsorption–desorption was utilized to measure the surface area and pore size of the samples. The observed isotherm curve is presented in ESI Fig. S2b.† The specific surface area measured from BET equilibrium is 16.77 m2 g−1. The average mesopore size calculated from the BJH method showed the presence of mesopores (8.31 nm) on the surface of peCSs.
Additionally, the thermal stability of peCSs was compared in air and nitrogen atmosphere by SDT analysis. Fig. 4a and b show the obtained TGA and DSC curves, respectively. Heating in the presence of air resulted in the decomposition/combustion of peCSs in temperature range of 250 to 600 °C, and the rapid weight loss of the material accelerated after 250 °C due to fast oxidation with further increasing temperature. Above 600 °C, the weight stabilized at 15% of the original, revealing the completion of the decomposition/combustion process of peCSs. In the DSC curve, two major exothermic peaks were observed at 316 and 409 °C, which may be due to the decomposition and combustion, respectively, of organic and amorphous C. In contrast, when the sample was heated under N2 atmosphere, no exothermic peak was observed, and the weight loss gradually slowed above 350 °C. This finding suggests that peCSs show higher thermal resistance in N2 than air atmosphere, having stabilized at 60% of the original weight above 800 °C.
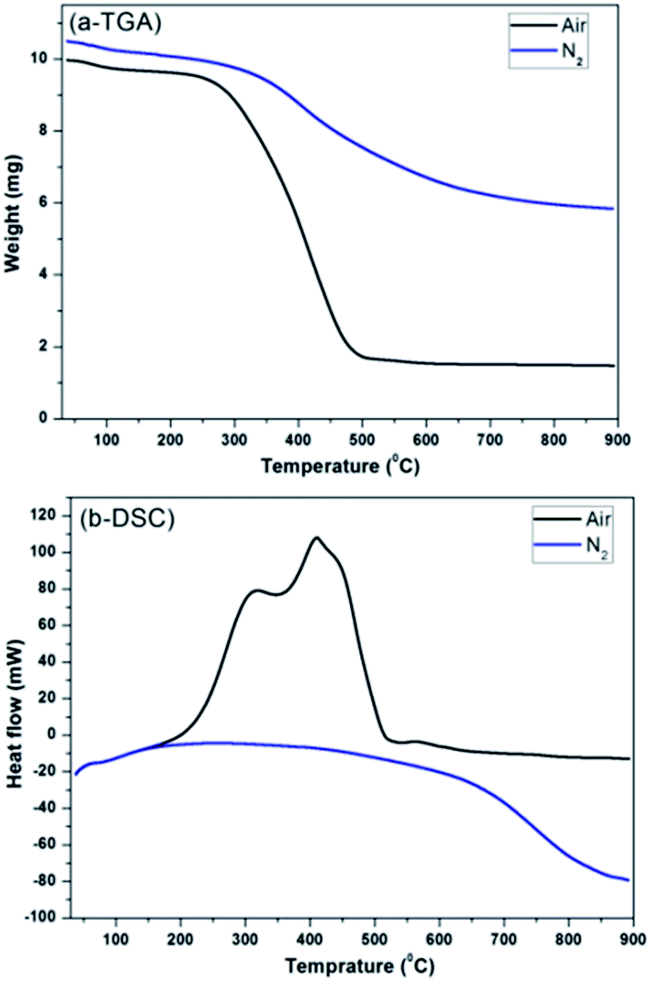 | ||
| Fig. 4 (a) TGA and (b) DSC curves of peCSs under air and N2 atmosphere. | ||
To further differentiate the physico-chemical properties of peCSs and gCSs, FTIR, Raman, XRD, N2-BET isotherm, XPS and SDT analyses were performed. The obtained results are discussed in ESI Section A1 and Fig. S3–S4.† The major differences were due to the presence of N-functionality in the peCS samples, which is clearly absent in the gCS samples. The other characterizations results for the gCSs were similar to those for the peCSs.
U(VI) adsorption
The peCS samples were utilized for U(VI) removal, and important parameters that could affect the adsorption process were evaluated.Effects of peCS dose and pH
First, 20 mL of U(VI) solution was treated with 1, 2.5, 5, 7.5 and 10 mg of peCS sample. The remaining concentration of U(VI) was measured after 6 and 18 h of contact time. Fig. 5a presents the removal efficiency of U(VI) at various peCS doses and contact times. Nearly 92% adsorption was observed for ≥5 mg dosing after 6 h; however, it was slightly higher (∼94%) after 18 h. Furthermore, the effect of pH from 2 to 10 on the removal of U(VI) in aqueous solution was studied (Fig. 5b). An increase in U(VI) removal was observed as the pH increased from 2 to 4. Further increases in the pH from 4 to 6 significantly decreased the U(VI) removal to ∼80%, and a sharp decrease was observed at pH 8 (∼33%) and 10 (∼14%). Thus, maximum U(VI) adsorption was obtained at pH 4.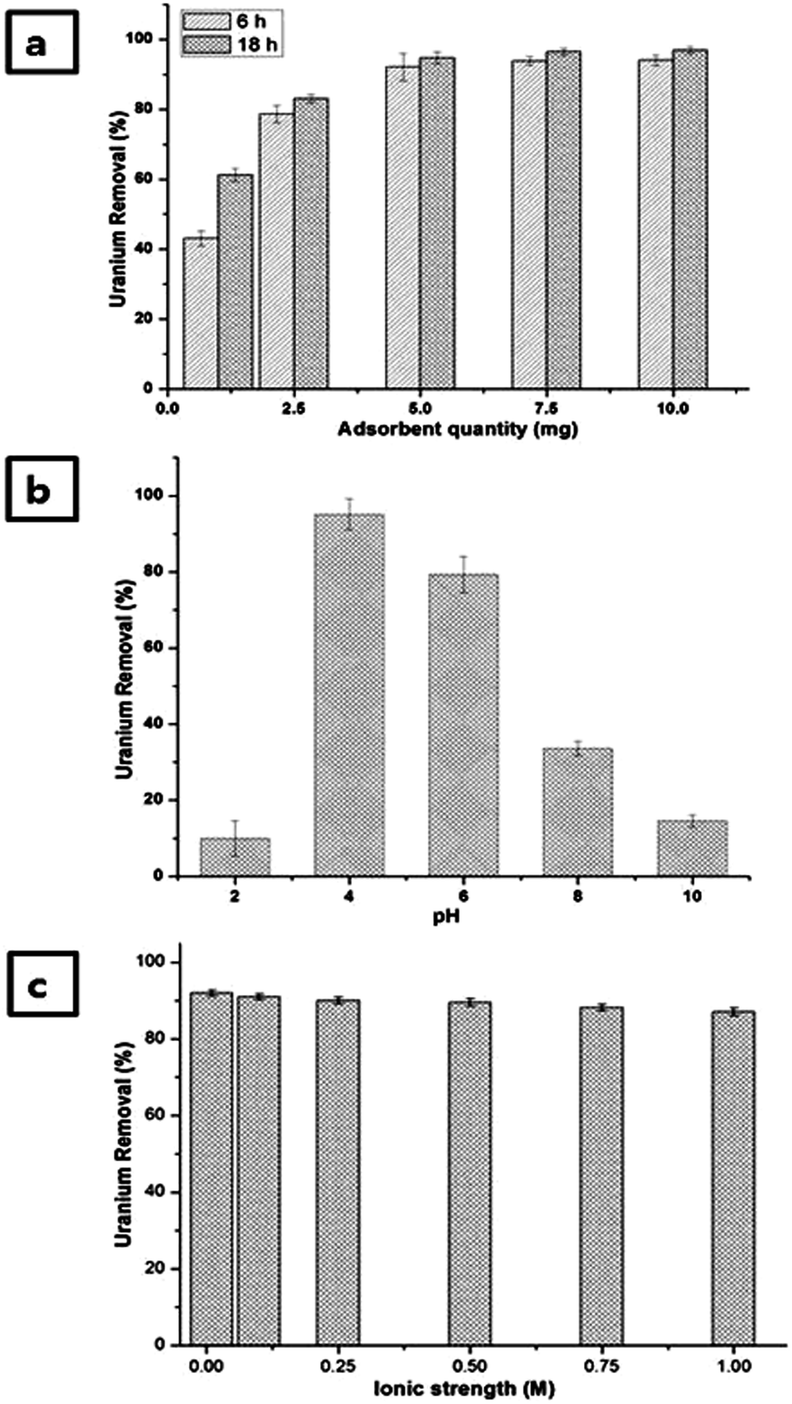 | ||
| Fig. 5 Adsorption efficacy of peCSs. (a) U(VI) removal at different adsorbent doses: [adsorbent dose]0 = 1–10 mg; [U(VI)]0 = 5 mg L−1, U(VI) volume = 20 mL, reaction time = 6 and 18 h, pH = 4. (b) U(VI) removal at different pH: [adsorbent dose]0 = 5 mg, [U(VI)]0 = 5 mg L−1, U(VI) volume = 20 mL, reaction time = 6 h, pH = 2–10. (c) Effect of ionic strength on U(VI) removal: [adsorbent dose]0 = 5 mg, [U(VI)]0 = 5 mg L−1, U(VI) volume = 20 mL, reaction time = 6 h, pH = 4, ionic strength = 0.01–1 M. | ||
The effect of pH on the behaviour of U(VI) adsorption is explained by the U(VI) speciation at varying pH and the surface characteristics of peCSs. Potentiometric titration was used to analyse the surface charge of peCSs at varying pH (2 to 10), and the results are presented in ESI Fig. S5.† The surfaces of the peCSs remained positive until pH 4.59, becoming negative with further increases in pH.
According to the pH-dependent speciation of U(VI) (ESI Fig. S6,† calculated using the constants reported in the literature39), uncomplexed uranyl cation (UO22+) is predominant at pH values lower than 4. At pH 4, uranyl hydroxo complexes ((UO2)(OH)+, (UO2)2(OH)22+ and (UO2)3(OH)5+) are observed for the first time. In the pH range of 7−8, the uncharged dihydroxo complex ((UO2)(OH)2) becomes the major species, and at pH above 8, negative species such as (UO2)3(OH)82− and UO2(OH)3− are dominant. Considering the electrostatic interactions between the U(VI) species and the peCS surface, the attraction forces should be maximized at approximately pH 5.5–6, which is slightly higher than the observed optimum pH for the U(VI) absorption (Fig. 5b). A possible explanation is that the nucleophilic reactivity of imine nitrogen on the peCS surface may favour the interaction with positive species of U(VI), lowering the optimum pH. The interaction between imine and U(VI) can also be dependent on pH, possibly affecting the pH-dependency of U(VI) absorption.
Effect of ionic strength
It is necessary to explore the effect of ionic strength on U(VI) adsorption, as various ionic species may be present in the targeted water samples (natural water or wastewater). U(VI) removal by peCSs was tested at ionic strengths from 0.01 to 1 M (controlled using NaCl solution). The obtained results are shown in Fig. 5c, revealing that the U(VI) adsorption efficacy is not different at either extreme. These results signify that its range of potential treatment application extends from typical freshwater or river water (∼8 to 10 mM) to seawater (∼400 mM) to wastewater (∼1 M or higher).The dependency of U(VI) adsorption on ionic strength has been studied by different researchers. Moreover, a decrease with increasing ionic strength was observed in earlier reported works,40,41 but in present study, the U(VI) adsorption by peCSs showed a remarkable resistance against the effects of high ionic strength. Hence, peCSs can be successfully utilized for U(VI) recovery from seawater or wastewater sources containing ionic background substances.
Kinetics and isotherms of U(VI) adsorption
U(VI) removal by peCSs was compared with that by gCSs and PAC via kinetic and isotherm studies, and the various kinetic and isotherm modelling equations are presented in ESI Section A2.† Batch adsorption parameters were investigated for 5 mg L−1 U(VI) and 5 mg of adsorbent in 20 mL of adsorbate at pH 4 for 6 h. The results for all three materials are shown in ESI Fig. S7.† peCSs, gCSs and PAC exhibited 94, 54 and 38% U(VI) removal efficacy, respectively, under the optimized reaction conditions.Experiments were performed to study the effect of contact time on U(VI) removal by peCSs, gCSs and PAC at different time intervals varying from 0.25 to 18 h. However, the adsorption equilibrium attained at 6 h and longer contact times did not show significant changes in adsorption efficacy. The kinetic curves (qtversus t) for peCSs, gCSs and PAC are presented in Fig. 6a.
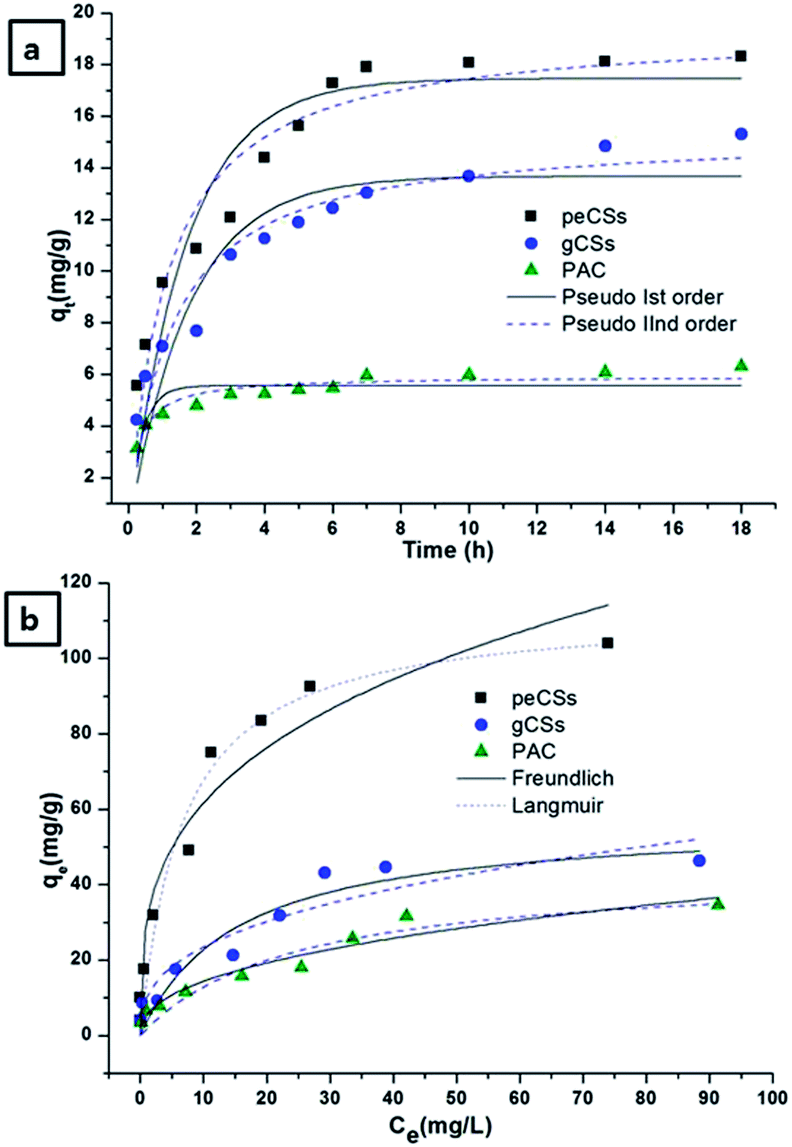 | ||
| Fig. 6 (a) Kinetics of U(VI) removal: [U(VI)]0 = 5 mg L−1, reaction time = 0.25 to 18 h. (b) Isotherm of U(VI) removal: [U(VI)]0 = 1–100 mg L−1, reaction time = 6 h (both experiments: adsorbent dose = 5 mg, pH = 4 and U(VI) volume = 20 mL). | ||
Comparison of the experimental adsorption capacities of peCSs, gCSs and PAC with the calculated adsorption capacities revealed that the pseudo-second-order model fits the experimental data well. Furthermore, the high correlation coefficient (close to unity) and F-value (larger number) for the pseudo-second-order over the pseudo-first-order model suggests that the pseudo-second-order model better fits the U(VI) adsorption on peCSs, gCSs and PAC surfaces (Table 1). The F-value is calculated from the ANOVA table.42 Microcal Origin 8.0 was used to calculate the F-value and the correlation coefficient.
| Adsorbent | q e,exp (mg g−1) | Pseudo first order | Pseudo second order | ||||
|---|---|---|---|---|---|---|---|
| q e,cal (mg g−1) | R 2 | F-value | q e,cal (mg g−1) | R 2 | F-value | ||
| peCSs | 18.32 | 17.46 | 0.845 | 375 | 19.40 | 0.926 | 797 |
| gCSs | 15.30 | 13.67 | 0.822 | 318 | 15.35 | 0.922 | 731 |
| PAC | 6.31 | 5.56 | 0.697 | 621 | 5.92 | 0.889 | 1706 |
Furthermore, transfer of adsorbate moieties on the adsorbent surface can be controlled through external mass transfer in non-porous surfaces or intra-particle diffusion to a porous surface material by adsorption on the interior sites of the adsorbent,43 which can be proved by the linearity of a plot of qtvs. t0.5. Intra-particle diffusion is the sole rate-limiting step if the curve passes through the origin.44 Because peCSs have large pores, which may facilitate the diffusion of adsorbate inside the pore, it appears that adsorption followed the intra-particle diffusion mechanism. The intra-particle diffusion rate constant (kipd) and correlation coefficient of peCSs and gCSs were calculated from the slope of the second linear section (Table 2 and the ESI Fig. S8†). Considering the multilinearity of these plots for U(VI) adsorption on peCSs, gCSs and PAC, three phases may be involved in the adsorption processes. In peCS, gCS and PAC samples, the first linear section revealed external surface diffusion, the second linear section represented intra-particle diffusion, and final linear section was an equilibrium adsorption stage. Because the curves did not pass through the origin, intra-particle diffusion could not be established as the only rate-determining step in the adsorption process on different adsorbent materials. Unuabonah et al. has also suggested that two or more steps govern the adsorption process when qtvs. t0.5 is multilinear.45 However, it was definitely one of the rate-determining steps in a specific time range, and this model was noticeably relevant for peCS-based U(VI) adsorption, which showed a higher correlation coefficient (0.973) than that for gCSs (0.933) and PAC (0.926).
| Adsorbent | k ipd (mg g−1 h−1/2) | C (mg g−1) | R 2 | F-value |
|---|---|---|---|---|
| peCSs | 5.44 | 3.48 | 0.973 | 214 |
| gCSs | 3.85 | 3.17 | 0.933 | 84 |
| PAC | 0.79 | 3.68 | 0.927 | 76 |
The effect of initial U(VI) ion concentration on adsorption by peCSs, CS and PAC was analysed. Isotherm curves were plotted between adsorption capacity (qe) and equilibrium concentration (Ce), as in Fig. 6b. Two parameter models (Langmuir and Freundlich) were investigated to fit the experimental data. The Langmuir isotherm yielded higher correlation coefficients and F-values than the Freundlich model for all three adsorbents over the entire U(VI) concentration range from 1 to 100 mg L−1. Hence, the maximum adsorption capacities (Qm) of the adsorbents were evaluated from the Langmuir isotherm model. Higher Qm was observed for peCSs (∼113 mg g−1) than gCSs (∼57 mg g−1) or PAC (∼44 mg g−1) under the optimized conditions (Table 3).
| Adsorbent | Langmuir isotherm | Freundlich isotherm | ||||||
|---|---|---|---|---|---|---|---|---|
| Q m (mg g−1) | k L | R 2 | F-value | k f | n | R 2 | F-value | |
| peCSs | 113.16 | 0.149 | 0.964 | 338 | 6599 | 3.25 | 0.935 | 186 |
| gCSs | 57.16 | 0.066 | 0.909 | 153 | 552 | 2.73 | 0.885 | 120 |
| PAC | 44.13 | 0.041 | 0.903 | 148 | 56 | 2.37 | 0.931 | 232 |
Higher U(VI) adsorption capacity of peCSs could possibly be explained by pore size (mesopore range) and chelating groups on the peCSs surfaces. Synthesized peCSs exhibited lower surface area (16.77 m2 g−1) than the gCSs (29.56 m2 g−1) sample but the average pore size of peCSs (8.31 nm) was larger than that of gCSs (6.78 nm), which increased corresponding intraparticle diffusion rate (5.44 mg g−1 h−1/2) compared to 3.85 mg g−1 h−1/2 (gCSs) and 0.79 mg g−1 h−1/2 (PAC). These results suggest that the high U(VI) adsorption capacity of peCSs is achieved by the facilitated diffusion of adsorbates into the material pores. Similar observations have been reported in literatures.46,47 In addition, the surface functional groups of peCSs could have intensive electrostatic and chemical interactions with U(VI) ions. The presence of N-containing groups (imine in this study) on the peCS surface form complexes with uranyl species.40 It is speculated that two imine-nitrogens with lone pair electrons coordinate one U(VI) as bidentate ligands. Accordingly, imine group-containing peCSs displayed higher U(VI) adsorption capacity than gCSs and PAC. The reduction in the N 1s peak in the U(VI)-adsorbed peCS sample in Fig. 3a suggested the involvement of an interaction between the N 1s species and U(VI), which facilitated the higher adsorption of U(VI) on the peCS surface relative to the gCS or PAC samples.
Moreover, the dimensionless separation factor (Sf) is generally used to express the characteristics of the Langmuir isotherm. It is reliable when the Sf value is greater than zero and less than one.48 The Sf values of peCSs, gCSs and PAC were calculated and presented in Table 4, showing that the Langmuir adsorption model was favoured for all three adsorbents (0 < Sf < 1).
| Initial concentrations | Dimensionless separation factor | ||
|---|---|---|---|
| C 0 (mg L−1) | peCSs | gCSs | PAC |
| 1 | 0.870 | 0.938 | 0.961 |
| 2.5 | 0.728 | 0.858 | 0.907 |
| 5 | 0.573 | 0.752 | 0.829 |
| 10 | 0.402 | 0.602 | 0.709 |
| 20 | 0.251 | 0.431 | 0.549 |
| 30 | 0.183 | 0.336 | 0.448 |
| 40 | 0.144 | 0.275 | 0.379 |
| 50 | 0.118 | 0.233 | 0.328 |
| 100 | 0.063 | 0.132 | 0.196 |
Desorption and reusability
The desorption and reusability of peCSs was tested. The U(VI)-loaded peCSs were collected after 6 h of adsorption by centrifugation. The material was then mixed with 0.1 N NaOH with stirring for 3 h, and the peCSs was collected, washed with water and used for further adsorption cycles. The results showed that the adsorption efficacy remained excellent (∼90%) for up to three cycles and decreased slightly to (∼77%) in the fifth cycle (Fig. 7). Meanwhile, 95% of U(VI) was desorbed in the first cycle, and the efficacy decrease with further cycling was minor (∼87% desorption in the fifth cycle). The facile desorption of U(VI) upon the addition of NaOH solution supports that the U(VI) adsorption on peCSs is based on electrostatic attractions or coordination bondings that are reversed by the pH change.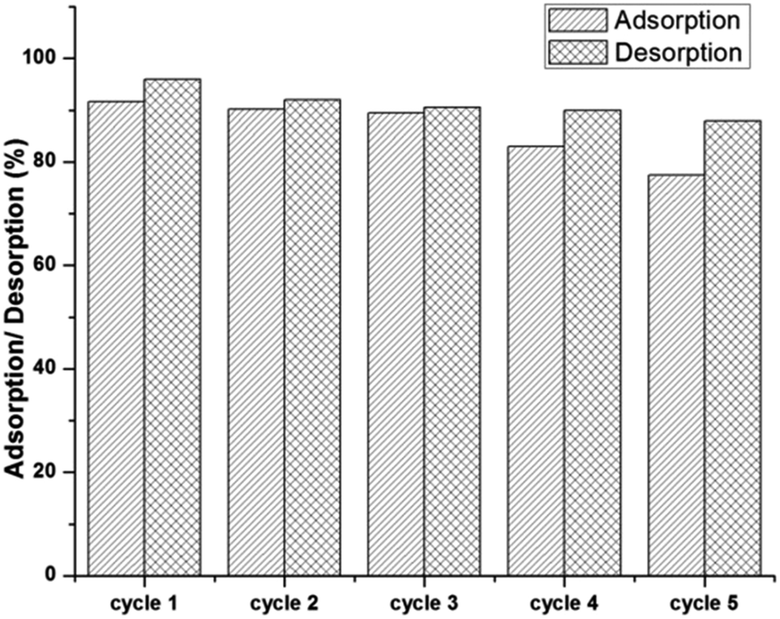 | ||
| Fig. 7 Adsorption/desorption efficacy of peCSs for U(VI) removal. Adsorption conditions: [U(VI)]0 = 5 mg L−1, U(VI) volume = 40 mL, adsorbent dose = 10 mg, pH = 4, reaction time = 6 h. Desorption conditions: eluent (0.1 N NaOH, 40 mL), reaction time = 3 h. | ||
Conclusions
Natural plant extract from Sorbaria sorbifolia was converted to micro-sized carbon spheres by a single-step green synthesis. A simple hydrothermal carbonization of plant extract led to the formation of imine-functionalized carbon spheres. The plant extract concentration was important in determining the size of peCSs, as smaller sizes were obtained at lower concentrations. Microscopic images confirm the formation of peCSs of 0.5–3.0 μm in size with imine functionality, which was confirmed by FTIR and XPS analyses. Synthesized peCSs having mesoporous character (8.31 nm) exhibited better efficacy for the adsorption of U(VI) than gCSs and commercial PAC did. In addition, peCSs showed resistance toward changes in ionic strength. Desorption and recyclability testing proved that the synthesized peCSs can be potentially applied to U(VI) recovery from aqueous media. It is believed that the applications of peCSs are not only restricted to the removal and the recovery of U(VI). The synthesis method reported in this study will offer a wide array of potential applications in environmental and medical areas.Acknowledgements
This work was supported by a grant from the Future Challenge Project funded by Ulsan National Institute of Science and Technology (1.130011.01) and by “The GAIA Project” funded by the Korea Ministry of Environment (RE201402059).Notes and references
- S. P. Dubey, A. D. Dwivedi, I.-C. Kim, M. Sillanpää, Y.-N. Kwon and C. Lee, Chem. Eng. J., 2014, 244, 160–167 CrossRef CAS PubMed.
- X. Chen, K. Kierzek, Z. Jiang, H. Chen, T. Tang, M. Wojtoniszak, R. J. Kalenczuk, P. K. Chu and E. Borowiak-Palen, J. Phys. Chem. C, 2011, 115, 17717–17724 CAS.
- Z. C. Kang and Z. L. Wang, J. Mol. Catal. A: Chem., 1997, 118, 215–222 CrossRef CAS.
- K. Wilgosz, X. Chen, K. Kierzek, J. Machnikowski, R. J. Kalenczuk and E. Mijowska, Nanoscale Res. Lett., 2012, 7, 269 CrossRef PubMed.
- L.-L. Pang, J.-Q. Bi, Y.-J. Bai, H.-L. Zhu, Y.-X. Qi, C.-G. Wang, F.-D. Han and S.-J. Li, J. Phys. Chem. C, 2008, 112, 12134–12137 CAS.
- Y. Z. Jin, C. Gao, W. K. Hsu, Y. Zhu, A. Huczko, M. Bystrzejewski, M. Roe, C. Y. Lee, S. Acquah, H. Kroto and D. R. M. Walton, Carbon, 2005, 43, 1944–1953 CrossRef CAS PubMed.
- J. Yao, H. W. J. Liu, K.-Y. Chan, L. Zhang and N. Xu, Carbon, 2005, 43, 1709–1715 CrossRef CAS PubMed.
- Z. Wang, L. Yu, W. Zhang, Z. Zhu, G. He, Y. Chen and G. Hub, Phys. Lett. A, 2003, 307, 249–252 CrossRef CAS.
- X. Sun and Y. Li, J. Colloid Interface Sci., 2005, 291, 7–12 CrossRef CAS PubMed.
- A. Chen, Y. Yu, H. Lv, Y. Wang, S. Shen, Y. Hu, B. Li, Y. Zhang and J. Zhang, J. Mater. Chem. A, 2013, 1, 1045–1047 CAS.
- M. C. Rillig, M. Wagner, M. Salem, P. M. Antunes, C. George, H.-G. Ramke, M.-M. Titirici and M. Antonietti, Appl. Soil Ecol., 2010, 45, 238–242 CrossRef PubMed.
- R. F. Kaufmann, G. G. Eadie and C. R. Russell, Groundwater, 1976, 14, 296–308 CrossRef CAS PubMed.
- WHO (World Health Organization), Guidelines for Drinking-Water Quality, 4th edn, 2011 Search PubMed.
- M. Karadeniz, C. Kütahyali and M. Eral, Turk. J. Nucl. Sci., 2004, 29, 25 Search PubMed.
- Y. Xu, J. W. Zondlo, H. O. Finklea and A. Brennsteiner, Fuel Process. Technol., 2000, 68, 189–208 CrossRef CAS.
- D. D. Shao, Z. Q. Jiang, X. K. Wang, J. X. Li and Y. D. Meng, J. Phys. Chem. B, 2009, 113, 860–864 CrossRef CAS PubMed.
- A. Y. Romanchuk, A. S. Slesarev, S. N. Kalmykov, D. V. Kosynkinz and J. M. Tour, Phys. Chem. Chem. Phys., 2013, 15, 2321–2327 RSC.
- Z. X. Wu, P. A. Webley and D. Y. Zhao, Langmuir, 2010, 26, 10277–10286 CrossRef CAS PubMed.
- T. Missana, M. G. Gutierrez and U. Alonso, Appl. Clay Sci., 2004, 26, 137–150 CrossRef CAS PubMed.
- X. Zhang, J. Wang, R. Li, Q. Dai and L. Liu, New J. Chem., 2013, 37, 3914–3919 RSC.
- Z.-B. Zhang, Y.-H. Liu, X.-H. Cao and P. Liang, J. Radioanal. Nucl. Chem., 2013, 295, 1775–1782 CrossRef CAS PubMed.
- Z.-B. Zhang, W.-B. Nie, Q. Li, G.-X. Xiong, X.-H. Cao and Y.-H. Liu, J. Radioanal. Nucl. Chem., 2013, 298, 361–368 CrossRef CAS.
- M. Li, W. Li and S. Liu, J. Mater. Res., 2012, 27, 1117–1123 CrossRef CAS.
- L. Kong, X. Lu, X. Bian, W. Zhang and C. Wang, Langmuir, 2010, 26, 5985–5990 CrossRef CAS PubMed.
- X. Sun and Y. Li, Angew. Chem., Int. Ed., 2004, 43, 597–601 CrossRef PubMed.
- Q. Wang, H. Li, L. Chen and X. Huang, Carbon, 2001, 39, 2211–2214 CrossRef CAS.
- J. S. Challice, Bot. J. Linn. Soc., 1974, 69, 239–259 CrossRef PubMed.
- D. K. Kim and O. P. Zee, Chem. Pharm. Bull., 2000, 48, 1766–1767 CrossRef CAS.
- M. H. Khan, P. Warwick and N. Evans, Chemosphere, 2006, 63, 1165–1169 CrossRef CAS PubMed.
- A. Nahrstedt and H. Scheid, Phytochemistry, 1981, 20, 1309–1310 CrossRef CAS.
- M. N. Kopylovich, K. V. Luzyanin, M. Haukka, A. J. Pombeiro and V. Y. Kukushkin, Dalton Trans., 2008, 38, 5220–5224 RSC.
- R. Smicius, M. M. Burbuliene, V. Jakubkiene, E. Udrenaite and P. Vainilavicius, J. Heterocycl. Chem., 2007, 44, 279–284 CrossRef CAS.
- I. A. Mohammed, G. Sankar, M. Khairuddean and A. B. Mohamad, Molecules, 2010, 15, 3260–3269 CrossRef PubMed.
- Y. S. Mary, S. Suprabhan, H. T. Varghese and C. Y. Panicker, Orient. J. Chem., 2011, 27, 215–220 Search PubMed.
- P. T. Agrawal and S. P. Deshmukh, J. Curr. Chem. Pharm. Sci., 2012, 2, 157–160 CAS.
- İ. Uslu, H. Celikkan, O. Atakol and M. L. Aksu, Hacettepe J. Biol. Chem., 2008, 36, 117–122 Search PubMed.
- X. G. Li, X. L. Ma, J. Sun and M. R. Huang, Langmuir, 2009, 25, 675–1684 Search PubMed.
- X. Zhang, J. Wang, R. Li, Q. Liu, L. Li, J. Yu, M. Zhang and L. Liu, Environ. Sci. Pollut. Res. Int., 2013, 20, 8202–8209 CrossRef CAS PubMed.
- A. Krestou and D. Panias, Eur. J. Miner. Process. Environ. Prot., 2004, 4, 113–129 Search PubMed.
- H.-Y. Chi, X.-Y. Liu, H.-J. Ma, X.-J. Yang, M. Yu, J.-Y. Zhang, M. Wang, J.-Y. Li, H. Hoshina and N. Seko, Nucl. Sci. Tech., 2014, 25, 010302–010307 Search PubMed.
- P. Ilaiyaraja, A. K. S. Deb, K. Sivasubramanian, D. Ponraju and B. Venkatraman, J. Hazard. Mater., 2013, 250–251, 155–166 CrossRef CAS PubMed.
- J. Krishnan and T. Swaminathan, Lat. Am. Appl. Res., 2010, 40, 359–364 CAS.
- P. Chingombe, B. Saha and R. J. Wakeman, J. Colloid Interface Sci., 2006, 302, 408–416 CrossRef CAS PubMed.
- T. I. Kamins, Polycrystalline Silicon for Integrated Circuits and Displays, Kluwer Academic Publishers, Norwell, MA, 1998 Search PubMed.
- E. I. Unuabonah, K. O. Adebowale and B. I. Olu-Owolabi, J. Hazard. Mater., 2007, 144, 386–395 CrossRef CAS PubMed.
- T. Wu, M. Chen, L. Zhang, X. Xu, Y. Liu, J. Yan, W. Wang and J. Gao, J. Mater. Chem. A, 2013, 1, 7612–7621 CAS.
- S. M. Solberg and C. C. Landry, J. Phys. Chem. B, 2006, 110, 15261–15268 CrossRef CAS PubMed.
- Y. S. Ho, C. T. Huang and H. W. Huang, Process Biochem., 2002, 37, 1421–1430 CrossRef CAS.
Footnote |
| † Electronic supplementary information (ESI) available: Details of sections A1, A2 and Fig. S1–S8. See DOI: 10.1039/c4ra06890d |
| This journal is © The Royal Society of Chemistry 2014 |