S. R. Popuria,
A. J. M. Scotta,
R. A. Downiea,
M. A. Halla,
E. Suardb,
R. Decourtc,
M. Polletc and
J.-W. G. Bos*a
aInstitute of Chemical Sciences and Centre for Advanced Energy Storage and Recovery, School of Engineering and Physical Sciences, Heriot-Watt University, Edinburgh, EH14 4AS, UK. E-mail: j.w.g.bos@hw.ac.uk
bInstitut Laue-Langevin, Grenoble, F-38000, France
cCNRS, Université de Bordeaux, ICMCB, 87 avenue du Dr. A. Schweitzer, Pessac F-33608, France
First published on 25th July 2014
The introduction of A-site vacancies in SrTiO3 results in a glass-like thermal conductivity while Nb substituted samples maintain good electrical conductivity. This unexpected result brings SrTiO3 one step closer to being a high-performing phonon-glass electron-crystal thermoelectric material.
![]() | ||
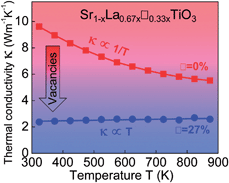
Fig. 1 Temperature dependence of the thermal conductivity (κ) for the Sr1−xLa0.67x□0.33xTiO3 series (literature data for SrTiO3 (diamonds) is included for comparison).6 |
The temperature dependence of κ is given in Fig. 1, while the measured thermal diffusivity (α) and heat capacity (Cp) data are given in Fig. S2.† The κ(T) is rapidly suppressed with increasing vacancy concentration, and becomes almost temperature independent for x = 0.8 (27% A-site vacancies). An impressive overall reduction of 80% at 323 K and 60% at 873 K is observed. It is well established that a number of phonon-scattering mechanisms contribute to the reduction of κlat. These include point-defect, phonon–phonon and interface scattering.12 In crystalline solids, boundaries and point defects limit the thermal transport at low temperatures, while phonon–phonon Umklapp scattering dominates above the Debye temperature (θD). This leads to the characteristic 1/T dependence at high-temperatures that is evident for x = 0 (Fig. 1), and for the A- and B-site doped SrTiO3 compositions in the literature.5,8 The observation of an almost temperature independent κ(T) for x = 0.8 is therefore of great interest. There is some precedent for this behaviour in perovskites, including in relaxor ferroelectrics and in segregated mixtures of Nd0.67TiO3 and Nd0.5Li0.5TiO3.13 A linear fit yields a positive slope (3.9(8) × 10−4 W m K−2), which is characteristic of a glass with a constant phonon mean free path (lph).12 An estimate of lph (ignoring wavelength and frequency dependence) can be obtained from κlat = 1/3Cpvlph where v is the velocity of sound which can be obtained from θD = (ħv/kB)(6π2N)1/3, where N is the number of atoms per unit volume. Taking θD = 500 K,14 results in a lph that decreases from 30.4 Å for x = 0 to 6.8 Å for x = 0.8. This reduction agrees with the emergence of a glassy state in which lph is expected to be of the order of the inter-atomic spacing (c.f. lph ≈ 7 Å for a variety of SiO2 glasses calculated using the same model).15
In order to assess the impact of A-site vacancies on the power factor a Nb substituted Sr1−xLa0.67x□0.33xTi0.8Nb0.2O3−δ series was prepared. The temperature dependence of S and the electrical resistivity (ρ = 1/σ) are given in Fig. S3.† The S(T) remain linear but are reduced to S300 K = −25 μV K−1 and S825 K = −80 μV K−1 for x = 0.4 (13% □) and 0.8 (27% □). The resistivity for x = 0 has a metallic temperature dependence with ρ300 K = 1.1 mΩ cm and ρ825 K = 3.6 mΩ cm. The x = 0.4 and 0.8 samples have similar resistivities (e.g. ρ825 K ∼ 4 mΩ cm) but show a transition from semiconducting to metallic behaviour at 650–700 K. The presence of the semiconducting to metallic transition suggests that the A-site vacancies result in an additional activation barrier which does not affect the high-temperature transport. The introduction of vacancies therefore results in a decrease in S and the emergence of a semiconductor metal transition, while similar resistivities are observed. This results in reduced power factors S2/ρ = 0.2 mW m−1 K−2 at 825 K for x = 0.4 and x = 0.8 (compared to 0.6 mW m−1 K−2 for x = 0).
Interestingly samples with x = 0.2 (7% □) were consistently found to have a low ρ, leading to large power factors S2/ρ = 1 mW m−1 K−2. For this reason, these compositions were optimised by variation of the Nb content. This yielded the Sr0.80La0.13□0.07Ti1−yNbyO3−δ series (0 ≤ y ≤ 0.2) whose properties are summarised in Fig. 2. The ρ(T) curves for y ≥ 0.05 have a metallic temperature dependence with ρ300 K ≈ 0.5 mΩ cm and ρ1000 K = 2.5–4 mΩ cm, while the y = 0 sample is semiconducting. The S(T) are linear and range from −50 ≤ S300 K ≤ −75 μV K−1 to −140 ≤ S1000 K ≤ −200 μV K−1. This results in large S2/ρ values up to ∼1.3 mW m−1 K−2 for y = 0.05. Measurement of κ(T) reveals a conventional 1/T dependence, in keeping with the results presented in Fig. 1. The lattice contribution dominates κ(T) and decreases from 5.5 W m−1 K−1 (323 K) to 2.5 W m−1 K−1 (1000 K). Calculation of the figure of merit leads to a maximum ZT ≈ 0.3 at 1000 K for y = 0.05, which is comparable to the best reported values for non A-site deficient SrTi1−yNbyO3 and La1−xSrxTiO3 based compositions.4,5
Neutron powder diffraction was used to confirm the A-site deficiency, and to investigate the oxygen stoichiometry of the best performing sample (Tables S2 and S3, and Fig. S4†). The refined composition was found to be Sr0.798(3)La0.130(3)Ti0.95Nb0.05O2.91(3), which confirms that the A-site vacancy is maintained under reducing conditions, and highlights the presence of ∼3% oxygen vacancies. The sub-stoichiometry in the oxygen sublattice reduces the average oxidation state of the transition metal cations (from +4 to +3.83), i.e. increases the electron concentration (from nominally 0.05 to 0.23 e− per transition metal). This interplay between oxygen stoichiometry and Nb content is also evident from Fig. 2a–c that reveals only modest changes in electronic transport for y ≥ 0.05, suggesting that y and δ compensate to maintain similar carrier concentrations.
The most striking feature of the data presented is that κ(T) changes from being characteristic of a well ordered solid to that of a glass. This can be achieved in a highly controllable fashion by introducing vacancies on the perovskite A-site. Fig. 3 shows a phase diagram that illustrates the vacancy dependence of the thermal conductivity for the samples presented in this manuscript. This shows that the conducting x = 0.2 sample (Fig. 2d) fits in well with the trends established by the oxygen stoichiometric samples presented in Fig. 1. From the literature it is known that the vacancies are initially randomly distributed (x ≤ 0.3) and subsequently long-range order in vacancy rich layers within the perovskite structure (x ≥ 0.83).11 The observed κ = 2.5 W m−1 K−1 approaches Cahill et al.'s minimum thermal conductivity for SrTiO3, which was estimated to be 1.4 W m−1 K−1 at 300 K and 1.8 W m−1 K−1 at 1000 K.16 The introduction of mixtures of Sr, La and vacancies will result in significant mass fluctuations and microstrain, which are effective disruptors of lattice vibrations. For alloying on a single crystallographic site the phonon relaxation time is given by:17
![]() | ||
Fig. 3 Vacancy concentration dependence of the lattice thermal conductivity at 323 and 873 K for the investigated A-site deficient SrTiO3 samples. The calculated minimum thermal conductivity for SrTiO3 using Cahill et al.'s model is also shown.16 The colour gradation indicates the gradual transition from crystalline to glass-like behaviour. |
The glass-like thermal conductivity in relaxor ferroelectrics and Nd0.67−xLi3xTiO3 has been linked to phase segregation,13 but there is no evidence for this for our compositions (Fig. S1† and ref. 11). Another possible explanation is that the vacancies result in a low energy “rattling” vibration mode that dissipates heat, leading to a glassy thermal conductivity in a crystalline material.17 For the A-site deficient perovskites the formation of A–O–□ linkages could lead to soft A–O bonds, and the emergence of a rattling mode and phonon-glass state. The introduction of vacancies in SrTiO3 results in a reduction of S. This decreases S2/ρ, yielding an estimated ZT = 0.07 at 825 K for samples with 27% vacancies. If power factors of 1–2 mW m−1 K−2 can be maintained ZT = 0.3–0.6 is achievable. This would be a significant improvement over the current state-of-the-art. The similar ρ values compared to samples without vacancies suggest that there is scope for further optimisation. The power factors ≤1.3 mW m−1 K−2 for samples with 7% vacancies are high for polycrystalline samples, and they are easier to carrier dope than the analogous SrTi1−yNbyO3−δ compositions. This is beneficial for large-scale preparation and for long-term stability under operating conditions.
To conclude, we have demonstrated that A-site vacancies can be used to induce a glass-like thermal conductivity. This provides a promising route for further optimisation of the thermoelectric performance of SrTiO3 based thermoelectric materials.
Footnotes |
† Electronic supplementary information (ESI) available. See DOI: 10.1039/c4ra06871h |
‡ Polycrystalline Sr1−xLa0.67x□0.33xTiO3 (x = 0, 0.4 and 0.8) samples were prepared on a one gram scale by heating cold pressed pellets containing ground mixtures of SrCO3, La2O3 and TiO2 at 1200 °C for two times 12 hours, and at 1400 °C for 4 hours in air, with intermediate regrinding between steps. 1% excess SrCO3 was used for the x = 0.4 and x = 0.8 samples. The Nb doped samples were prepared using a similar procedure but all heating steps were done under 5% H2 in N2. Nb2O5 was used as starting material. The final heating step for the Sr1−xLa0.67x□0.33xTi0.8Nb0.2O3−δ and Sr0.80La0.13□0.07Ti1−yNbyO3−δ series was 1450 °C. All samples were oven cooled. Laboratory X-ray powder diffraction data were collected on a Bruker D8 Advance diffractometer with Cu Kα1 radiation. Neutron powder diffraction measurements were done on a three gram sample of Sr0.80La0.133□0.067Ti0.95Nb0.05O3−δ using the super-D2B instrument at the Intitut Laue Langevin, Grenoble, France. The wavelength λ = 1.594 Å and data were binned in 0.05° steps between 5–160°. Rietveld fits were performed using the GSAS/EXPGUI programmes.18 Seebeck and electrical resistivity data were collected using a Linseis LSR-3 instrument. Thermal diffusivity (α) and heat capacity (Cp) were measured using a Netzch LFA 457 and Perkin Elmer DSC 8500, respectively. The thermal conductivity was calculated using: κ = α(T)Cp(T)p, where p is the density. The lattice thermal conductivity was estimated using the Wiedemann–Franz law: κlat = κ − LσT, where L is the Lorenz number (2.44 × 10⁻⁸ V2 K−2). |
This journal is © The Royal Society of Chemistry 2014 |