Urine metabolomic study of primary dysmenorrhea patients during menstrual period using an ultra performance liquid chromatography coupled with quadrupole-time-of-flight mass spectrometry (UPLC-Q-TOF-MS)

Ling Fang, Na Dai, Lei Wang, Xiuxiu Zhang, Xinyu Liu, Yuming Wang and Yubo Li*
Tianjin State Key Laboratory of Modern Chinese Medicine, School of Traditional Chinese Materia Medica, Tianjin University of Traditional Chinese Medicine, 312 Anshan west Road, Tianjin 300193, China. E-mail: yuboli1@163.com

Received 9th July 2014 , Accepted 4th September 2014

First published on 5th September 2014


Abstract

Primary dysmenorrhea (PD) is a common gynecological disease that can seriously affect women's health, lives, and work. Numerous clinical data have shown that the majority of endometriosis and ovarian cancer patients have symptoms of dysmenorrhea. In this study, we established a method based on metabolomic profiling to investigate the differences in small molecule metabolites in urine samples between PD patients and healthy controls. All samples were measured by ultra performance liquid chromatography coupled with quadrupole-time-of-flight mass spectrometry and analyzed by multivariate statistical methods. Findings show that metabolomics is an effective tool for studying the pathogenesis of PD which could quickly determine the important substances involved in PD, which may be beneficial for the clinical diagnosis and treatment of this disease.

Introduction

Dysmenorrhea is a common gynecological disease that is characterized by periodical cramps and pain in the women's waist and lower abdomen during the premenstrual or menstrual period. Dysmenorrhea can be categorized as primary and secondary dysmenorrhea.1,2 Primary dysmenorrhea (PD) is characterized by normal ovulation cycles without pelvic pathology. Severe symptoms of dysmenorrhea may lead to pelvic abnormalities, such as endometriosis, thereby negatively affecting the daily lives of young women. PD has also become the main reason for work and school absenteeism among female adolescents.3,4 Therefore, further studies on the etiology of PD are essential. In the past, people were confined to the clinical efficacy of traditional Chinese medicine and basic pharmacology studies to detect the levels of PD caused by some known pain factors. According to the literature, possible important markers in the pathology of PD include prostaglandin (PG), vasopressin, oxytocin and glucocorticoid.5,6 Excess PGF causes spasmodic contractions of uterine smooth muscles, resulting in decreased blood flow to the uterus and uterine ischemia, which is a major cause of PD.7 PD is also caused by sex-hormone disorders accompanied with an increase in progesterone during the menstrual period.8 Therefore, new biomarkers for clinical diagnosis are necessary.

Metabolomics, a research method used to describe the dynamic changes in low-molecular-weight metabolites and is also a potential tool for the in-depth study of metabolic products, which can help in determining an organism's physiological and pathological states. The mechanisms and treatment of diseases are expounded by identifying the biomarkers and analyzing the metabolic pathway.9,10 Determining the metabolic differences between PD patients and healthy volunteers can aid in the discovery of biomarkers for the diagnosis of PD mainly based on physical pains during menstrual period which can then provide information for the development of new treatment methods. However, few studies on metabolic profiling or biomarkers of PD have been conducted.

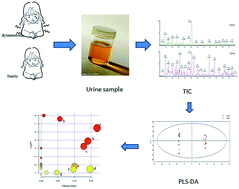
On this topics, given the hormone levels and other substances moment changes in the follicular and luteal phase in the body which changes smaller in menstrual period. Even the changes trend of some compounds in the luteal phase and menstrual period were the opposite. In the first 3 d of the menstrual cycle, changes of serum sex hormone levels in women which may caused primary dysmenorrhea were measured in clinical.11 So we took urine samples from dysmenorrhea patients and normal participants in the third day on their menstrual period that is easier to reflect the status of the body. Samples were analyzed using ultra performance liquid chromatography coupled with quadrupole-time-of- flight mass spectrometry (UPLC-Q-TOF-MS). Multivariate statistical analysis software SIMCA-P12.0 (Umetrics, Sweden), principal component analysis (PCA), partial least squares discriminant analysis (PLS-DA), and other methods were used in this study. The patterns of changes in small molecule metabolites and ingredients in the urine samples between PD patients and normal volunteers were also analyzed. This study aimed to provide a basis for the clinical diagnosis and treatment of PD.

Materials and methods

Study subjects and design

This study was reviewed and approved by Tianjin University of Traditional Chinese Medicine. Prior to sample collection, 36 patients with a diagnosis of PD and 27 healthy volunteers were recruited to investigate the metabolite variations during the menstrual period. Each volunteer provided written answers to a detailed questionnaire involving age, weight, height, history of menstrual cramps, family history, and dysmenorrhea integral list.

The selection criteria for PD patients were in accordance with the diagnostic criteria which established by the People's Republic of China Ministry of Health Pharmaceutical Council “Chinese medicine treatment of dysmenorrhea clinical research guidelines,”12 and National Higher School Teaching Materials “Obstetrics and Gynecology” Seventh Edition.13 (ESI 1)

Biofluid collection

Urine samples were collected in the third day on the menstrual period in the morning. Volunteers collected their urine samples in urine cups at the school dormitory, and immediately delivered samples to the laboratory. After the samples were collected, the volume of each urine sample was recorded and labelled. Healthy volunteers and primary dysmenorrhea patients were expressed as Z and T, respectively. Urine samples were immediately transferred into centrifuge tubes, in which 1% sodium azide was also added. All samples were centrifuged at 3000 g in 4 °C for 15 min. The supernatant was stored at −80 °C until analysis.

UPLC-Q-TOF-MS analysis

UPLC analysis was performed in a Water ACQUITY UPLC system (Waters Corporation, Milford, USA). The supernatant (5 μL) was injected into an ACQUITY UPLC BEH C18 (2.1 mm × 100 mm, 1.8 μm, Waters Corporation, Milford, USA). The column temperature was set at 45 °C, and the flow rate was 0.3 mL min−1. The gradient system consisted of 0.1% formic acid in water in mobile phase A and 0.1% formic acid in acetonitrile in mobile phase B (0–8.5 min, A 99–75%; 8.5–11 min, A 75–50%; 11–13 min, A 50–10%; 13–15 min, A 10–1%; 15–17 min, A 1%; 17–18.5 min, A 1–99%; and 18.5–20 min, A 99%). Eight samples were selected as the “quality control” (QC) from each group. The QC samples were analyzed every 6 h for one time, and used in a stability test of the instrument to ensure that the entire analytical procedure was run in the same conditions.

MS was performed on a Waters Micromass Q-TOF micro Synapt High Definition Mass Spectrometer (Waters, Milford, USA), which was equipped with acquisition mode of MSE and electrospray ionization (ESI) in the positive mode. The analytical parameters of MS were as follows: capillary voltage of 3.0 kV, and drying gas temperature of 325 °C, the drying gas flow of 10 mL min−1 and desolvation gas flow of 600 L h−1, source temperature of 120 °C, desolvation temperature of 350 °C, and cone gas flow of 50 L h−1.

Sample preparation

Before analysis, urine samples were thawed in room temperature and centrifuged at 10[thin space (1/6-em)]000g for 10 min. The supernatant liquid (1 mL) was added to 1 mL of ultrapure water. The mixture was vortexed for 1 min and centrifuged at 13[thin space (1/6-em)]000g for 15 min at 4 °C to obtain the supernatant for analysis.

Data processing

The data of urine mass acquired were processed by MarkerLynx™ application manager software version 4.1 (Waters, Milford, USA). The intensity of each ion was normalized to the total ion count to generate a data matrix that comprised retention time, m/z value, and normalized peak area. The parameters on Markerlynx were set as follows: mass tolerance of 0.01 Da, retention time tolerance of 0.5 min, and noise elimination level of 6. Then the multivariate data matrix was exported into SIMCA P12.0 version software for PCA and PLS-DA analysis. “Unsupervised” data were analyzed by PCA, and “supervised” data were used in PLS-DA for analysis. PCA, a statistical method for the major contradictions in items, can parse main factors in the multivariate data and reflect the main features of items. While compressing data space, characteristics of the multivariate data were visually represented in a low-dimensional space. Data were further analyzed by PLS-DA to reflect the discrimination of metabolites between primary dysmenorrhea patients and healthy volunteers during the menstrual period.14,15 The established model was validated by cross validation and permutation tests. Evaluation of the PLS-DA model in urine samples with high R2Y and Q2. These parameters usually demonstrate the fitness and prediction of the model. The high values of R2X, R2Y, and Q2 and ratio of R2Y[thin space (1/6-em)]:[thin space (1/6-em)]Q2 closer to 1 indicate that the model was stable and reliable. S-plots were constructed to visualize the relationship between covariance and correlation factors following PLS-DA analysis. Variables and variable importance plot (VIP) were also used to select potential biomarkers. Student's t-test was used to determine the statistically significant differences in biomarkers (p < 0.05) between PD patients and healthy volunteers.

The spectra of MS/MS fragment ion analysis of metabolite peaks were submitted to the available biochemical databases, such as HMDB and MassBank. The potential biomarkers were subjected to construction, interaction, and pathway analyses using MetPA, a web-based tool for pathway analysis and metabolic visualization, KEGG, and METLIN.

Results

Demographic and clinical characteristics

For this study, we recruited 43 healthy females and 79 primary dysmenorrhea patients from 18 to 25 years old. Among these volunteers, we selected females with a regular menstrual cycle (26–32 d) and a dysmenorrhea integral above 8 points. (Table S1) A total of 36 PD patients and 27 healthy volunteers completed the entire study. The clinical characteristics of the volunteers are shown in Table 1.
Table 1 Clinical characteristics of 36 patients and 27 healthy controls
Characteristics PD patients (n = 36) Healthy (n = 27)
Age mean (SD), years 20.28(2.19) 20.29(1.08)
College education, n (%) 36(100) 27(100)
The history of menstrual cramps (SD), years 5.17(2.31)
Dysmenorrhea integral (SD) 11.81(4.01)
Menstrual cycle length mean (SD),days 28.29(5.17) 29.67(1.49)
Family history, n (%) 17(47.2) 3(11)


Metabolic profiling and data processing

Typical base peak intensity (BPI) chromatograms of samples obtained from healthy controls and PD patients during the menstrual period are displayed in Fig. 1.
image file: c4ra06860b-f1.tif
Fig. 1 Typical BPI chromatogram of urine (A) control and (B) PD patient at positive electrospray ionization (ESI) mode. Note: “Z”: healthy volunteers; “T”: primary dysmenorrhea patients.

Multivariate statistical analysis of the complex data obtained from the total ion current chromatograms was performed. PCA and PLS-DA patterns were used to visualize the differences. To show the reliability of the model, PLS-DA was used as an algorithm to differentiate PD patients and healthy controls with 100% sensitivity and specificity exceeding 95% (Fig. 2A). Evaluation of the PLS-DA model in urine samples with high R2Y and Q2 (Table S2). The Q2 and R2 of high value indicated the rationale of the model built in this study. What's more, the validated of cross validation and the permutation statistics of the PLS-DA assessment by R2 and Q2 intercepts were 0.648 and −0.241, respectively. Metabolites could be separated from the S-plots and loading plots between healthy controls and PD patients (Fig. 2B and C). Variables with VIP values higher than 1 were chosen as potential biomarkers. Endogenous metabolites significantly changed with a result of PD demonstrated in different patterns.


image file: c4ra06860b-f2.tif
Fig. 2 Result of multivariate statistical analysis. (A) PLS-DA model of UPLC-Q-TOF-MS data between PD patients and healthy controls in the menstrual cycles in positive mode. (B) Loading plot of PLS-DA model between PD patients and healthy controls. (C) S-plot of PLS-DA model between PD patients and healthy controls.

Identification of biomarkers

Combining the results of VIP value plot and S-plot, retention time and precise molecular mass were measured using UPLC-Q-TOF-MS analysis. The m/z value of the metabolites was also used to determine the possible molecular formula from the HMDB database. The five potential biomarkers were identified by authentic standards. And others were identified by comparing with the fragments that based on their molecular ion information and MS/MS data (the mass difference in ppm <5 and the difference of the identified metabolites with standards in RT < 10 s) (Table 2 and S3). Ions (tR = 12.18 min, m/z = 318.3010) were obtained as an example to demonstrate the identification of markers (Fig. S1). According to the method above, 13 endogenous metabolites were identified between healthy controls and PD patients (Table 2).
Table 2 Identified metabolites for the discrimination between PD patients and healthy controls in urine samples
No. RT Obsd [M + H]+ Calcd [M + H]+ Errora (ppm) compound Formula content changed p-Value Metabolic pathway
a PPM was the mass difference in ppm of theoretical and measured m/z of the compounds.b Confirmed by standard samples.c Identified by MS/MS information.d The ratio of primary dysmenorrhea and healthy volunteers.
1 0.85 120.0662 120.0661 0.83 Threonineb C4H9NO3 0.61 0.0029 Glycine, serine and threonine metabolism
2 0.76 147.1133 147.1134 −0.67 Lysineb C6H14N2O2 0.59 0.0218 Lysine biosynthesis and degradation
3 8.41 165.0559 165.0552 4.24 Phenylpyruvic acidc C9H8O3 0.67 0.0020 Phenylalanine metabolism
4 2.67 166.0872 166.0868 2.41 Phenylalanineb C9H11NO2 0.77 0.0055 Phenylalanine and tyrosine metabolism
5 4.43 167.0705 167.0708 −1.79 L-3-Phenyllactic acidc C9H10O3 0.72 0.0428 Phenylalanine metabolism
6 1.60 182.0811 182.0817 −3.30 Tyrosineb C9H11NO3 0.53 0.0036 Tyrosine metabolism
7 3.81 201.0405 201.0399 2.98 Maleylacetoacetic acidc C8H8O6     Tyrosine metabolism
8 9.71 271.1694 271.1698 −1.47 Estronec C18H22O2 2.09 0.0138 Not available
9 11.60 291.1311 291.1305 2.06 Argininosuccinic acidc C10H18N4O6 0.79 0.0441 Alanine, aspartate and glutamate metabolismArginine and proline metabolism
10 12.72 302.3058 302.3059 0.33 Sphinganinec C18H39NO2 1.46 0.0376 Sphingolipid metabolism
11 12.18 318.3010 318.3008 −0.63 Phytosphingosinec C18H39NO3 0.60 0.0144 Sphingolipid metabolism
12 12.35 331.2267 331.2273 −1.81 17-Hydroxyprogesteroneb C21H30O3 0.55 0.0229 Steroid hormone biosynthesis
13 10.46 365.2322 365.2328 −1.64 Dihydrocortisolc C21H32O5 1.71 0.0337 Steroid hormone biosynthesis


Metabolic pathway

The potential metabolic pathway was analyzed by MetPA. The disturbed pathway included phenylalanine metabolism (a), sphingolipid metabolism (b), steroid hormone biosynthesis (c), lysine biosynthesis and degradation (d and e), glycine, serine, and threonine metabolism (f),tyrosine metabolism (g), alanine, aspartate, and glutamate metabolism (h) (Fig. 3).
image file: c4ra06860b-f3.tif
Fig. 3 Disturbed metabolic pathways in the PD group analyzed by MetPA Note: (a) Phenylalanine metabolism; (b) sphingolipid metabolism; (c) steroid hormone biosynthesis; (d) lysine degradation; (e) lysine biosynthesis; (f) glycine, serine and threonine metabolism; (g) tyrosine metabolism; (h) alanine, aspartate, and glutamate metabolism.

Discussion

This study was based on metabolomic profiling to delineate the differences in metabolites between PD patients and healthy women during the menstrual period. Results reveal that the levels of threonine, lysine, phenylpyruvic acid, phenylalanine, 3-phenyllactic acid, tyrosine, argininosuccinic acid, phytosphingosine, and 17-hydroxyprogesterone significantly decreased during the menstrual period in primary dysmenorrhea patients, whereas the levels of estrone, sphinganine, and dihydrocortisol increased. Maleylacetoacetic acid was found in primary dysmenorrhea patients but not in healthy controls.

By comparing PD patients with healthy controls, we found three types of endogenous substances. Hormones have important functions in primary dysmenorrhea. Results show that the 17-hydroxyprogesterone levels decreased, whereas the estrone levels and ratio of estrone/progesterone increased, which was consistent with previous reports.16 The degree of dysmenorrhea was associated with the levels of progesterone and estrogen, when the progesterone levels decreased, the contractility of the uterus was enhanced and pain increased, meanwhile, estrogen can promote uterine contractions with oxytocin-coordinated regulation of uterine movement. And it was also related to the ratio of estrogen/progesterone.17 The ovarian hormones primarily involved in menstrual regulation were estrogen and progesterone. This antagonism of estrogen and progesterone in the body can also affect the synthesis and release of oxytocin, vasopressin, endogenous opioid peptides, and other hormones, which indirectly cause dysmenorrhea. The accumulation of estrogen in ectopic lesions can cause breast congestion, which appears as premenstrual breast tenderness, and may lead to pelvic congestion, lower abdominal bulge, and endometriosis.18 Estrogen is responsible for the ability of the body to retain water and sodium, as well as the occurrence of local edema and dysmenorrhea.19 Meanwhile, insufficient progesterone, excess estrogen, and high estrogen/progesterone ratio may lead to ovarian cancer.20

Sphingolipid substances (phytosphingosine and sphinganine) are lipids that are the main components of biofilms. Sphinganine is a signal transduction effect factor of the nerve ligand–receptor interaction, which participates in the binding of PGE2 and PGF2 to the receptor during signal transduction. PGs are found in almost all body tissues and body fluids, and have important physiological functions in the menstrual cycle. The contents of sphinganine increased, that it is influenced to the content change of PGE2 and PGF, thereby causing dysmenorrhea.21 Sphingolipids are risk factors for endometrial cancer, polycystic ovary syndrome, and endometriosis.22

Threonine, lysine, tyrosine, and arginine are necessary for the body. Lysine combined with certain carriers and anti-inflammatory drugs can successfully treat premenstrual syndrome, menstruation-related migraine headaches, and abdominal cramps. Phenylalanine and tyrosine are precursors of catecholamines. Catecholamines include dopamine, norepinephrine, and epinephrine. Reduced dopamine levels can be associated with various anxiety disorders related to the premenstrual syndrome.23 Norepinephrine and dopamine can reduce the degrees of dysmenorrhea and associated symptoms of dysmenorrhea, and affect the secretion of hypothalamic gonadotropin-releasing hormone (GnRH). Norepinephrine can promote the release of GnRH. GnRH promotes the secretion of gonadotropin, which includes follicle-stimulating hormone (FSH) and luteinizing hormone (LH). FSH can secret of estradiol. The major physiological functions of LH in follicles is stimulating the theca cell to synthesize androgen, providing a substrate for estradiol synthesis.18 Increased levels of estradiol can indirectly cause dysmenorrhea.

Funding

This project was supported by The Research Programs of Application of Basic and Frontier Technology in Tianjin (13JCYBJC23900) and Tianjin University Undergraduates Teaching quality and teaching reform project (B07-1008).

Conclusion

This study investigated the differences between primary dysmenorrhea patients and healthy controls using metabolomic profiling, and identified the variations in endogenous substances during the menstrual period. Results indicate that amino acids, hormones, and sphingolipid substances affected PD. This study provides a basis for research on the clinical diagnosis and detection of indicators for primary dysmenorrhea.

References

  1. T. Harada, Yonago Acta Med., 2013, 56(4), 81–84 Search PubMed.
  2. C. Morrow and E. H. Naumburg, Primary Care, 2009, 36(1), 19–32 CrossRef PubMed.
  3. H. Zeev, Expert Opin. Pharmacother., 2012, 13(15), 2157–2170 CrossRef PubMed.
  4. K. O'Connell, A. R. Davis and C. Westhoff, J. Pediatr. Adolesc. Gynecol., 2006, 19(4), 285–289 CrossRef PubMed.
  5. R. Liedman, S. R. Hansson, D. Howe, S. Igidbashian, A. McLeod and R. J. Russell, Gynecol. Endocrinol., 2008, 24(9), 508–513 CrossRef CAS PubMed.
  6. P. Liu, J. Duan, P. Wang, D. Qian, J. Guo and E. Shang, Mol. BioSyst., 2013, 9(1), 77–87 RSC.
  7. P. L. Durham, C. V. Vause and F. Derosier, Headache, 2010, 50(5), 844–851 CrossRef PubMed.
  8. R. Liedman, S. R. Hansson and D. Howe, Gynecol. Endocrinol., 2008, 24(9), 508–513 CrossRef CAS PubMed.
  9. H. Li, Y. Jiang and F. C. He, Hereditas, 2008, 30(4), 389–399 CrossRef CAS.
  10. B. Cao, J. Y. A. and G. J. Wang, Chinese Bulletin of Life Sciences, 2010, 22(8), 761–768 Search PubMed.
  11. N. Dai, L. Fang and Y. B. Li, J. Evidence-Based Complementary Altern. Med., 2014, 2014, 876431 Search PubMed.
  12. People's Republic of China Ministry of Health Pharmaceutical Council, Chinese medicine treatment of dysmenorrhea clinical research guidelines. 1993, pp. 263–266 Search PubMed.
  13. J. Yue, Obstetrics and Gynecology, People's Health Publishing House, 7th edn, 2008, vol. 318 Search PubMed.
  14. X. Wang, H. Wang, A. Zhang, X. Lu, H. Sun and H. Dong, J. Proteome Res., 2012, 11(2), 1284–1301 CrossRef CAS PubMed.
  15. X. Wang, A. Zhang, P. Wang, H. Sun, G. Wu and W. Sun, Mol. Cell. Proteomics, 2013, 12(5), 1226–1238 CAS.
  16. M. Rani, U. Singh, G. G. Aqrawal, S. M. Natu, S. Kala, A. Ghidiyal and N. Srivastava, J. Altern Complement Med., 2013, 19(12), 925–929 CrossRef PubMed.
  17. F. Wang, Clinical study on primary dysmenorrhea patient' estradiol, progesterone and prostaglandin regulated by herbs-separated umbilical moxibustion, MHA, Thesis, Shandong University of Traditional Chinese Medicine, 2009.
  18. E. Pfeiffer, E. Graf, S. Gerstner and M. Metzler, Mol. Nutr. Food Res., 2006, 50(4–5), 385–389 CAS.
  19. Y. S. Fan, F. R. Miao, A. N. Liao and F. Xu, Acupunct. Res., 2013, 38(5), 353–356 Search PubMed.
  20. R. Kaaks, F. Berrino, T. Key, S. Rinaldi, L. Dossus and G. Secroeto, J. Natl. Cancer Inst., 2005, 97(10), 755–765 CrossRef CAS PubMed.
  21. X. J. Yu, The study of metabonomics of umbilical moxibustion with herbal medicine on primary dysmenorrheal syndrome, MHA, Thesis, Shandong University of Traditional Chinese Medicine, 2009.
  22. K. Pawel, A. Chabowski and J. Gorski, Lipids, 2013, 48(3), 245–250 CrossRef CAS PubMed.
  23. X. L. Yin, Research on the difference of metabonomics mechanism of treatment of primary dysmenorrheal with fumigating the navel, MHA, Thesis, Shandong University of Traditional Chinese Medicine, 2005.

Footnote

Electronic supplementary information (ESI) available. See DOI: 10.1039/c4ra06860b

This journal is © The Royal Society of Chemistry 2014
Click here to see how this site uses Cookies. View our privacy policy here.