Spectrofluorimetric and TLC-densitometric methods for a stability indicating assay of valacyclovir hydrochloride in the presence of its degradation product

Sayed M. Derayea, Islam M. Mostafa and Mahmoud A. Omar*
Anal. Chem. Dept., Faculty of Pharmacy, Minia University, Minia, Egypt. E-mail: momar71g@yahoo.com

Received 5th July 2014 , Accepted 28th August 2014

First published on 28th August 2014


Abstract

Two stability-indicating methods were developed and validated for determination of valacyclovir HCl (VAC) in the presence of its degradation product, acyclovir. The first was a TLC-densitometric method, in which chloroform[thin space (1/6-em)]:[thin space (1/6-em)]methanol[thin space (1/6-em)]:[thin space (1/6-em)]ammonia (50[thin space (1/6-em)]:[thin space (1/6-em)]14[thin space (1/6-em)]:[thin space (1/6-em)]2 v/v/v) was used as a mobile phase. Silica gel 60 F254 was used as a stationary phase and the chromatogram was scanned at 253 nm. Using this chromatographic system, VAC can be readily separated from its degradation product and gives a compact spot at an RF value of (0.55 ± 0.03). The peak area concentration plot is rectilinear over the range 20–300 ng per band. The second method represents the first attempt for spectrofluorimetric determination of VAC. The method was based on the reaction between VAC and 4-chloro-7-nitrobenzo-2-oxa-1,3-diazole (NBD-Cl) in an alkaline medium (pH 8.5) to form a highly fluorescent product that was measured at 500 nm after excitation at 465 nm. The fluorescence intensity concentration plot is rectilinear over the range 1–10 μg ml−1. The proposed methods were successfully applied for the determination of VAC in its commercial tablets with average percentage recovery of 100.13 ± 0.33 and 98.50 ± 1.75 for TLC-densitometric and spectrofluorimetric methods, respectively, without interference from common excipients. The results of the proposed methods were statistically analyzed and found to be in accordance with those given by a reported method. In addition the proposed methods were extended to a stability study of VAC, where the drug was exposed to acidic, alkaline, oxidative and photolytic degradation according to ICH guidelines.
1. Introduction

Valacyclovir hydrochloride (VAC) is L-valine 2-[(2-amino-1,6-dihydro-6-oxo-9H-purin-9yl)methoxy]ethyl ester hydrochloride (Fig. 1). After its oral administration, VAC is rapidly converted into acyclovir which has demonstrated antiviral activity, against herpes simplex virus type I (HSV-1), type 2 (HSV-II) and Varicella zoster virus.1 The oral bioavailability of acyclovir is higher after administration of VAC relative to acyclovir itself.2,3 The mechanism of action of acyclovir involves the highly selective inhibition of virus DNA replication, via enhanced uptake in virus-infected cells and phosphorylation by viral thymidine kinase.4,5 Few analytical methods have been reported for the determination of VAC. These methods include: spectrophotometric,6–8 chromatographic,9–22 capillary electrophoretic23 and electrochemical methods.24 To the present time there is no spectrofluorometric method reported for analysis of VAC. Accordingly we here present the first attempt for spectrofluorimetric method in addition to TLC-densitometry for the determination of VAC in pure form and pharmaceutical tablets. TLC-densitometric method is becoming a routine technique for analysis of drugs due to its low operating cost, high sample-throughput, and need for minimum sample clean-up. The major advantage of TLC-densitometric lies in several samples can be run simultaneously using a small quantity of mobile phase thus lowering analysis time and cost per analysis, Unlike HPLC, wherein substantial amounts of mobile phase and time are required for analysis of multiple samples.25 TLC-densitometric method has the advantages of being sensitive, cheap and one of the simplest chromatographic technique that does not need large precautions as in HPLC technique which should be taken to prevent several problems in HPLC such as plugging of the column and variation of retention time. Both proposed methods of analysis of the cited drug are able to determine the drug in pure form and pharmaceutical tablets without interference from tablet excipients. Furthermore, both methods were developed to be stability-indicating methods that can be used for determination of VAC in presence of its degradation products.
image file: c4ra06677d-f1.tif
Fig. 1 Chemical structure of valacyclovir HCl and acyclovir.

2. Experimental

2.1. Apparatus

Camag TLC scanner 3 S/N 130319 in the absorbance mode utilizing deuterium lamp as a source of radiation with Wincats software. Samples were applied with Camag micro-syringe 100 μl, using a Camag Linomat 5 autosampler, (Camag, Muttenz, Switzerland).

A Perkin Elmer LS 45 luminescence spectrometer (United Kingdom) equipped with 150 watt xenon arc lamp and 1 cm quartz cell. Slit width for both monochromators were set at 10 nm. The spectrometer is connected to a PC loaded with the FL Winlab™ software, Spectronic™ Genesys™ 2 PC. Ultraviolet/visible spectrophotometer (Milton Roy Co, USA) with matched 1 cm quartz cell and was connected to PC loaded with Winspec™ application software.

MLW type thermostatically controlled water bath (Memmert GmbH, Schwabach, Germany) was used for heating purposes.

2.2. Material and chemicals

VAC was obtained as a gift from (Hikma Pharma, Cairo, Egypt). Valtovir® tablets (Hikma Pharma, Cairo, EGYPT) labeled to contain 1110 mg VAC per tablet was purchased from local market. Acyclovir was obtained as a gift from GlaxoSmithKline (Cairo, Egypt). 4-chloro-7-nitrobenzo-2-oxa-1,3-diazole NBD-Cl (Sigma Chemical Co., St. Louis, USA) was freshly prepared as 0.1% w/v in methanol. Chloroform, hydrochloric acid, ammonia solution, hydrogen peroxide (30% v/v), sodium hydroxide, boric acid and methanol were purchased from El-Nasr Chemical Co. (Cairo, Egypt). All chemicals and reagents used were of analytical grade.

Aluminum plate precoated with silica gel 60 F254, (20 × 10 cm) with 250 μm thickness (Merck, Darmstadt, Germany).

2.3. Standard solution preparation

An accurately weighed amount (10 mg) of VAC was quantitatively transferred into a 100 ml calibrated flask, dissolved in 20 ml methanol, and then completed to volume with the same solvent to obtain a stock solution of 0.1 mg ml−1. The stock solution was further diluted with methanol to obtain working solutions in the concentration range of 5–75 μg ml−1 and 10–100 μg ml−1 for TLC-densitometric and spectrofluorimetric methods, respectively.

2.4. Preparation of sample solutions

An accurately weighed amount of finely powdered twenty tablets equivalent to 25 mg of VAC was transferred into a 50 ml volumetric flask. The powder was dissolved in 25 ml methanol, sonicated for 15 min, diluted to the mark with methanol and mixed well. The resulting solution was centrifuged at 3000 rpm for 5 min. Two ml of this solution was diluted to 10 ml with methanol.

2.5. General analytical procedure

2.5.1. For TLC-densitometric method. TLC-densitometric method was performed in aluminum plates (10 × 20 cm) coated with 0.2 mm layers of silica gel 60 F254. Standard or sample solutions were applied as 6.0 mm at bands at the concentration range of 20–300 ng per band to the plate at 10 mm from the bottom and 10 mm from the side edges of the plate. The band was dried with the aid of an online nitrogen gas. Linear ascending development with chloroform[thin space (1/6-em)]:[thin space (1/6-em)]methanol[thin space (1/6-em)]:[thin space (1/6-em)]ammonia (50[thin space (1/6-em)]:[thin space (1/6-em)]14[thin space (1/6-em)]:[thin space (1/6-em)]2 v/v/v) as a mobile phase was performed in a Camag twin-trough glass chamber previously saturated with mobile phase for 15 min at room temperature. After development, the plates were dried in a current of hot air using a hair-dryer. Densitometric scanning in reflectance mode at 253 nm was performed at 20 mm s−1 scanning speed and the slit dimension was kept at 6.0 × 0.30 μm. The TLC chromatograms were manipulated by WINCATS software.
2.5.2. For spectrofluorimetric method. One milliliter of the working standard or sample solution in the concentration range of 10–100 μg ml−1 was transferred into 10 ml test tubes, then 1.0 ml of borate buffer solution (pH 8.5) and 1.2 ml of NBD-Cl reagent (0.1% w/v) were added. The reaction was allowed to proceed at 70 °C in a water bath for 20 min. After cooling the test tubes in ice bath, 0.2 ml of conc. hydrochloric acid was added at the wall of the test tube and mixed well. Finally the contents of the test tube were quantitatively transferred into 10 ml calibrated flasks and completed to the mark with methanol. The fluorescence intensity of the resulting solutions was measured at 500 nm (λex, 465 nm). A blank experiment was performed similarly omitting the drug.

2.6. Procedures for stability indicating assay

2.6.1. Alkali induced degradation. Into 10 ml test tube, 1 ml of VAC solution (1 mg ml−1) was transferred and 1 ml of 0.05 M NaOH was added. The solution was left at room temperature for 2 hours. After the specified time, the solution was neutralized to pH 7 using 1 ml of 0.05 M HCl solution and completed to the volume with methanol.
2.6.2. Acid induced degradation. Into 10 ml volumetric flask, 5 ml of VAC solution (1 mg ml−1) was transferred and refluxed with 5 ml of 1 M HCl for 2 hours. After the specified time, the solution was neutralized to pH 7 using 1 M NaOH solution. The solution was transferred quantitatively into 50 ml volumetric flask and completed to the volume with methanol.

Oxidative induced degradation with hydrogen peroxide was carried out by transferring 1.0 ml of VAC solution working solution (1 mg ml−1) into 10 ml volumetric flask then 1 ml of hydrogen peroxide (30.0% v/v) was added. The solution was kept at room temperature for a period of 2 hours. The solution was heated in boiling water bath for 10 minutes to completely remove the excess of hydrogen peroxide. The volume was completed to 10 ml with methanol.

The photochemical stability of the drug was studied by exposing the stock solution (0.1 mg ml−1) to direct artificial day light for five days.

For TLC-densitometric method 6 ml of the above solution was diluted to 10 ml with methanol in volumetric flask then 4 μl was applied to TLC plate and the plate was developed and analyzed as described in “general analytical procedures”. For spectrofluorimetric, 1.0 ml of the above solution was used in the “general analytical procedures”.

3. Results and discussion

3.1. Method optimization for the TLC-densitometric measurements

TLC procedure was optimized with a view to develop a stability-indicating assay method. The pure forms of drug and its degradation product, acyclovir were spotted on TLC plates and run in different solvent systems. Initially, chloroform–methanol in varying ratios was tried. Chloroform–methanol (5[thin space (1/6-em)]:[thin space (1/6-em)]1.4 v/v) as a mobile phase gave good resolution with RF value of 0.56 ± 0.03 for VAC and 0.3 ± 0.03 for acyclovir unfortunately with tailing peaks. Addition of 0.2 ml ammonia to the above mobile phase gave compact spots for both drug and acyclovir. The final mobile phase consisted of chloroform[thin space (1/6-em)]:[thin space (1/6-em)]methanol[thin space (1/6-em)]:[thin space (1/6-em)]ammonia (5[thin space (1/6-em)]:[thin space (1/6-em)]1.4[thin space (1/6-em)]:[thin space (1/6-em)]0.2 v/v/v) which gave a sharp and symmetrical peaks. To obtain a well-defined spots the chamber was saturated with the mobile phase for 15 min at room temperature prior to the analysis.

3.2. Method optimization for the spectrofluorimetric measurements

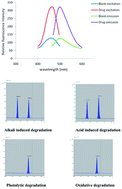
VAC contains a primary amino group that could react with NBD-Cl through a condensation reaction. This reaction was investigated in this study to develop the first spectrofluorimetric method for determination of VAC. The reaction product was colored yellow and exhibited highest fluorescence intensity at λem 500 nm after excitation at λex 465 nm, (Fig. 2). The experimental parameters affecting the development and stability of the reaction product were investigated and optimized. Each parameter was changed individually while the others were kept constant. These parameters include; pH, volume of the buffer, concentration of NBD-Cl, reaction time, temperature and diluting solvent.
image file: c4ra06677d-f2.tif
Fig. 2 Excitation and emission spectra of the reaction between NBD-Cl and VAC (4 μg ml−1).
3.2.1. Effect of pH. The effect of the solution pH on the reaction product formation was studied in the pH range of 7–10. The fluorescence intensity of the reaction product was highly dependent on pH. The highest intensity was obtained in the pH range of (8.3–8.8). Higher or lower solution pH resulted in a decrease on the fluorescence intensity. Therefore the optimum pH was 8.5 using borate buffer solutions (Fig. 3).
image file: c4ra06677d-f3.tif
Fig. 3 Effect of the pH on the condensation reaction of VAC (4 μg ml−1) and NBD-Cl.
3.2.2. Effect of the volume of the buffer. Several volumes (0–3 ml) of borate buffer of pH 8.5 were used for general assay procedure. The maximum fluorescence intensity was obtained when the buffer volume was in the range of 0.8–1.5 ml. Lower or higher volume showed marked decrease in the fluorescence intensity, Therefore the selected volume of borate buffer was 1 ml.
3.2.3. Effect of the volume of NBD-Cl solution. Different volumes of NBD-Cl (0.1% w/v) were used in performing the general analytical procedure. Increasing NBD-Cl volume produced a gradual increase in the fluorescence intensity until reaching a steady state at 1.0–1.5 ml of NBD-Cl. Further increase in the volume resulted in slight decrease in the fluorescence intensity. So, 1.2 ml NBD-Cl was chosen for subsequent works (Fig. 4).
image file: c4ra06677d-f4.tif
Fig. 4 Effect of the volume of NBD-Cl reagent on the fluorescence intensity of the reaction with VAC (4 μg ml−1).
3.2.4. Effect of heating time and temperature. The general analytical procedure was carried at different temperature or for different heating period. It was found that either increasing the temperature of the reaction mixture or heating for longer time produced a corresponding increase in the fluorescence intensity of the reaction product. However, it was noticed that heating at a relatively low temperature (70 °C) for a longer period (20 min) was better than heating at a higher temperature for a shorter period of time, regarding the reproducibility of the fluorescence intensities.
3.2.5. Effect of diluting solvent. In order to select the most appropriate solvent for dilution, different solvents were tested including; methanol, ethanol, acetonitrile, and acetone. Methanol was found to be a best diluting solvent as it gave highest fluorescence intensity, and therefore was selected as diluting solvent. Unfortunately the high reading obtained with methanol was accompanied with the presence of high fluorescence background. This was attributed to the hydrolysis of NBD-Cl to the corresponding hydroxy derivative, namely, 4-hydroxy-7-nitrobenzo-2-oxa-1,3-diazole (NBD-OH).26 The fluorescence of NBD-OH could be quenched by decreasing the pH of the reaction medium to less than one.27 Therefore acidification of the reaction mixture prior to dilution and measurement of the relative fluorescence intensity was necessary to effectively decrease the background fluorescence. In the same time, the fluorescence of the reaction product was not affected by acidification, thus the sensitivity was ultimately enhanced. The suitable amount of hydrochloric acid required for acidification was found to be 0.2 ml of the concentrated acid.

3.3. Stoichiometry and mechanism of the reaction

Job's method of continuous variation28 was employed for investigating the stoichiometry of the reaction. Equimolar solutions of both the drug and NBD-Cl reagent (1 × 10⁻³ M) were prepared. Then portions of mixture of master solutions of the drug and reagent were made up comprising different complementary proportions (0.2[thin space (1/6-em)]:[thin space (1/6-em)]2.8, 0.4[thin space (1/6-em)]:[thin space (1/6-em)]2.6, 0.5[thin space (1/6-em)]:[thin space (1/6-em)]2.5…2.6[thin space (1/6-em)]:[thin space (1/6-em)]0.4, 2.8[thin space (1/6-em)]:[thin space (1/6-em)]0.2). Results suggested that VAC reacts with NBD-Cl in the ratio 1[thin space (1/6-em)]:[thin space (1/6-em)]1 (Fig. 5). Based on this ratio the suggested mechanism of the condensation reaction with NBD-Cl was presented in (Fig. 6).
image file: c4ra06677d-f5.tif
Fig. 5 The stoichiometry of the reaction between NBD-Cl and VAC.

image file: c4ra06677d-f6.tif
Fig. 6 The suggested mechanism of the condensation reaction of VAC with NBD-Cl.

It should be noted that, the degradation product, acyclovir could not undergo the condensation reaction with NBD-Cl and this can be inferred from the absence of any fluorescence property due to the reaction. This may be attributed to tautomerism of the amino group in the guanine base making the proton of amino group acidic therefore no condensation reaction could occur with NBD-Cl.

3.4. Method validation

The proposed methods have been validated according to ICH guidelines.29 The investigated parameters include: linearity and range, sensitivity, precision, accuracy, recovery and robustness.

The International Conference on Harmonization (ICH) guideline entitled ‘stability testing of new drug substances and products’ requires the stress testing to be carried out to elucidate the inherent stability characteristics of the active substance.30 An ideal stability-indicating method is one that quantifies the drug and resolves its degradation products.

3.4.1. Linearity and range. The proposed methods showed a good linear correlation in concentration range of 20–300 ng per band (r2 = 0.9992) for densitometric method and 1–10 μg ml−1 (r2 = 0.9991) for spectrofluorimetric method. The high value of correlation coefficient assured the validity of the proposed methods (Table 1).
Table 1 Regression equation and validation parameters for the proposed TLC-densitometric and spectrofluorimetric methods for determination of VAC
Parameters TLC-densitometric method Spectrofluorimetric method
a Number of determination is 9 for TLC-densitometric method and 7 for spectrofluorimetric method.b At 95% confidence limit.
Linearity range 20–300 (ng per band) 1–10 (μg ml−1)
Correlation coefficient (r) 0.9996 0.9996
Determination coefficient (r2) 0.9992 0.9991
Intercepta ± SD 249.75 ± 24.31 104.03 ± 1.67
Confidence limit of interceptb 192.25 99.74
Slopeb ± SD 12.48 ± 0.14 22.2 ± 0.29
Confidence limit of slopeb 12.16 21.45
LOD 6.42 (ng per band) 0.25 (μg ml−1)
LOQ 19.47 (ng per band) 0.75 (μg ml−1)


3.4.2. Accuracy. Standard addition method was applied to examine of the accuracy of the proposed methods. Known amounts of pure drug were added to a previously analyzed sample solution. The mixtures were re-analyzed by the proposed procedures in six replicates and the percentage recovery was calculated. The calculated high percentage average recovery and low relative standard deviation indicate the suitable accuracy of the method (Table 2).
Table 2 Standard addition method for the recovery studies
TLC-densitometric method Spectrofluorimetric method
Concentration (ng per band) % Recoverya ± SD Concentration (μg ml−1) % Recoverya ± SD
Taken % Added   Taken % Added  
a The value is the average of six determinations.
80 0 99.56 ± 0.46 2 0 99.74 ± 1.29
80 50% 99.70 ± 0.21 2 50% 99.10 ± 0.99
80 100% 99.85 ± 0.11 2 100% 98.55 ± 0.69
80 150% 99.90 ± 0.12 2 150% 99.35 ± 0.45


3.4.3. Precision. The interday and intraday precisions31 were examined by analyzing six replicates of VAC solutions at three concentration levels (80, 120 and 300 ng per band for TLC-densitometric and 3, 4 and 6 μg ml−1 for spectrofluorimetric method) in seven successive days. The low value of RSD (less than 1.28%) indicates fairly the good, repeatability and reproducibility of the proposed method (Table 3).
Table 3 The intra- and inter-day precision for the determination of VAC by the proposed methods
Intra-day precision Inter-day precision
Amounta % Recoveryb ± % RSD Amounta % Recoveryb ± % RSD
a The amount is ng per band for TLC-method and μg ml−1 for the spectroflourimetric method.b The value is the average of six determinations.
TLC-densitometric method
80 99.89 ± 0.33 0.08 98.41 ± 0.29
120 98.60 ± 0.52 0.12 99.73 ± 0.26
300 99.45 ± 0.49 0.30 99.55 ± 0.39
 
Spectrofluorimetric method
3 99.07 ± 1.28 3 99.86 ± 1.22
4 101.2 ± 0.26 4 99.32 ± 0.45
6 100.8 ± 1.11 6 98.65 ± 0.93


3.4.4. Sensitivity. Sensitivity of the proposed method was evaluated by calculating limit of detection (LOD) and limit of quantification (LOQ) using the formula; “x = /S”, where x is LOD or LOQ, n is a numerical value equal to 3.3 or 10 for LOD or LOQ, respectively and σ is the standard deviation of intercept and S is the slope of calibration graph.30–32 The calculated LOD and LOQ values for TLC-densitometric were 6.4 and 19.5 ng per band, respectively and for spectrofluorimetric method were 0.25 and 0.75 μg ml−1 respectively. The low values of these parameters indicate the high sensitivity of the proposed method (Table 1).
3.4.5. Robustness. The robustness of an analytical procedure refers to its capability to remain unaffected by small and deliberate variation in method parameters and provides an indication of its reliability in routine analysis.

Robustness of TLC-densitometric method was performed by introducing small changes in the mobile phase composition, saturation time and wavelength, then examining their effects on the obtained results. Mobile phases having different composition of chloroform[thin space (1/6-em)]:[thin space (1/6-em)]methanol[thin space (1/6-em)]:[thin space (1/6-em)]ammonia (4.9[thin space (1/6-em)]:[thin space (1/6-em)]1.3[thin space (1/6-em)]:[thin space (1/6-em)]0.1 and 5.1[thin space (1/6-em)]:[thin space (1/6-em)]1.5[thin space (1/6-em)]:[thin space (1/6-em)]0.3, v/v/v) and different wavelengths (248 and 258 nm). Robustness for spectrofluorimetric method was performed by making small changes in general analytical procedure, such as NBD-Cl volume (±0.2 ml), solution pH (±0.2 unit), and volume of the buffer (±0.5 ml). The obtained results from small variation in any of these parameters did not significantly affect the results of both methods. Therefore the procedures of the proposed methods are considered robust.

3.5. Stability-indicating studies

VAC was exposed to different stress conditions including acid, alkali, oxidation and photo-degradations. After applying the degradation procedures, the proposed methods were applied for determination of the extent of degradation of the cited drug. Alkaline and Acidic induced hydrolysis resulted in the appearance of an additional peak at RF value of 0.3 ± 0.03 (Fig. 7a and b). The new peak appears before the parent drug peak which gives an indication that the degradation product is more hydrophilic and contains polar group. The degradant was identified as acyclovir through comparison between RF of the degradant and RF of the standard authentic acyclovir. About 45% of the drug was degraded in case of acidic degradation while 52% of the drug was degraded in case of alkaline degradation. On the other hand, the exposure to oxidation with 30% v/v hydrogen peroxide and photodegradation with direct sun light for five days did not produce any significant effect on the drug chromatograms and only the peak of VAC was observed at RF = 0.55 (Fig. 7c and d). This gives an indication about the stability of VAC against oxidation and photodegradation but its liability of for basic and acidic hydrolysis.
image file: c4ra06677d-f7.tif
Fig. 7 TLC chromatograms of VAC degradation. (a) Alkali induced degradation. (b) Acid induced degradation. (c) Photolytic degradation. (d) Oxidative degradation.

3.6. Application to tablets

The proposed methods were applied for determination of VAC in the commercially available tablets. The mean recoveries values were 100.13 ± 0.33 and 98.5 ± 1.75 for TLC-densitometric and spectrofluorimetric methods, respectively. The results of the proposed methods were statistically compared with that of the reference method8 regarding t- and F- tests at 95% confidence level. As shown in Table 4, there is no significant difference between the results of both proposed and reported method, as the calculated values is less than the tabulated one. This indicated that the proposed methods have good accuracy and precision.
Table 4 Analysis of containing 1110 mg of VAC using the proposed and reference methodsa,b
Method % Recovery ± SD t-value F-value
Proposed method Reference method
a Average of five determinations.b Tabulated values for t and F are 2.306 and 6.338 respectively.
TLC-densitometry 100.13 ± 0.33 99.44 ± 0.62 1.68 3.70
Spectroflourimetry 98.5 ± 1.75 99.44 ± 0.62 0.31 1.08


4. Conclusion

The proposed TLC-densitometric and spectrofluorimetric methods are accurate, sensitive and selective methods. They allow the determination of VAC in pure form and in the presence of its degradation product, as well as in pharmaceutical dosage form. So, it can be considered as a stability-indicating one. The satisfactory sensitivity and simplicity make the methods suitable for routine analysis of VAC in quality control laboratories.

References

  1. Martindale: the Complete Drug Reference, S. C. Sweetman (ed.), Pharmaceutical Press, London, 33rd edn, 1999, p. 643 Search PubMed.
  2. D. D. Phan, P. Chin-Hong, P. E. T. Lin, P. Anderle, W. Sadee and B. J. Guglielmo, Intra- and interindividual variabilities of valacyclovir oral bioavailability and effect of coadministration of an hPEPT1 inhibitor, Antimicrob. Agents Chemother., 2003, 47, 2351–2353 CrossRef CAS.
  3. A. E. Thomsen, M. S. Christensen, M. A. Bagger and B. Steffansen, Acyclovir prodrug for the intestinal di/tri-peptide transporter PEPT1: comparison of in vivo bioavailability in rats and transport in Caco-2 cells, Eur. J. Pharm. Sci., 2004, 23, 319–325 CrossRef CAS PubMed.
  4. J. J. O'Brien and D. M. Campoli-Richards, Acyclovir. an updated review of its antiviral activity, pharmacokinetic properties and therapeutic efficacy, Drugs, 1989, 37, 233–309 CrossRef PubMed.
  5. C. P. Landowski, D. Sun, D. R. Foster, S. S. Menon, J. L. Barnett, L. S. Welage, C. Ramachandran and G. L. Amidon, Gene expression in the human intestine and correlation with oral valacyclovir pharmacokinetic parameters, J. Pharmacol. Exp. Ther., 2003, 306, 778–786 CrossRef CAS PubMed.
  6. D. V. P. Reddy, B. M. Gurupadayya and Y. N. Manohara, Spectrophotometric determination of valacyclovir hydrochloride in bulk and pharmaceutical formulations, Asian J. Chem., 2007, 19, 2797–2800 CAS.
  7. G. S. Babu, I. S. Babu and N. K. Kumar, Spectrophotometric determination of valacyclovir in pharmaceutical formulation, Asian J. Chem., 2007, 19, 1642–1644 CAS.
  8. M. Ganesh, C. V. Narasimharao and A. S. Kumar, UV spectrophotometric method for the estimation of valacyclovir hcl in tablet dosage form, E–J. Chem., 2009, 6, 814–818 CrossRef CAS PubMed.
  9. M. L. Palacios, G. Demasi and A. T. Pizzorno, Validation of an HPLC method for the determination of valacyclovir in pharmaceutical dosage, J. Liq. Chromatogr. Relat. Technol., 2005, 28, 751–762 CrossRef CAS PubMed.
  10. P. N. Rao, K. R. Rajeswari and V. J. Rao, RP-HPLC estimation of valacyclovir in tablets, Asian J. Chem., 2006, 18, 2552–2556 CAS.
  11. R. Kanneti, R. Rajesh, J. A. Raj and P. A. Bhatt, An LC–MS–MS Method for the Simultaneous Quantitation of Acyclovir and Valacyclovir in Human Plasma, Chromatographia, 2009, 70, 407–414 CAS.
  12. J. J. Sasanya, A. M. M. Abd-Alla and A. G. Parker, Analysis of the antiviral drugs acyclovir and valacyclovir-hydrochloride in tsetse flies (Glossina pallidipes) using LC-MSMS, J. Chromatogr., B: Anal. Technol. Biomed. Life Sci., 2010, 878, 2384–2390 CrossRef CAS PubMed.
  13. C. Pham-Huy, F. Stathoulopoulou and P. Sandouk, Rapid determination of valaciclovir and acyclovir in human biological fluids by high-performance liquid chromatography using isocratic elution, J. Chromatogr. B: Biomed. Sci. Appl., 1999, 732, 47–53 CrossRef CAS.
  14. A. Savaser, C. K. Ozkan and Y. I. Ozkan, Development and validation of an RP-HPLC method for the determination of valacyclovir in tablets and human serum and its application to drug dissolution studies, J. Liq. Chromatogr. Relat. Technol., 2003, 26, 1755–1767 CrossRef CAS PubMed.
  15. A. S. Jadhav, D. B. Pathare and M. S. Shingare, Development and validation of enantioselective high performance liquid chromatographic method for valacyclovir, an antiviral drug in drug substance, J. Pharm. Biomed. Anal., 2007, 43, 1568–1572 CrossRef CAS PubMed.
  16. K. Maria, G. Evagelos, G. Sofia, K. Michael and P. Irene, Selective and rapid liquid chromatography/negative-ion electrospray ionization mass spectrometry method for the quantification of valacyclovir and its metabolite in human plasma, J. Chromatogr. B., 2008, 864, 78–86 CrossRef PubMed.
  17. Y. Manish, U. Vivek, S. Puran, G. Sailendra and S. S. Pranav, Stability evaluation and sensitive determination of antiviral drug, valacyclovir and its metabolite acyclovir in human plasma by a rapid liquid chromatography-tandem mass spectrometry method, J. Chromatogr. B: Anal. Technol. Biomed. Life Sci., 2009, 877, 680–688 CrossRef PubMed.
  18. P. V. M. K. Gowtham, C. Jothimanivannan, C. H. Arjun, M. Jambulingam, S. Ananda Thangadurai and D. Kamalakannan, Accelerated Stability Studies on Valacyclovir Hydrochloride by RP-HPLC, Int. J. Pharm., Chem. Biol. Sci., 2013, 2, 110–117 Search PubMed.
  19. G. S. Holkar, M. D. Rokade, R. R. Yadav and V. N. Daphal, Determination of Assay and Peak Purity Evaluation of Acyclovir and Valacyclovir by RP-HPLC Method, Int. J. Theor. Appl. Sci., 2012, 4, 56–65 CAS.
  20. S. Yasmeen, K. A. Nanda and K. P. Safia, Development and Validation of Stability Indicating RP-HPLC Method for Estimation of Valacyclovir in Pharmaceutical Dosage Forms, Int. J. Phar. Clin. Res., 2013, 5, 7–12 Search PubMed.
  21. B. Jahnavi and G. Ashok, Method Development and Validation of Valacyclovir Hydrochloride Assay by Rp-Hplc, in Pharmaceutical Dosage Form, 2009, vol. 1, pp. 16–26 Search PubMed.
  22. K. R. Srinivasa and M. Sunil, Stability-indicating liquid chromatographic method for valacyclovir, Int. J. ChemTech Res., 2009, 1, 702–708 Search PubMed.
  23. K. M. Al Azzam, B. Saad, A. Makahleah, H. Y. Aboul-Enein and A. A. Elbashir, Assay and stability-indicating micellar electrokinetic chromatography method for the simultaneous determination of valacyclovir, acyclovir and their major impurity guanine in pharmaceutical formulations, Biomed. Chromatogr., 2010, 24, 535–543 CAS.
  24. B. Uslu, S. A. Özkan and Z. Şentürk, Electrooxidation of the antiviral drug valacyclovir and its square-wave and differential pulse voltammetric determination in pharmaceuticals and human biological fluids, Anal. Chim. Acta, 2006, 555, 341–347 CrossRef CAS PubMed.
  25. M. P. Shubhangi and R. D. Sunil, Validated High-Performance Thin-Layer Chromatographic Method for Quantitation of Fluvoxamine in the Presence of Degradation Products Formed under ICH Recommended Stress Conditions, J. Planar Chromatogr.--Mod. TLC, 2012, 25, 338–343 CrossRef.
  26. H. Miyano, T. Toyo'oka and K. Imai, Further studies on the reaction of amines and proteins with 4-fluoro-7-nitrobenzo-2-oxa-1,3-diazole, Anal. Chim. Acta, 1985, 170, 81–87 CrossRef CAS.
  27. K. Imai, T. Toyo'oka and H. Miyano, Fluorigenic reagents for primary and secondary amines and thiols in high performance liquid chromatography: a review, Analyst, 1984, 109, 1365–1373 RSC.
  28. P. Job, Advanced Physicochemical Experiments, Oliner and Boyed, Edinburgh, 2nd edn, 1964, p. 54 Search PubMed; P. Job, Ann. Chem., 1936, 16, 97 Search PubMed.
  29. ICH Harmonized Tripartite Guideline Q2 (R1), Validation of analytical procedures: text and methodology, Current step 4 version, 2005.
  30. ICH, Q2B Validation of Analytical Procedure: Methodology International Conference on Harmonization, Geneva, March 1996 Search PubMed.
  31. The United States Pharmacopoeia XXV and NF XX, American Pharmaceutical Associtation, Washington, DC, 2002 Search PubMed.
  32. ICH Harmonized Tripartite Guideline, Topic Q2A: Text on validation of analytical procedure, 1994.

This journal is © The Royal Society of Chemistry 2014
Click here to see how this site uses Cookies. View our privacy policy here.