Mesoporous silica-coated luminescent Eu3+ doped GdVO4 nanoparticles for multimodal imaging and drug delivery

Taeho Kimab, Nohyun Leec, Yong Il Parkab, Jangwon Kimab, Jaeyun Kimd, Eun Yeol Leee, Minyoung Yie, Bong-Geun Kimf, Taeghwan Hyeonab, Taekyung Yu*e and Hyon Bin Na*f
aCenter for Nanoparticle Research, Institute for Basic Science (IBS), Seoul 151-742, Korea
bSchool of Chemical and Biological Engineering, Seoul National University, Seoul 151-742, Korea
cSchool of Advanced Materials Engineering, Kookmin University, Seoul 136-702, Korea
dSchool of Chemical Engineering, Sungkyunkwan University, Suwon 440-746, Korea
eDepartment of Chemical Engineering, Kyung Hee University, Yongin, 446-701, Korea
fDepartment of Chemical Engineering, Myongji University, Yongin, 449-728, Korea. E-mail: tkyu@khu.ac.kr; hyonbin@mju.ac.kr

Received 4th July 2014 , Accepted 12th September 2014

First published on 12th September 2014


Abstract

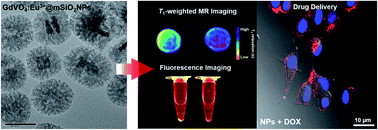
We describe a simple method for synthesizing mesoporous silica-coated luminescent europium-doped gadolinium vanadate (GdVO4:Eu3+@mSiO2) nanoparticles. Their biomedical applications as a potential imaging nanoprobe for both fluorescence imaging and magnetic resonance imaging (MRI) and as a simultaneous anti-cancer drug delivery vehicle are also discussed. Eu3+ doped GdVO4 nanoparticles exhibit strong red photoluminescence and the Gd3+ in GdVO4 can be used as a T1 contrast agent for MRI. T1-weighted MR contrast enhancement as well as sustained intracellular drug delivery can be achieved by the mesoporous silica layer coating onto a single nanoparticle. Enhanced T1 MR contrast was proven by relaxometric studies on water access to the paramagnetic core. GdVO4:Eu3+@mSiO2 nanoparticles as a new type of theragnostic (imaging and treatment) agent can provide new opportunities in a cancer treatment.

1. Introduction

The development of nanostructured materials for multimodal imaging is a rapidly growing research field. Particularly, nanostructured materials that possess both fluorescence and magnetic resonance imaging (MRI) properties have received wide recognition since they have both the high sensitivity of fluorescence phenomenon and the high spatial resolution of magnetic resonance imaging.1–5 Hybrid nanoparticles comprising a silica matrix which incorporates fluorescent dyes or QDs and magnetic nanoparticles, are one of the approaches in achieving multimodal capability.6–8 Another is to use nanoparticles having attributes of both fluorescence and magnetic resonance imaging.

Metal oxides containing alkaline, transition, or lanthanide metals, exhibit strong photoluminescence when they are doped with other lanthanide metal ions.9,10 The red-emitting europium(III) ion (Eu3+) serves as a highly efficient luminescent center,11,12 while gadolinium vanadate (GdVO4) has been reported as an excellent host matrix for photoluminescence applications.13 Therefore, Eu3+ doped GdVO4 nanoparticles (denoted by GdVO4:Eu3+ NPs) can be an efficient photoluminescent nanoprobe for fluorescence imaging. In addition, unpaired electrons of Gd3+ on the surface of GdVO4 NPs can be exploited to enhance contrast in magnetic resonance imaging. Using the photoluminescence of Eu3+ dopants and the T1-shortening effect of Gd3+ in the host matrix, GdVO4:Eu3+ NPs can be a possible imaging nanoprobe for both fluorescence and magnetic resonance imaging.14,15

The MRI technique mostly relies on water proton relaxation, which depends on magnetic fields, MRI pulse sequence, and the heterogeneous distribution of water in the organism.16 MRI signals can be enhanced by using two types of contrast agents, negative and positive.17,18 Superparamagnetic iron oxide nanoparticles which are widely used as negative T2 contrast agents provide a long-range disturbance in the magnetic field homogeneity and activate the dephasing of protons. Therefore, iron oxide nanoparticles accelerate spin–spin relaxation and shorten T2 relaxation times of their environments, and they produce a decreased signal intensity in T2-weighted MR imaging.19,20 On the other hand, Gd3+, one of the paramagnetic ions, enhances the spin–lattice relaxation and reduces the T1 relaxation times,21 which can generate positive enhancement of T1-weighted MR imaging without any distortion in the environment. This positive enhancement maximizes signal intensity with higher spatial resolution. For the T1 contrast mechanism, the accessibility of water molecules to the magnetic center is a key of designing highly efficient MRI contrast agents.22,23 Therefore, a mesoporous silica coating allows the easier water diffusion across mesoporous silica shell, leading to efficient relaxation of water in the vicinity of the nanoparticles.24–26

Furthermore, their structural and surface properties have made mesoporous silica nanostructure materials applicable in biomedicine, as controlled drug release vehicles in an anti-cancer chemotherapy. The large surface area and pore volume of mesoporous silica nanoparticles can ensure facile adsorption as well as high loading of various therapeutics.27–29 In several studies, treatment using drug-loaded mesoporous silica nanoparticles suppressed tumor growth in cancer xenograft mouse models, demonstrating the anti-cancer drug delivery capability of mesoporous silica nanoparticles.30,31

We synthesized a very uniform and dispersive mesoporous silica-coated NPs with a single GdVO4:Eu3+ core in their bodies (denoted by GdVO4:Eu3+@mSiO2 NPs) and demonstrated their capabilities to perform simultaneous T1 MR imaging, fluorescence imaging, and drug delivery. This study is to prove these newly developed GdVO4:Eu3+@mSiO2 NPs as one of the ideal candidates of multifunctional nanoparticles for cancer treatment.

2. Experimental

2.1. Materials

Gadolinium(III) acetate hydrate (99%), vanadyl sulfate hydrate (97%), oleic acid (90%), 3-aminopropyltriethoxysilane (APTES), xylene (98.5+%), gelatin, 3-[4,5-dimethylthialzol-2-yl]-2,5-diphenyltetrazolium bromide (MTT), polyoxyethylene(5) nonylphenyl ether (Igepal CO-520, containing 50 mol% hydrophilic group), doxorubicin, and 4′,6-diamidino-2-phenylindole dihydrochloride (DAPI) were purchased from Sigma-Aldrich. Europium(III) acetate hydrate (99.9%), oleylamine (approximate C18-content 80–90%), cetyltrimethylammonium bromide (CTAB), and tetraethylorthosilicate (TEOS) were purchased from Acros Organics. Methoxy poly(ethylene glycol) succinimidyl glutarate (mPEG-SG, MW = 5000) was purchased from Sunbio company. Ammonium hydroxide (28.0–30.0%), ethylacetate (99%), hydrochloric acid (35–37%), n-hexane (99%), ethanol (99%), chloroform (99%), and acetone (99%) were purchased from Samchun Chemicals. Dulbecco's modified eagle medium (DMEM), penicillin/streptomycin, fetal bovine serum (FBS), and phosphate-buffered saline (PBS) were purchased from GIBCO.

2.2. Preparation of GdVO4:Eu3+@mSiO2 NPs

2.2.1. Synthesis of GdVO4:Eu3+ NPs. A mixture of gadolinium(III) acetate and europium(III) acetate (total 1 mmol), 6 mmol of oleic acid, and 6 mmol of oleylamine were dissolved in 15 mL of xylene. After stirring for 2 h at room temperature, the solution was slowly heated to 90 °C. 1 mL of aqueous vanadyl sulfate solution (1 mM) was then added under vigorous stirring, and the resulting solution was aged at 90 °C for 3 h. 100 mL of ethanol was added to precipitate the nanoparticles that were retrieved by centrifugation. The resulting GdVO4:Eu3+ NPs were well dispersed in organic solvents such as n-hexane and chloroform.
2.2.2. Synthesis of GdVO4:Eu3+@mSiO2 NPs. GdVO4:Eu3+@mSiO2 NPs were synthesized by sol–gel reaction using tetraethylorthosilicate (TEOS) as a silica precursor in an aqueous solution containing CTAB and GdVO4:Eu3+ NPs. The GdVO4:Eu3+ NPs stabilized with oleic acid and oleylamine were dispersed in chloroform with a concentration of 4.8 mg Gd mL−1 (the concentration of Gd in the solution was measured by inductively coupled plasma atomic emission spectroscopy (ICP-AES)). GdVO4:Eu3+ NPs in chloroform was added to 5 mL of 0.55 M aqueous CTAB solution and the resulting mixture was stirred vigorously for 30 min. After the formation of oil-in-water micro-emulsions, the solution was heated to 60 °C and aged at the same temperature for 10 min under stirring to evaporate the chloroform. The aqueous solution of GdVO4:Eu3+/CTAB was added to a mixture of 45 mL of water and 0.3 mL of 2 M NaOH solution, and the mixture was heated to 70 °C under stirring, followed by the addition of 0.5 mL of TEOS and 3 mL of ethylacetate. During the reaction, 50 μL of APTES was added to introduce amine groups (–NH2) and the solution was stirred for 3 h. To extract CTAB from the nanoparticles, 20 μL of HCl was added to the dispersion (pH ∼ 2.3) and stirred for 1 h at 60 °C. Finally, CTAB extracted GdVO4:Eu3+@mSiO2 NPs were redispersed in 10 mL ethanol after washing with ethanol twice.
2.2.3. Surface modification of GdVO4:Eu3+@mSiO2 NPs with PEG. During the sol–gel reaction, amine groups were introduced to the surface of GdVO4:Eu3+@mSiO2 NPs by adding APTES to the solution. Surface modification of the GdVO4:Eu3+@mSiO2 NPs with PEG was carried out by the formation of covalent bonds between amine groups on the surface of GdVO4:Eu3+@mSiO2 NPs and the succinimidyl groups of mPEG-SG. 10 mL of an ethanol solution of the GdVO4:Eu3+@mSiO2 NPs was added to 20 mL of ethanol solution containing 50 mg of mPEG-SG. The mixture was stirred at 40 °C for 3 h. The GdVO4:Eu3+@mSiO2-PEG NPs were collected after removing unreacted mPEG-SG. For in vitro applications, the GdVO4:Eu3+@mSiO2-PEG NPs were dispersed in 0.7 mL of phosphate buffer solution (PBS, 10 mM, pH 7.4) and filtered using a 0.8 μm cellulose acetate filter.

2.3. Synthesis of GdVO4:Eu3+@dSiO2 NPs

Dense silica-coated GdVO4:Eu3+ NPs (GdVO4:Eu3+@dSiO2 NPs) were prepared as previously described along with some modifications.7 0.544 mmol of polyoxyethylene(5) nonylphenyl ether (0.23 g, Igepal CO-520) was dispersed in a scintillation tube containing 4.5 mL of cyclohexane by sonication. Next, 300 μL of GdVO4:Eu3+ NPs, dispersed in cyclohexane (15.6 mg Gd mL−1), was added to the tube. The mixture was vortexed until that became transparent. 50 μL of ammonium hydroxide was then added to form a reverse microemulsion. After 1 h, 50 μL of TEOS was added and the reaction continued for 24 h. The resulting GdVO4:Eu3+@dSiO2 NPs were precipitated by adding ethanol, and collected by centrifugation. Washing steps were repeated three times, and finally, the nanoparticles were redispersed in distilled water.

2.4. Characterizations

The transmission electron microscopy (TEM) analysis was conducted by JEOL JEM-2010 (JEOL Ltd. Japan). N2 adsorption/desorption isotherm was measured at 77 K using a Micromeritics ASAP 2000 gas adsorption analyzer (Norcross, USA) after the samples were degassed at 293 K under 10 μTorr for 5 h. The surface area and the total pore volume were evaluated using the BET (Brunauer–Emmett–Teller) model and the pore size was evaluated using the BJH (Barrett–Joyner–Halenda) model. DLS measurements were carried out using a zeta-potential & particle size analyzer (ELS-Z, Otsuka Electronics, JAPAN). Inductively coupled plasma atomic emission spectrometer (ICP-AES, Shimadzu ICPS-1000IV, JAPAN) was used for a quantitative analysis. Absorption and fluorescence spectra were obtained using the JASCO V-550 UV-Vis spectrophotometer, and JASCO FP-6500 spectrofluorometer (JASCO Inc., JAPAN), respectively. The confocal laser scanning microscopy data were obtained using LSM 510 (Carl Zeiss, Germany). In vitro fluorescence images were obtained using the fluorescence imaging system (Kodak IS4000MM pro, USA) and MR images were obtained using a 1.5 T MR scanner (GE Sigma Excite, USA).

2.5. Relaxivity measurements

Relaxivity measurements were performed on 1.5 T MR scanner (GE Sigma Excite, USA). The samples were diluted to concentrations of 0.52, 0.26, 0.13, 0.06, 0 mM Gd by adding deionized water and the resulting solutions were transferred to a 200 μL-well plastic microtiter plate. T1 values were obtained from the IR-FSE sequence with 30 multiple values of TIs (TR/TE/TI = 4400 ms/13 ms/24–4000 ms). T1 and T2 relaxation times were calculated by fitting the signal intensities with increasing TEs or TIs to a mono-exponential function using a non-linear least squares fit of the Levenberg–Marquardt algorithm. T1 and T2 values were averaged over the region of interest and plotted as 1/T1 or 1/T2 vs. the concentration of Gd. The slopes of these lines provide the molar relaxivities, r1 and r2, respectively.

2.6. In vitro cellular experiments

2.6.1. Cell viability. Human breast cancer cell lines, MCF-7 cells and SKBR-3 cells were cultivated in monolayer in DMEM supplemented with 10% fetal bovine serum (FBS), 1% penicillin/streptomycin, 3.7 g L−1 sodium carbonate, and 5 mM glucose in 5% CO2/95% air at 37 °C. For cell viability, MCF-7 cells and SKBR-3 cells were initially seeded in 96-well plates at ∼1 × 10⁴ cells per well. The cell viability after labeling was assessed by a standard MTT assay and was compared with the viability of unlabeled cells.
2.6.2. Doxorubicin loading in GdVO4:Eu3+@mSiO2-PEG NPs and drug release profile. GdVO4:Eu3+@mSiO2-PEG NPs dispersed in PBS were centrifuged and redispersed with 1 mL of doxorubicin (DOX) solution in PBS (0.6 mg mL−1). After stirring overnight, DOX-loaded NPs were centrifuged and washed with DI water to remove the unadsorbed free DOX. The supernatant containing unadsorbed DOX was collected for UV measurement to calculate the adsorbed amount of DOX in NPs. To evaluate time-dependent drug release, drug loaded nanoparticles (0.3 mg) was dispersed in 1 mL of buffer at different pH conditions, 1 mM phosphate buffer (pH 7.4) and 1 mM acetate buffer (pH 5.0). DOX release was monitored by measurement of the absorption intensity at 480 nm of supernatant solution after centrifugation at 2 h, 4 h, 7 h, 10 h, 14 h, 18 h, and 24 h incubations.
2.6.3. In vitro cytotoxicity against MCF-7 cells with free DOX and DOX-loaded NPs. MCF-7 cells were seeded in a 96-well plate at a density of ∼1 × 10⁴ cells per well and cultivated in DMEM/F12 medium supplemented with 10% FBS for 24 h at 37 °C. Then, free DOX and DOX-loaded GdVO4:Eu3+@mSiO2-PEG NPs were added to the medium, and the cells were incubated for 24 h at 37 °C. The concentrations of DOX were 15, 1.5, 0.15, and 0.015 μM, respectively. Finally, the cell viability was evaluated by the MTT assay.
2.6.4. T1-weighted MR and fluorescence imaging. For in vitro T1-weighted MR and fluorescence images, unlabeled cells and labeled cells (1 × 10⁶) with GdVO4:Eu3+@mSiO2-PEG NPs were counted and transferred to 1.5 mL Eppendorf tubes at a concentration of ∼1 × 10⁶ cells per tube and pelleted by centrifugation. 0.5 mL of 4% gelatin was dropped to each tube. MRI of the cell pellets was conducted on 1.5 T MR scanner. Fluorescence imaging of the pellets was obtained using the fluorescence imaging system.
2.6.5. In vitro drug delivery and confocal laser scanning microscopy (CLSM). MCF-7 cells were plated in chamber slides (Labtek chamber slide 4-well, Nunc) at a density of 2 × 10⁴ cells per well for 24 h before cellular uptake. GdVO4:Eu3+@mSiO2-PEG NPs loaded with DOX were incubated in MCF-7 cells for 2 h at 37 °C in serum free medium. Then, the cells were washed with PBS three times and fixed in 1% paraformaldehyde solution. The slides were covered with a mounting medium (SuperMount, InnoGenex, USA). The cells were imaged by a confocal laser scanning microscope using a helium–neon laser with an excitation wavelength of 543 nm and 560–615 nm emission band-pass filter.

3. Results and discussion

3.1. Synthesis of GdVO4:Eu3+@mSiO2 NPs

GdVO4:Eu3+ NPs were prepared using a modified reverse micelle method,32 which enabled the synthesis of uniform GdVO4:Eu3+ NPs under facile and mild reaction conditions. Specifically, they were synthesized from the reaction of gadolinium(III) acetate and europium(III) acetate (9 mol% doped of Eu3+) with vanadyl sulfate solution in xylene at 90 °C in the presence of oleylamine and oleic acid under air atmosphere. Transmission electron microscopy (TEM) images of the GdVO4:Eu3+ NPs reveal the formation of square-shaped nanoplates with average side dimension of 15 nm and thickness of around 3.5 nm (Fig. 1A and B). Fig. 1C shows an X-ray diffraction (XRD) pattern of the synthesized GdVO4:Eu3+ NPs, indicating that it corresponds well with the typical XRD pattern of zircon-type (ZrSiO4) GdVO4 crystal structure (a = 7.212 Å and c = 6.348 Å, Joint Committee on Powder Diffraction Standards (JCPDS) file number 17-0260).
image file: c4ra06628f-f1.tif
Fig. 1 Characterizations of the GdVO4:Eu3+ NPs. (A and B) The bright field TEM image (A) and tilted TEM image (B) of the 15 nm-sized GdVO4:Eu3+ NPs. (C) XRD pattern of the GdVO4:Eu3+ NPs (XRD pattern for zircon-type structure GdVO4 is shown as blue lines for reference).

In a previous report on the synthesis of Eu3+ doped metal oxide nanoparticles, it was demonstrated that Eu3+ doped nanoparticles exhibited strong red emission with wavelength of around 618 nm.11–13 The concentration of Eu3+ in the NPs is easily controlled by initial ratio of Eu3+/Gd3+. The inductively coupled plasma (ICP) data of GdVO4:Eu3+ NPs shows that the concentration of Eu3+ in the as-prepared NPs was well matched with the concentration of it in the starting material, indicating that Eu3+ was successfully incorporated in the GdVO4 NPs (see the ESI Table S1). Fig. 2 displays the room temperature PL spectra of GdVO4:Eu3+ NPs excited at 330 nm, showing that the emission was considerably enhanced by increasing the Eu3+ concentration up to 9 mol%. This phenomenon was primarily attributed to enhanced population of energy transfer from host to the dopants. On the other hand, under the higher Eu3+ concentration than 9 mol%, intensity of emission spectrum was quickly decreased possibly due to the Eu3+–Eu3+ cross relaxation.33


image file: c4ra06628f-f2.tif
Fig. 2 Room temperature PL spectra of GdVO4:Eu3+ NPs excited at 330 nm, showing GdVO4:Eu3+ NPs exhibited the strongest PL emission when the concentration of Eu3+ was 9 mol%.

In this synthesis, CTAB serves as not only a capping agent to transfer hydrophobic GdVO4:Eu3+ NPs to the aqueous phase34 but also an organic template to form mesoporous silica structures on the surface of NPs.35,36 For biomedical applications, the surface of the NPs was modified with PEG to render them biocompatible after removing the CTAB templates from the as-synthesized materials by refluxing in acidic ethanol solution (pH 2.3). TEM (Fig. 3A) and high-resolution TEM (HRTEM) (Fig. 3B) images reveal that a single GdVO4:Eu3+ core was encapsulated with a porous silica shell without any interparticular aggregation and its overall size is about 75 nm. The mesoporous structures of GdVO4:Eu3+@mSiO2 NPs were also confirmed using N2 adsorption/desorption isotherms. The average diameter of pores calculated by the Barrett–Joiner–Halenda (BJH) method was 3.3 nm. The Brunauer–Emmett–Teller (BET) surface area and pore volume of GdVO4:Eu3+@mSiO2 NPs were measured to be 158.57 m2 g−1 and 0.36 cm3 g−1 (Fig. 3C), respectively, indicating the large surface area of GdVO4:Eu3+@mSiO2 NPs. The terminal succinimidyl group of PEG was conjugated with the amine groups in the amine-modified GdVO4:Eu3+@mSiO2 NPs to improve the dispersibility in an aqueous environment, which is essential to be theragnostic agents. GdVO4:Eu3+@mSiO2-PEG NPs showed excellent colloidal stability without agglomerations in phosphate-buffered saline (PBS). Their hydrodynamic diameter measured by dynamic light scattering (DLS) according to the number distribution was obtained to be 124 nm, and maintained at 110–125 nm for over 7 days (see the ESI Fig. S1). We should note that our design strategy was to produce highly dispersible mesoporous nanoparticles with a single contrasting core in their bodies. In the previous studies, GdVO4:Eu3+/mesoporous silica hybrids usually have a structure of decorated GdVO4:Eu3+ phosphors outside of mesoporous silica and large overall size (>100 nm).37,38 Our GdVO4:Eu3+@mSiO2 NPs is more uniform and dispersive with a very robust and single core–shell nanostructure. The colloidal stability and biocompatibility is also improved by pegylation on the surface of nanoparticles.39 Therefore, as-synthesized GdVO4:Eu3+@mSiO2-PEG NPs ended up being very stable in biological media and desirable as an effective bio-imaging nanoprobe and an intracellular drug carrier system. In particular, the aqueous dispersibility is a key factor to affect magnetic relaxivity of contrast agents, particularly, T1 relaxation, and a GdVO4:Eu3+ single core with a manipulated shell structure (mesoporous/dense silica) could offer the relaxometric study on the water accessibility to a magnetic core.


image file: c4ra06628f-f3.tif
Fig. 3 (A and B) TEM and HRTEM images of the 75 nm-sized GdVO4:Eu3+@mSiO2 NPs. (C) N2 adsorption/desorption isotherms of the GdVO4:Eu3+@mSiO2 NPs (inset: pore size distribution; V: pore volume, D: pore size). (D) TEM image of the 65 nm-sized GdVO4:Eu3+@dSiO2 NPs.

3.2. Photoluminescence of GdVO4:Eu3+@mSiO2 NPs

In the previous photoluminescence studies of Eu3+ in GdVO4 matrix,13 the emission spectrum in the wavelength of 540–620 nm could be described by the intrinsic transitions between 5D0/5D1 and 7Fj (j = 1, 2), which include the 5D17F1 transition at 540 nm, the 5D07F1 transition at 595 nm, and the 5D07F2 transition at 618 nm. Particularly, the 5D07F2 transition in the GdVO4:Eu3+ NPs was greatly enhanced and produced a strong red emission upon UV irradiation. Even though the PL efficiency dropped 30% (Fig. S2), the photoluminescent behavior of GdVO4:Eu3+ NPs was successfully maintained after mesoporous silica coating and a bright red emission was observed (Fig. 4). Turbid gray colored aqueous solution of the GdVO4:Eu3+@mSiO2 NPs turned red under excitation of UV lamp at 307 nm (inset of Fig. 4). The emission peaks at 540 nm, 585 nm, and 618 nm appeared in the PL spectrum of GdVO4:Eu3+@mSiO2 NPs, and strong red emission was observed at 618 nm. These peaks were similar to the previously reported values.13
image file: c4ra06628f-f4.tif
Fig. 4 Room-temperature PL spectrum of the GdVO4:Eu3+@mSiO2 NPs in water. Inset shows photographic images of GdVO4:Eu3+@mSiO2 NP dispersion under room light (left) and UV irradiation (right).

3.3. MRI contrasting effect of GdVO4:Eu3+@mSiO2 NPs

Fig. 5A shows the T1-weighted MR images of the GdVO4:Eu3+@mSiO2 NPs with various concentrations of Gd ion (0, 0.06, 0.13, 0.26, and 0.52 mM). MR signal intensity increased as Gd ion concentration rose. The efficacy of a contrast agent is generally expressed by its relaxivity, which is defined as the gradient of the linear plot of relaxation rates (1/Ti, i = 1, 2) versus Gd concentration [Gd] (i.e., 1/Ti = 1/To + ri·[Gd], where Ti is the relaxation time for a contrast agent solution concentration [Gd], and To is the relaxation time in the absence of a contrast agent).40 Fig. 5B shows linear correlation between the relaxation rate (R1 = 1/T1) and the concentration of Gd. Particularly, the r1 value of GdVO4:Eu3+@mSiO2 NPs (2.21 mM−1 s−1) was larger than that of dense silica-coated GdVO4:Eu3+ NPs (GdVO4:Eu3+@dSiO2 NPs) (0.64 mM−1 s−1) (Fig. 3D, and see also ESI Fig. S3), indicating that the mesoporous silica coating increase the T1 MRI contrast. It is known that the change of the longitudinal relaxivity (r1) is influenced by the local diffusion of water molecules in the vicinity of an MRI contrast agent.41 Therefore, the longitudinal relaxivity of gadolinium-based contrast agents was enhanced by the entrapment of Gd3+ ions in mesoporous structures.42,43 In our GdVO4:Eu3+@mSiO2 NPs, the mesoporous silica coating facilitates the access of water molecules to the Gd core, thereby leading to the efficient relaxation of water, and subsequently enhanced T1-weighted MRI contrast.44,45 The performance of MRI contrast agents is also characterized by the r2/r1 ratio, which must be 1 to be the best positive contrast agent. For example, “Magnevist” (Gadopentetate dimeglumine; a commercial gadolinium complex) has an optimal r2/r1 ratio of 1 (r1 = 4.6 mM−1 s−1, r2 = 4.5 mM−1 s−1) at 1.5 T.46,47 The relaxometric ratio (r2/r1 ratio) of GdVO4:Eu3+@mSiO2 NPs was calculated to be 3.39. When compared to the above-mentioned commercial Gd compound, it is understood that the relaxometric properties of GdVO4:Eu3+@mSiO2 NPs need to be substantially improved. However, considering that the GdVO4:Eu3+@mSiO2 NPs are specifically designed as a multifunctional theragnostic agent, they are excellent candidates to be NP–based positive MRI contrast agents in T1-weighted MRI applications.
image file: c4ra06628f-f5.tif
Fig. 5 MR property of the GdVO4:Eu3+@mSiO2 NPs. (A) T1-weighted MR images of the GdVO4:Eu3+@mSiO2 NP dispersion in water. The contents of Gd in the dispersions are indicated above the images. (B) Linear plot of Gd concentration versus 1/T1 with a relaxivity value (r1) of 2.21 mM−1 s−1.

3.4. In vitro multimodal imaging and drug delivery

The cell viability was assessed by the MTT assay. The cell viability was not hindered by the presence of GdVO4:Eu3+@mSiO2-PEG NPs up to a concentration of 50 μg Gd mL−1 for both SK-BR-3 cell lines and MCF-7 cell lines (Fig. S4). Within this concentration of Gd ion, we investigated the potentials of GdVO4:Eu3+@mSiO2-PEG NPs for multimodal imaging and drug delivery. Fig. 6A shows the results of in vitro T1-weighted MRI of the pelleted MCF-7 cells labeled with GdVO4:Eu3+@mSiO2-PEG NPs (concentration 20 μg Gd mL−1). No hyperintense signal was detected when the unlabeled cell pellet was imaged. However, a hyperintense signal appeared on pelleted MCF-7 cells labeled with nanoparticles in both T1-weighted MR and their color-coded maps. Like of the MR results, the fluorescence appeared on the pelleted MCF-7 cells labeled with GdVO4:Eu3+@mSiO2-PEG NPs (Fig. 6B). The tumor cell responses to chemotherapy can be monitored real-time due to the combination of MR and fluorescence imaging capabilities of GdVO4:Eu3+@mSiO2-PEG NPs, which provide important feedbacks in cancer treatment.48
image file: c4ra06628f-f6.tif
Fig. 6 In vitro T1-weighted MR and fluorescence images of the pelleted MCF-7 cells labeled with GdVO4:Eu3+@mSiO2-PEG NPs. (A) T1-Weighted MR images and their color-coded maps. (B) Fluorescence images.

Doxorubicin (DOX), a chemotherapeutic agent for cancer,49 was used as a model drug and was incorporated into the nanoparticles. DOX can be easily attracted and adsorbed onto the large amount of open channels of mesoporous silica shell via electrostatic attraction or/and through forming hydrogen bonds with the surface silanols.50 The loading efficiency was assessed by UV-Vis spectroscopy and the typical DOX loading was measured to be 14.6 wt% (0.54 mg DOX/mg NPs). After 2 h incubation, 15.5% of DOX was released from the NPs at pH 7.4, whereas 32.5% of DOX released at pH 5.0 (See the ESI Fig. S5). The drug release profile depicts a faster initial release of the absorbed DOX in pores of silica, followed by a plateau (Fig. S5C). In particular, loaded drugs were released from the NPs in a sustained manner at pH 7.4, resulting 50% of DOX was still loaded in the NPs even after 24 h. However, lowering of the pH results in an increase of drug release. The electrostatic interaction between payload and silica is decreased due to the protonation of surface silanol at low pH.51

The uptake and internalization of the free DOX and DOX-loaded GdVO4:Eu3+@mSiO2-PEG NPs in MCF-7 cells were evaluated by the confocal laser scanning microscopy (CLSM). CLSM images of the nuclei of cancer cells were obtained from blue fluorescence by Hoechst 33342 dye, and red fluorescence from DOX indicated that nanoparticles can deliver the chemotherapeutic agent. As shown in Fig. 7A and B, the intracellular distribution of the DOX-loaded GdVO4:Eu3+@mSiO2-PEG NPs is different from that of free DOX. Free DOX was mostly found in the cell nuclei (Fig. 7A), since DOX is known to be transported to cells by a passive diffusion mechanism.52 In contrast, the DOX-loaded GdVO4:Eu3+@mSiO2-PEG NPs were accumulated mostly in the cytoplasm (Fig. 7B), which is the same result obtained from other nanostructured drug-delivery vehicles.31,53 These results demonstrate that the GdVO4:Eu3+@mSiO2-PEG NP is an efficient delivery vehicle with sustained delivery behavior. NPs loaded with DOX were internalized to the cytoplasm via endocytosis, and DOX may be released to enter cell nuclei. The delivered DOX inside the cell nucleus intercalates into DNA and interacts with topoisomerase II to cause DNA cleavage, cell growth inhibition, and finally cell death.54 Therefore, in vitro cytotoxicity effects of the free DOX and DOX-loaded GdVO4:Eu3+@mSiO2-PEG NPs were tested on the MCF-7 cells for assessment of drug delivery efficacies of nanoparticles. As shown in Fig. 7C, growth inhibition was observed when the cells were treated with either the free DOX or DOX-loaded GdVO4:Eu3+@mSiO2-PEG NPs. Furthermore, consistent with CLSM results, the entrapped DOX from DOX-loaded GdVO4:Eu3+@mSiO2-PEG NPs seems to exhibit sustained release behavior.55,56 These results demonstrate that the GdVO4:Eu3+@mSiO2-PEG NPs can be an efficient drug-delivery vehicle.


image file: c4ra06628f-f7.tif
Fig. 7 Uptake of the free DOX and DOX-loaded GdVO4:Eu3+@mSiO2-PEG NPs in cancer cells and cytotoxicity data. (A and B) Optical and CLSM images of the free DOX (A) and of the DOX-loaded GdVO4:Eu3+@mSiO2-PEG NPs (B) incubated in MCF-7 cells for 2 h (blue: the nuclei of cells stained by Hoechst 33342, red: DOX fluorescence). (C) In vitro cytotoxicity of the free DOX (red) and of the DOX-loaded GdVO4:Eu3+@mSiO2-PEG NPs (blue) against MCF-7 cells, demonstrating that the GdVO4:Eu3+@mSiO2-PEG NPs can be used as anti-cancer drug delivery vehicles.

4. Conclusion

We have successfully synthesized discrete and uniform mesoporous silica-coated GdVO4:Eu3+ NPs. The GdVO4:Eu3+ NPs have potential to be used as a multimodal imaging probe of fluorescence and magnetic resonance imaging. Eu3+ doped in GdVO4 NPs exhibit strong red emission and Gd3+ in GdVO4 NPs can be used as a T1 contrast agent for MRI. Furthermore, when the nanoparticles were coated with mesoporous silica shell, water accessibility to the magnetic core is increased, providing more efficient T1 MR imaging contrast. Mesoporous silica shell also enables drug delivery with sustained release. We have thus successfully demonstrated simultaneous T1 MR and fluorescence imaging as well as drug delivery using the mesoporous silica-coated GdVO4:Eu3+ NPs.

Acknowledgements

This work was supported by the Korean Health Technology R&D Project, Korean Ministry of Health & Welfare (A111014), the Research Center Program of the Institute for Basic Science (IBS) in Korea (IBS-R006-D1), the Engineering Research Center of Excellence Program of Korea (Grant NRF-2014R1A5A1009799) and the Basic Science Research Program (Grant NRF-2014R1A1A1003555) through the National Research Foundation of Korea funded by the Ministry of Science, ICT & Future Planning.

References

  1. D. E. Lee, H. Koo, I. C. Sun, J. H. Ryu, K. Kim and I. C. Kwon, Chem. Soc. Rev., 2012, 41, 2656–2672 RSC.
  2. J. Key and J. F. Leary, Int. J. Nanomed., 2014, 9, 711–726 Search PubMed.
  3. K. Yan, P. Li, H. Zhu, Y. Zhou, J. Ding, J. Shen, Z. Li, Z. Xu and P. K. Chu, RSC Adv., 2013, 3, 10598–10618 RSC.
  4. J. Xie, K. Chen, J. Huang, S. Lee, J. Wang, J. Gao, X. Li and X. Chen, Biomaterials, 2010, 31, 3016–3022 CrossRef CAS PubMed.
  5. J. Kim, Y. Piao and T. Hyeon, Chem. Soc. Rev., 2009, 38, 372–390 RSC.
  6. J.-L. Bridot, A.-C. Faure, S. Laurent, C. Rivière, C. Billotey, B. Hiba, M. Janier, V. Josserand, J.-L. Coll, L. V. Elst, R. Muller, S. Roux, P. Perriat and O. Tillement, J. Am. Chem. Soc., 2007, 129, 5076–5084 CrossRef CAS PubMed.
  7. S. T. Selvan, P. K. Patra, C. Y. Ang and J. Y. Ying, Angew. Chem., Int. Ed., 2007, 46, 2448–2452 CrossRef CAS PubMed.
  8. N. Insin, J. B. Tracy, H. Lee, J. P. Zimmer, R. M. Westervelt and M. G. Bawendi, ACS Nano, 2008, 2, 197–202 CrossRef CAS PubMed.
  9. M. H. V. Werts, Sci. Prog., 2005, 88, 101–131 CrossRef CAS.
  10. J. C. G. Bünzli and C. Piguet, Chem. Soc. Rev., 2005, 34, 1048–1077 RSC.
  11. Q. Lu, A. Li, F. Y. Guo, L. Sun and L. C. Zhao, Nanotechnology, 2008, 19, 205704–205711 CrossRef PubMed.
  12. J. W. Stouwdam, M. Raudsepp and F. C. J. M. van Veggel, Langmuir, 2005, 21, 7003–7008 CrossRef CAS PubMed.
  13. M. Gu, Q. Liu, S. Mao, D. Mao and C. Chang, Cryst. Growth Des., 2008, 8, 1422–1425 CAS.
  14. X. Hu, M. Wang, F. Miao, J. Ma, H. Shena and N. Jia, J. Mater. Chem. B, 2014, 2, 2265–2275 RSC.
  15. N. O. Nuñez, S. Rivera, D. Alcantara, J. M. de la Fuente, J. García-Sevillano and M. Ocaña, Dalton Trans., 2013, 42, 10725–10734 RSC.
  16. M. A. Brown and R. C. Semelka, MRI: basic principles and applications, Wiley-Liss, New York, 2003 Search PubMed.
  17. M. F. Bellin, Eur. J. Radiol., 2006, 60, 314–323 CrossRef PubMed.
  18. H. B. Na, I. C. Song and T. Hyeon, Adv. Mater., 2009, 21, 2133–2148 CrossRef CAS.
  19. M. H. M. Dias and P. C. Lauterbur, Magn. Reson. Med., 1986, 3, 328–330 CrossRef CAS.
  20. J. W. M. Bulte and D. L. Kraitchman, NMR Biomed., 2004, 17, 484–499 CrossRef CAS PubMed.
  21. P. Caravan, J. J. Ellison, T. J. McMurry and R. B. Lauffer, Chem. Rev., 1999, 99, 2293–2352 CrossRef CAS PubMed.
  22. J. S. Kim, W. J. Rieter, K. M. L. Taylor, H. An, W. Lin and W. Lin, J. Am. Chem. Soc., 2007, 129, 8962–8963 CrossRef CAS PubMed.
  23. Z. Cheng, D. L. J. Thorek and A. Tsourkas, Adv. Funct. Mater., 2009, 19, 3753–3759 CrossRef CAS PubMed.
  24. Y.-S. Lin, Y. Hung, J.-K. Su, R. Lee, C. Chang, M.-L. Lin and C.-Y. Mou, J. Phys. Chem. B, 2004, 108, 15608–15611 CrossRef CAS.
  25. C.-P. Tsai, Y. Hung, Y.-H. Chou, D.-M. Huang, J.-K. Hsiao, C. Chang, Y.-C. Chen and C.-Y. Mou, Small, 2008, 4, 186–191 CrossRef CAS PubMed.
  26. K. M. L. Taylor, J. S. Kim, W. J. Rieter, H. An, W. Lin and W. Lin, J. Am. Chem. Soc., 2008, 130, 2154–2155 CrossRef CAS PubMed.
  27. B. G. Trewyn, I. I. Slowing, S. Giri, H. T. Chen and V. S. Y. Lin, Acc. Chem. Res., 2007, 40, 846–853 CrossRef CAS PubMed.
  28. S. Jambhrunkar, S. Karmakar, A. Popat, M. Yu and C. Yu, RSC Adv., 2014, 4, 709–712 RSC.
  29. J. E. Lee, N. Lee, T. Kim, J. Kim and T. Hyeon, Acc. Chem. Res., 2011, 44, 893–902 CrossRef CAS PubMed.
  30. J. Lu, M. Liong, Z. Li, J. I. Zink and F. Tamanoi, Small, 2010, 6, 1794–1805 CrossRef CAS PubMed.
  31. J. E. Lee, N. Lee, H. Kim, J. Kim, S. H. Choi, J. H. Kim, T. Kim, I. C. Song, S. P. Park, W. K. Moon and T. Hyeon, J. Am. Chem. Soc., 2010, 132, 552–557 CrossRef CAS PubMed.
  32. T. Yu, J. Moon, J. Park, Y. I. Park, H. B. Na, B. H. Kim, I. C. Song, W. K. Moon and T. Hyeon, Chem. Mater., 2009, 21, 2272–2279 CrossRef CAS.
  33. F. Wang and X. Liu, J. Am. Chem. Soc., 2008, 130, 5642–5643 CrossRef CAS PubMed.
  34. H. Fan, K. Yang, D. M. Boye, T. Sigmon, K. J. Malloy, H. Xu, G. P. López and C. J. Brinker, Science, 2004, 304, 567–571 CrossRef CAS PubMed.
  35. Z. Chen, D. Niu, Y. Li and J. Shi, RSC Adv., 2013, 3, 6767–6770 RSC.
  36. J. Kim, H. S. Kim, N. Lee, T. Kim, H. Kim, T. Yu, I. C. Song, W. K. Moon and T. Hyeon, Angew. Chem., Int. Ed., 2008, 47, 8438–8441 CrossRef CAS PubMed.
  37. S. Huang, Z. Cheng, P. Ma, X. Kang, Y. Dai and J. Lin, Dalton Trans., 2013, 42, 6523–6530 RSC.
  38. G. Liu, G. Hong, J. Wang and X. Dong, Nanotechnology, 2006, 17, 3143 Search PubMed.
  39. A. S. Karakoti, S. Das, S. Thevuthasan and S. Seal, Angew. Chem., Int. Ed., 2011, 50, 1980–1994 CrossRef CAS PubMed.
  40. E. Tóth, R. D. Bolskar, A. Borel, G. González, L. Helm, A. E. Merbach, B. Sitharaman and L. J. Wilson, J. Am. Chem. Soc., 2005, 127, 799–805 CrossRef PubMed.
  41. P. Caravan, Chem. Soc. Rev., 2006, 35, 512–523 RSC.
  42. J. S. Ananta, B. Godin, R. Sethi, L. Moriggi, X. Liu, R. E. Serda, R. Krishnamurthy, R. Muthupillai, R. D. Bolskar, L. Helm, M. Ferrari, L. J. Wilson and P. Decuzzi, Nat. Nanotechnol., 2010, 5, 815–821 CrossRef CAS PubMed.
  43. R. Sethi, J. S. Ananta, C. Karmonik, M. Zhong, S. H. Fung, X. Liu, K. Li, M. Ferrari, L. J. Wilson and P. Decuzzi, Contrast Media Mol. Imaging, 2012, 7, 501–508 CrossRef CAS PubMed.
  44. J. Liu, W. Bu, S. Zhang, F. Chen, H. Xing, L. Pan, L. Zhou, W. Peng and J. Shi, Chem.–Eur. J., 2012, 18, 2335–2341 CrossRef CAS PubMed.
  45. T. Kim, E. Momin, J. Choi, K. Yuan, H. Zaidi, J. Kim, M. Park, N. Lee, M. T. McMahon, A. Quinones-Hinojosa, J. W. M. Bulte, T. Hyeon and A. A. Gilad, J. Am. Chem. Soc., 2011, 133, 2955–2961 CrossRef CAS PubMed.
  46. R. Guillet-Nicolas, M. Laprise-Pelletier, M. M. Nair, P. Chevallier, J. Lagueux, Y. Gossuin, S. Laurent, F. Kleitz and M.-A. Fortin, Nanoscale, 2013, 5, 11499–11511 RSC.
  47. W. S. Seo, J. H. Lee, X. Sun, Y. Suzuki, D. Mann, Z. Liu, M. Terashima, P. C. Yang, M. V. McConnell, D. G. Nishimura and H. Dai, Nat. Mater., 2006, 5, 971–976 CrossRef CAS PubMed.
  48. J. Xie, S. Lee and X. Chen, Adv. Drug Delivery Rev., 2010, 62, 1064–1079 CrossRef CAS PubMed.
  49. D. J. Booser and G. N. Hortobagyi, Drugs, 1994, 47, 223–227 CrossRef CAS PubMed.
  50. N. Z. Knezevic, B. G. Trewyn and V. S. Y. Lin, Chem.–Eur. J., 2011, 17, 3338–3342 CrossRef CAS PubMed.
  51. F. Lu, A. Popa, S. Zhou, J.-J. Zhu and A. C. S. Samia, Chem. Commun., 2013, 49, 11436–11438 RSC.
  52. H. S. Yoo, K. H. Lee, J. E. Oh and T. G. Park, J. Controlled Release, 2000, 68, 419–431 CrossRef CAS.
  53. Y. Chen, H. Chen, S. Zhang, F. Chen, S. Sun, Q. He, M. Ma, X. Wang, H. Wu, L. Zhang, L. Zhang and J. Shi, Biomaterials, 2012, 33, 2388–2398 CrossRef CAS PubMed.
  54. F. Zunino and G. Capranico, Anti-Cancer Drug Des., 1990, 5, 307–317 CAS.
  55. Y. Piao, J. Kim, H. B. Na, D. Kim, J. S. Baek, M. K. Ko, J. H. Lee, M. Shokouhimehr and T. Hyeon, Nat. Mater., 2008, 7, 242–247 CrossRef CAS PubMed.
  56. J. Shin, R. M. Anisur, M. K. Ko, G. H. Im, J. H. Lee and I. S. Lee, Angew. Chem., Int. Ed., 2009, 48, 321–324 CrossRef CAS PubMed.

Footnote

Electronic supplementary information (ESI) available. See DOI: 10.1039/c4ra06628f

This journal is © The Royal Society of Chemistry 2014