Effect of melting temperature on interfacial interaction and mechanical properties of polypropylene (PP) fiber reinforced olefin block copolymers (OBCs)

Zhen Li, Yunjie Shi, Huili Liu, Feng Chen, Qin Zhang, Ke Wang and Qiang Fu*
College of Polymer Science and Engineering, State Key Laboratory of Polymer Materials Engineering, Sichuan University, Chengdu 610065, China. E-mail: qiangfu@scu.edu.cn; Fax: +86-28-85405402; Tel: +86-28-85405402

Received 2nd July 2014 , Accepted 3rd September 2014

First published on 3rd September 2014


Abstract

PP fiber reinforced olefin block copolymers (OBCs) were manufactured in this research. Chopped PP fibers were first compounded with OBCs at a fixed ratio in a Haake mixer at 140 °C (lower than the melting point of PP fiber). The blends were then processed at three different temperatures, below (155 °C), around (170 °C) and above (190 °C) the melting temperature of the fibers. The three specimens displayed completely different mechanical properties according to the following sequence: 170 °C > 190 °C > 155 °C. To obtain an insight into the phenomenon, the structure–property relationships were fully investigated. It was found that when the blends were processed at 155 °C, the fibers retained a high strength and modulus but lost the interaction with the matrix, displaying poor mechanical properties. At a higher temperature of 190 °C, the fiber showed a strong interaction with OBCs but the reinforcing effect was unsatisfactory because the melted fibers lost the original modulus. When the blends were injection molded at 170 °C, the fibers were in the partially melted state, showing strong interaction with the matrix and relatively high strength and modulus. Therefore, the composites exhibited the mechanical performance. This article proves that the fiber strength and interfacial bonding are the two factors that determine the final properties in fiber reinforced composites. Moreover, it is suggested that the interfacial interaction could be improved by controlling the melting state instead of complex surface treatment of the fibers.

1. Introduction

Thermoplastic elastomers (TPEs) have been widely used in many fields because of their easily compounded characteristics using traditional thermoplastic processing methods. Natural and synthetic rubbers are giving way to TPEs, including styrenic block copolymers, polyurethanes, thermoplastic elastomer blends, and polyolefin elastomers.1,2 Recently, the Dow Chemical Company synthesized olefin block copolymers (OBCs, INFUSE™) using novel chain shuttling technology.3,4 The multi-block copolymers consisted of crystallizable ethylene–octene blocks (hard blocks) with low octene concentration, alternating with amorphous ethylene–octene blocks (soft blocks) with a high comonomer content. By controlling the concentration of chain shuttling agent, the length of the hard and soft blocks can be regulated.5–7

Compared to other polyolefin elastomers, such as random ethylene–octene copolymers, the special blocky structure of OBCs imparts higher crystallinity while retaining better elastic and compression set properties at high temperature. In addition, they exhibit improved abrasion resistance and faster cycle time.5,6,8–10 Therefore, many researchers are studying the structure–property relationship of OBCs.11–22 It was demonstrated that the crystallization and mesophase separation morphology is dependent on the chain structure, such as ΔC8 (the difference of octene content between the soft and hard blocks), as well as the length and constitution of the two blocks. For instance, Liu et al. reported that OBCs with higher ΔC8 exhibits mesophase separation, and the fibril-like crystalline lamellae in the OBCs with lower ΔC8 are dispersed in the amorphous matrix, while the lamellae in OBC with a higher ΔC8 are confined in the isolated meso-domains.11 This may explain the different mechanical properties for the two OBCs. Zuo et al.9,13 reported that OBCs synthesized with a shuttling agent had shorter block length and behaved like random ethylene–octene copolymers. However, its mechanical recoverability was poorer than the OBC with longer block length.

Based on the above, it can be concluded that the structure–property relationships are well established despite the relatively complex block structures. However, similar to other TPEs, the sole use of OBCs is restricted to load bearing because of poor mechanical properties such as low strain modulus and poor dimensional stability.23 Usually second component is incorporated into the elastomers to realize the reinforcement to overcome the issue.24 Tong et al. prepared OBC/organically modified montmorillonite (OMMT) nanocomposites with different dispersion states of clay.25,26 The collapsed OMMT nanocomposites exhibited stronger nucleation ability on the crystallization of OBC than intercalated OMMT, leading to different hierarchical and mechanical properties. Unfortunately, the reinforcing effect was not as obvious as expected. If the goal is the orientation of mechanical properties, short fibers can reinforce the matrix for good strength and stiffness at a relatively low fraction of fibers.23,27–39 Among most fiber reinforced composites, surface modifications of the short fibers, such as aramid fiber or carbon fiber, aiming at improving the adhesion between the fiber and matrix is necessary.28,31–33 Irrespective of the treatment process, it is always time-consuming and costly.

A previous study reported that the soft segment of OBCs is expected to be partially miscible with isotactic polypropylene (iPP).40,41 Moreover, epitaxial crystallization occurred at the interface of olefin block OBC on uniaxially-oriented iPP, which can improve adhesion, compatibility and mechanical properties in polymer blends.17,42–44 Therefore, it is important to determine whether good interface adhesion can be achieved utilizing the partial compatibility or epitaxial crystallization between the OBCs and the fillers via different melting states of the PP fibers. In this article, OBCs were reinforced by PP fibers and the interfacial adhesion was regulated through different process temperatures instead of complex fiber treatment processes.

2. Materials and methods

2.1 Materials

OBC, synthesized by chain-shuttling technology, was supplied by Dow Chemical Company. The basic information on the material is shown in Table 1, including density, octene content, molecular weight and soft and hard block proportion. PP fiber (trade name Innegra S) was purchased from Innegra Technologies. The detailed specifications of the fiber are given in Table 2.
Table 1 Characteristics of the OBC materials
Sample code Brand Density (g cm−3) Octene content (%) Mw Soft segment (%) Hard segment (%) MI (g/10 min) Tm (°C)
OBC 9530 0.888 10.4 78[thin space (1/6-em)]640 65 35 5 123


Table 2 Technical specifications of Innegra S
Parameter/properties Value
Colour White
Weight per unit length (denier) 625
Filaments per tow (count) 50
Ultimate tensile strength (MPa) 667
Tensile modulus (MPa) 14[thin space (1/6-em)]828
Elongation at break (%) 9.5
Creep at 20% UTS 3.2
Diameter (μm) 38–42
Dielectric constant 2.2


2.2 Preparation of composites

Prior to use, the chopped PP fibers were treated in boiling acetone for 2 h to remove the sizing agents and dust. Then, they were dried in a vacuum oven at 40 °C for 24 h. The elastomers/PP fiber (90/10 w/w) composites were prepared in a Haake mixer (XSS-300, USA) at a temperature of 140 °C and a rotor speed of 50 rpm for 10 min. After pelleting and drying, the blends were injected into a mold using the mini-injected machine (Haak MiniJet) with a barrel temperature of 155 °C, 170 °C and 190 °C. The corresponding samples are noted as OBC-10PP-155, OBC-10PP-170 and OBC-10PP-190, respectively. The Haak MiniJet machine is illustrated in Fig. 1. Unlike the traditional injection molding machine, it is not equipped with a screw. The samples were heated via the heating cylinder from the outside to the inside. After the samples were plasticized, the melt was injected into the mold relying on the pressure exerted by pneumatic cylinder. The obtained specimens also have skin-core structure similar to other injection-molded samples.
image file: c4ra06548d-f1.tif
Fig. 1 Sketch of the Haak MiniJet machine.

2.3 Tensile properties

A SANS universal testing machine (Shenzhen, China) was used to measure the tensile properties. Tensile measurements were made on dumbbell shaped specimens, 4 mm wide, 2 mm thick with a gauge length of 30 mm. A crosshead speed of 50 mm min−1 was applied to determine the tensile properties.

2.4 Interface

Interfacial crystallization morphologies of the OBCs and PP fibers were recorded by polarized light microscopy (PLM) equipped with a hot-stage facility. The OBC thin film was first heated to 190 °C to erase the possible effects of the thermal history and then cooled to 140 °C. After the fiber was introduced, the OBC/fiber composites were subsequently moved to another hot plate to crystallize isothermally. The composites were heated to 155 °C and then cooled at a rate of 100 °C min−1 for isothermal crystallization at 114 °C. After observation, the composites were reheated to 170 °C and 190 °C to repeat the same process. The crystallization morphology of the sample was recorded by taking photographs with a digital camera at constant time intervals.

2.5 Differential scanning calorimetry (DSC) measurements

A differential scanning calorimeter (Perkin-Elmer pyris-1 DSC) with nitrogen as the purge gas was applied to study the melting behavior of the PP fiber. The mass of the tested sample was about 5 mg. In addition, the melting behavior of the samples taken from the skin and the core area of all the tensile specimens was also characterized. They were directly heated from 30 °C to 200 °C at a rate of 10 °C min−1 and then cooled to 50 °C at a rate of 10 °C min−1.

2.6 Rheological analysis

Melt rheology of OBC/PP fiber composites was measured in a strain-controlled dynamic rheometer Bohlin Gemini 2000, Malvern, British. For the measurements, disk-like samples obtained from the Haake mixer machine were used with diameters of 25 mm and thicknesses of 2 mm. The testing temperatures were controlled at 155 °C, 170 °C and 190 °C similar to that of the mini-injection molding process. To ensure a linear viscoelastic response, the strain amplitude was set to 1% with a frequency sweep performed in the range of 0.06–628 rad s−1.

2.7 Scanning electron microscope (SEM)

Scanning electron microscopy (SEM) experiments were performed using an FEI Inspect F SEM instrument with an acceleration voltage of 20 kV. The surface of the raw PP fiber was directly observed after sputter-coating with gold powder. For morphological observations of the composites, samples were first cryo-fractured in liquid nitrogen parallel and vertical to the shear flow direction. Then, they were etched chemically in xylene at 80 °C for 20 min, followed by washing and drying.

2.8 Polarized Fourier-transform infrared

Measurements were carried out on a Thermo Nicolet FTIR spectrometer at a resolution of 4 cm−1 with an accumulation of 64 scans in reflection mode. The beam was polarized by rotating a ZnSe polarizer. Films with a thickness of ca. 30 μm were cut from the skin and the core areas of the tensile specimens parallel to the flow direction. They were placed perpendicular to the FTIR beam with a vertical machine in the horizontal transverse direction. The measurements were performed with radiation polarized in the machine and transverse directions.

3. Results

3.1 Characterization of PP fibers

Thermal analysis of PP fibers was carried out by DSC. Fig. 2(a) shows the melting thermograms of PP fibers. The fibers began to melt at 155.5 °C, and two melting peaks at 160.3 °C and 172.2 °C were observed. Many studies have reported that iPP fibers have a double melting endotherm.45–48 To give one explanation, Caldas indicated that the α-monoclinic crystalline morphology of iPP is generally composed of the α1 and α2 forms. The lower temperature peak (160 °C) and higher temperature peak (173 °C) are associated with the melting of the α1 configuration and α2 configuration, respectively. In oriented iPP fibers, the enthalpic transformation from α1 to α2 appears to be confined to the temperature region between 156 °C and 163 °C, and the double endotherm results from a superposition of an exotherm, resulting from the α1 to α2 conversion, onto the general melting endotherm.48 Fig. 2(b) shows the SEM images of PP fibers at low and high magnifications. It can be seen that the single fiber diameter is ca. 40 μm and the surface is rather smooth.
image file: c4ra06548d-f2.tif
Fig. 2 (a) DSC curves of PP fibers and OBC elastomer (b) SEM images of pp fibers at low (b1) and high (b2) magnifications (c) WAXD pattern of OBC sample (d) TEM image of OBC (e) Sketch showing the structure of OBC.

Fig. 2(e) shows the alternating hard and soft segment structure of OBC. Wide-angle X-ray diffraction (WAXD) and transmission electron microscopy (TEM) were introduced to characterize the OBC elastomer (Fig. 2(c) and (d)). The OBC has a melting point at around 122 °C. From the WXRD pattern, OBC exhibits two sharp diffraction peaks at 2θ of 21.1° and 23.6° belonging to the (110) and (200) reflections of orthorhombic polyethylene (PE) crystals, respectively. The hard blocks formed the PE crystals as displayed in the TEM image, where the dark areas correspond to the crystalline domains.

3.2 Tensile properties

Fig. 3 shows the stress–strain curves of the OBC/PP composites and Table 3 summarizes the mechanical properties of the composites. It can be seen that the tensile properties of the neat OBCs remain stable regardless of the change in temperature. In addition, the incorporation of PP fibers exerts different effects on the mechanical behaviors at elevated temperatures. First, when injected at 170 °C, the elastomer/fiber composites exhibit the best tensile properties with a balanced tensile strength and elasticity. At higher injected temperatures, the tensile strength decrease to some extent but was still better than neat OBC. However, when the samples were prepared at 155 °C, the composites show undesirable properties with dramatically decreased elasticity and breaking strength. Therefore, overall, OBC-10PP-190 shows better mechanical properties than OBC-10PP-155.
image file: c4ra06548d-f3.tif
Fig. 3 Strain–stress curves of PP fiber reinforced composites mini-injection molded at different temperatures.
Table 3 Mechanical properties of OBC and its composites
  Elongation at break (%) 300% Tensile strength (MPa) Breaking strength (MPa)
OBC-155 765.1 ± 42.74 5.9 ± 0.83 10.1 ± 0.72
OBC-170 783.8 ± 32.92 6.1 ± 0.71 10.24 ± 0.78
OBC-190 775.6 ± 35.86 5.7 ± 0.52 9.7 ± 1.944
OBC-10PP-155 366.5 ± 38.40 9.1 ± 0.73 8.81 ± 0.22
OBC-10PP-170 595.1 ± 58.39 10.4 ± 1.35 12.7 ± 0.47
OBC-10PP-190 668.2 ± 14.54 8.6 ± 0.94 11.94 ± 0.43


3.3 Interfacial interaction

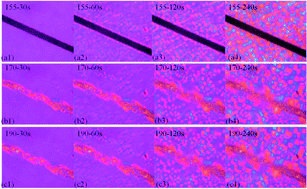
The interface between the matrix and the fiber is one of the critical factors that decide the final mechanical properties of polymer/fiber blends. Usually, favorable interfacial adhesion is achieved to transfer a load from the matrix to fibers.49 Transcrystalline (TC) is one of the hybrid crystalline structure formed because of the high density of active nuclei on the fiber surface. It has been proven that the unique structure may be responsible for realizing effective interfacial adhesion.50 Therefore, in this article, TC was also introduced to help better understand the interaction between OBC and PP fibers. TC morphology is often induced where semicrystalline polymers served as matrix, such as polypropylene and polyethylene, instead of elastomers.50–52 The crystallizable ethylene–octene blocks (hard blocks) endows OBCs with relatively high crystallinity, making it possible to form elastomer/fiber transcrystalline. Here, an OBC/PP fiber TC was first observed, as exhibited in Fig. 4.
image file: c4ra06548d-f4.tif
Fig. 4 Transcrystallization evolution at the interface of OBC and PP fibers. Isothermal crystallization was observed at 114 °C after cooling from different temperatures: (a1–a4) 155 °C (b1–b4) 170 °C and (c1–c4 190 °C.

According to the three temperatures used in mini-injected process, the same temperatures were also used to obtain different initial fiber morphologies before cooling to crystallization temperature. It should be noted that at 170 °C, PP fiber was almost melted. The phenomenon is acceptable because the melting temperature may shift toward lower temperatures considering the fiber was in less constrained state. From Fig. 4, it can be seen that all the three groups of samples show obvious transcrystalline structures and the TC layers reach the maximum after 240 s of isothermal crystallization. The evident difference lies in the thickness of the TC layer. When the samples were cooled from 170 °C and 190 °C, the TC layers were thicker than that cooled from 155 °C. The compatibility between matrix and the different melting state of PP fiber should be fully considered for a reasonable explanation. It has been found that the soft blocks of OBC are compatible with PP, and the interface where OBC and PP molecules were inter-penetrated is likely to be the region for the formation of nuclei.16.22 When the samples cooled from 170 °C or 190 °C, some degree of molecular relaxation at the surface of the fiber made it easier for the OBC molecules to diffuse into the relaxed PP chains. Therefore, both the nuclei density and the probability of molecular attachment increased, forcing the crystal growth in one direction to form thicker TC structure when isothermally crystallizing at 114 °C. In contrast, for the isothermal crystallizing samples cooled from 155 °C, PP molecules were confined in the ordered crystal lattice. Thus, the comparably smooth fiber surface will simply act as a substrate for homoepitaxy due to the lack of such chain relaxation and inter-diffusion. The relatively thinner TC layer indicates that the interface interaction is weaker than the former two composites.

To further investigate the interfacial interactions, we used the solubility parameter (δ) difference from cohesive energy density (CED) parameter values of both the polymers to estimate the Flory–Huggins interaction parameter χ:53–57

 
χ = (δAδB)2 Vr/(RT) (1)
 
Vr = [([M]AVA)([M]BVB)]1/2 (2)
 
δ = (CED)1/2 (3)
 
CED = (γ/0.75)3/2 (4)
where Vr is the reference volume, an average volume of repeated units, R is the gas constant, and T is the temperature (K); [M]A and [M]B are the monomeric molecular weights of components A and B, respectively, and VA and VB are the specific volumes of components A and B, respectively; R is the gas constant, and T is the temperature (K); γ is the surface free energy (SFE), which can be calculated from the contact-angle measurement according to the equation.53
 
image file: c4ra06548d-t1.tif(5)
 
γ = γd + γP (6)
where γ is in mJ m−2, CED is in 106 J m−3, δ is in 103 J1/2 m−3.

In this study, the values of γPP and γOBC at 190 °C were according to the reference to literature58 and we used the γ value of ethylene–octene copolymer (POE) to substitute OBC because they have similar structures. According to the literature, the dependence of SFE on temperature is linear and the temperature coefficient for PP was found to be 0.058 mJ m−2 per degree.59 As a novel olefinic elastomer, the temperature coefficient for OBC could not be found. Here, we used the same value of PP for substitution, i.e. 0.058 mJ m−2. Therefore, the γ value at 155 °C, 170 °C and 190 °C can be obtained.

Because Vr and R are both temperature-independent constants, to simplify the calculation process we define X = (R/Vr)χ = (δAδB)2/T. Thus, X can represent the changing trend of χ (X is in 103 J m−3 K−1 ). The results are concluded in Table 4.

Table 4 Values of γ and X at different temperatures
Materials γ (mJ m−2) X (103 J m−3 K−1)
155 °C 170 °C 190 °C 155 °C 170 °C 190 °C
a Note: PP had turned into solid state at 155 °C, the γ value at 25 °C was used here.
PP 34.37a 22.86 21.7 86.53 7.58 7.46
OBC 19.53 18.66 17.5      


From Table 4, X155 > X170X190, indicating that OBC-10PP-155 has poorer interfacial interaction than OBC-10PP-190 and OBC-10PP-190. It is understandable that at 155 °C, PP fiber was still in the solid state and the constrained PP molecules did not interfuse with OBC molecular chains, resulting in poor miscibility and interaction. Whereas at 170 °C and 190 °C, the relaxed PP chains were more likely to entangle with OBC chains, enhancing the interfacial bonding and displaying lower X values.

3.4 Thermal analysis

Fig. 5 shows the first DSC heat thermograms of the samples cut from the skin and the core areas of the three injection-molded specimens. As shown in Fig. 2(a), the peaks around 122 °C belong to the melting point of the OBC matrix and they nearly changed regardless of the processing temperature. The fibers show two peaks in OBC-10PP-155, which is in accordance with the former result because the fiber had not started to melt yet. This slight difference suggests that the two peaks shift to higher temperatures compared with the result of neat PP fibers. This is because the more constrained PP fiber in injection molded composites resulted in higher melting temperature than the neat loose PP fiber.45 For OBC-10PP-190, only one melting peak at 164.1 °C was observed regardless of the sampling position, indicating the complete melting of the fibers throughout the specimens. Unexpectedly, OBC-10PP-170 showed unique DSC patterns: the skin area exhibited two melting peaks similar to OBC-10PP-155, whereas the core area only has one peak similar to OBC-10PP-190. Compared with OBC-10PP-155, the lower peak of OBC-10PP-170 becomes more obvious and shift to lower temperature, which agrees with the typical melting behavior of the PP granules. In addition, the appearance of higher melting peak confirms that the parts of the PP fibers are still in unmelted and oriented state. However, PP fibers localized at the inner part of the specimen only show one melting peak. Based on this, it can be deduced the fibers were just partially melted in the skin zone and completely melted in the core area. A discrepancy may first arise from the different fiber constraint state in the charging barrel before injection. The skin and core area of the specimen result from the melt adjacent to the barrel and the melt in the middle of the barrel, respectively. It can be easily understood that the samples adjacent to the barrel were in a more stressful field than that in the middle of the barrel, making it harder for the fiber molecules to relax for a limit time at 170 °C.45 Although heat was applied from the barrel wall to the inside, the more constraint fibers still maintained their fiber morphology and exhibited partially melted characteristics. On the contrary, the blend pellets in the middle of the barrel were loosely distributed. Therefore, the less confined PP fibers in the middle of the barrel were more likely to melt and finally reached a completely melted state.
image file: c4ra06548d-f5.tif
Fig. 5 DSC curves of skin and core area samples from mini-injection molded specimens at different temperatures.

3.5 Rheology property

As shown in Fig. 6(a), the addition of PP fibers exerts a stronger effect on the rheology properties. The effect is more prominent at low angular frequency for elastic modulus. When tested at 155 °C, the PP fiber was not melted and the rigid PP fiber molecular contributed to the highest elasticity. Particularly, at 170 °C and 190 °C, the neat OBCs almost show the same elastic modulus. After blending with PP fibers, the composites tested at 170 °C exhibited more obvious reinforcing effect than that at 190 °C, which may be attributed to the oriented PP chains in the partially melted sample. Fig. 6(b) illustrates the plot of tan δ vs. angular frequency, which represents the damping characteristic of the composites. The plot reveals a considerable decrease after the incorporation of PP fibers. Special consideration should be paid to the similar damping behavior of the composites tested at 155 °C and 170 °C. Because a part of the oriented PP molecules had already relaxed at 170 °C, better adhesion enhances the interaction between OBC and PP, which restricts the molecular mobility of the OBC chains in the melt and further decreased tan δ value. This effect to some extent compensates for the reduction in strength caused by PP molecular relaxation.
image file: c4ra06548d-f6.tif
Fig. 6 Storage modulus (a) and tan[thin space (1/6-em)]δ (b) vs. angular frequency for OBC/PP fiber composites at different temperatures.

3.6 Fiber morphology and orientation

Fig. 7 shows the SEM images of the cross-section of the injection molded specimens perpendicular to the flow direction. The fibers in OBC-10PP-155 maintained their original morphology across the entire cross-section and failed to melt at all. Although transcrystallinity appeared in the single fiber mode under mild conditions, the interfacial adhesion was still too weak to resist the swelling effect of xylene and clear debonding gaps appeared at the interface of fiber and matrix. This proved that tiny voids may exist at matrix/fiber interface. In contrast, when molded at 190 °C, PP fibers were completely melted and the molted PP transformed into more delicate structure of microfibers and no cracks at the surface of microfibers were observed. Normally, when the fibers are heated to a temperature higher than 175 °C, the fibers shrink and may form spherical or ellipsoidal particles. However, in the cylinder of the mini-jet machine, the fibers were in a constrained state. Even when they were heated to 190 °C, the fibril structures were retained. During the injection process, the fibers were in the constraint state all the time. Because of the shear stretch effect, the fibers finally turn into more tiny microfibrils with several microns. Although they had the fibril morphology, the internal crystal structure of the original PP fibers was destroyed and the strength of the PP phase would decrease. For OBC-10PP-170, fibers in the skin area did not completely retain the original morphology and the shape deformed to some extent when the injection pressure was imposed, exhibiting partially melting characteristic, as confirmed by the DSC test. In addition, no obvious defects were observed at the interface of the partially melted fiber and matrix.
image file: c4ra06548d-f7.tif
Fig. 7 Cross-section of the fractured surface perpendicular to flow direction in OBC-10PP-155, (a1) skin area (a2) core area; OBC-10PP-170, (b1) skin area and (b2) core area; OBC-10PP-190, (c1) skin area (c2) core area.

In the core area, PP fibers were completely melted and the morphology was similar to that in OBC-10PP-190 composites.

Fig. 8 exhibits the fracture surface of the skin regions parallel to the flow direction. Clearly, in OBC-10PP-155, PP fibers were pulled out from the matrix and the smooth surface indicated poor interfacial adhesion. For the partially melted fibers in OBC-10PP-170, the diameter of the fibers became larger than 50 μm with a rougher surface due to molecular relaxation. The fibers were inserted into the matrix and no cracks appeared along the interface. For OBC-10PP-190, the subsize microfibrils and matrix show a blurred interface.


image file: c4ra06548d-f8.tif
Fig. 8 Fracture surface of the skin regions parallel to flow direction in (a) OBC-10PP-155 (b) OBC-10PP-170 (c) OBC-10PP-190.

It has been reported that the soft segment of OBCs is expected to be partially miscible with the amorphous region of iPP.41 Here, when the injection temperature (155 °C) was below the melting point of PP, all the PP chains were confined in the crystal lattice of the solid fibers, showing poor miscibility with the OBC matrix.

Although the fibers retained their original strength and modulus, OBC-10PP-155 still showed undesirable mechanical properties because of poor interactions. However for OBC-10PP-170 and OBC-10PP-190, regardless of whether PP fibers were partially melted or completely melted, the PP relaxed molecules were interfused with OBC chains, and such kind of chain-entanglement dramatically enhanced the miscibility between the matrix and PP phase, as confirmed by the blurred interface. Therefore, strong interfacial bonding would be achieved at two temperatures. The results are in accordance with the X values.

The orientation degree of polymers can help in better understanding their dispersion states, and for calculating PP orientation function, the following formulas were used:

 
f = [(R − 1)/(R + 2)/[3[thin space (1/6-em)]cos2[thin space (1/6-em)]α − 1]/2] (7)
 
R = A/A (8)
where A and A are the parallel and perpendicular absorbance, respectively, and α is the angle between the dipole moment vector and the local chain axis. Typical FTIR spectra machine and transverse directions for the composites are shown in Fig. 8(a) and (b), respectively. The peak at 841 cm−1 was associated with the PP crystalline phase and the peak at 998 cm−1 was assigned to both these crystalline and amorphous phases of PP. Here, the orientation function was calculated using 998 cm−1, for which the value of α was taken as 18°.60 The FTIR spectra indicate that the different molten state of PP fiber corresponds to different orientation behaviors. The orientation functions of PP in the composites are shown in Fig. 8(c). PP in the core area failed to orient due to the absence of shear field. PP orientation in the skin area of the three samples differs significantly according to the following order: OBC-10PP-170 > OBC-10PP-190 > OBC-10PP-155 (Fig. 9).


image file: c4ra06548d-f9.tif
Fig. 9 Polarized FTIR spectra of OBC-10PP-155, OBC-10PP-170 and OBC-10PP-190 in machine (SM) and transverse (ST) directions: (a) skin area and (b) core area; (c) corresponding orientation function in the three composites.

To determine the possible factor influencing the orientation, the complex viscosities of the samples tested at three different temperatures is shown in Fig. 10. Complex viscosity is a frequency-dependent viscosity function determined during the forced harmonic oscillation of shear stress. It can reflect the processing fluidity of the melt to some extent. It is clear that because of the solid PP fiber, the complex viscosity of OBC-10PP-155 is higher than the other two blends processed at 170 °C and 190 °C. The extremely high complex viscosity hindered the PP fibers from orienting according to the external shear field. In contrast, for OBC-10PP-190, complex viscosity was even lower than OBC-155, showing improved processability. Thus, the liquid PP phase was more likely to orient along the shear field under the injection pressure. Although OBC-10PP-170 displayed higher complex viscosity than OBC-10PP-190, its orientation was expected to be lower than the latter based on the above mentioned explanation. However, it should be noted that in the skin layer of OBC-10PP-170, PP fibers were only partially melted and the PP molecule chains already maintained a relatively high orientation degree before injection molding. After orienting along the shear field, the PP chains would exhibit higher orientation degree than OBC-10PP-190 with completely relaxed PP phase. The higher orientation function of the fibers with relatively high strength and modulus make OBC-10PP-170 possess better mechanical properties than OBC-10PP-190, of which the PP chains were fully disoriented and the strength and modulus of PP deceased dramatically.


image file: c4ra06548d-f10.tif
Fig. 10 Complex viscosities for neat OBC and the composites tested at three different temperatures.

Summarizing the above analysis, Fig. 11 schematically illustrates the three different structures that determine the final properties, in which the skin areas are enlarged. For OBC10-PP-155, the interactions between the matrix and fibers are weak and the random distribution of PP fibers failed to effectively improve the OBC properties despite the fibers retaining their original strength. Completely melted PP fibers in OBC-10PP-190 realized fully interacted molecules of the two polymers. However, the completely disoriented fibers lost their original strength and modulus, and the reinforcing effect was not satisfactory. OBC10-PP-170 obtains the balanced interfacial interaction and fiber strength. The completely melted fibers inside the specimen and partly melted fibers (the enlarge part in Fig. 11(b)) outside the specimen guaranteed the entanglement of matrix and PP molecules and enhance the miscibility between the two polymers. In addition, the crystal structures in the partially melted fibers were retained, making them suitable as appreciably reinforcing skeleton with relatively high strength.


image file: c4ra06548d-f11.tif
Fig. 11 Structure models of composites injection molded at different temperatures (a) OBC-10PP-155 (b) OBC-10PP-170 (c) OBC-10PP-190.

5. Conclusion

PP fiber reinforced OBCs were successfully prepared by internal mixing and mini-injection molding. By differing injection temperatures, three PP fiber states namely unmelted, partially melted and completely melted were achieved (proved by DSC result). When processed at 170 °C, PP fibers were partially melted in the skin area whereas completely melted in the core area with more delicate morphology. The unique structure endows the composite with the best tensile performance. OBC-10PP-155 and OBC-10PP-190 exhibited less prominent reinforcing effect either for poor interfacial adhesion or completely relaxed PP fiber. Two key factors: interfacial adhesion and PP fiber strength were fully characterized to explain the discrepancy. Particularly, when investigating the interfacial bonding, transcrystalline (TC) structure was traced for the first time at OBC elastomer and PP fiber interface. The phenomenon was more pronounced with thicker TC layers when PP molecules were relaxed. This interesting result may require further investigation to fully explore the TC structures between elastomer and fibers, which may help better understand interfacial interactions.

Acknowledgements

This work was supported by the National Natural Science Foundation of China (51121001 and 51210005) and the Special Funds for Major State Basic Research Projects of China (2011CB606006).

Notes and references

  1. Z. Z. Tong, J. Huang, B. Zhou, J. T. Xu and Z. Q. Fan, Macromol. Chem. Phys., 2013, 214, 605–616 CrossRef CAS.
  2. F. Zuo, Y. Mao, X. Li, C. Burger and B. Hsiao, Macromolecules, 2011, 44, 3670–3673 CrossRef CAS.
  3. P. S. Chum and K. W. Swogger, Prog. Polym. Sci., 2008, 33, 797–819 CrossRef CAS PubMed.
  4. D. J. Arriola, E. M. Carnahan, P. D. Hustad, R. L. Kuhlman and T. T. Wenzel, Science, 2006, 312, 714–719 CrossRef CAS PubMed.
  5. D. U. Khariwala, A. Taha, S. P. Chum, A. Hiltner and E. Baer, Polymer, 2008, 49, 1365–1375 CrossRef CAS PubMed.
  6. H. P. Wang, D. U. Khariwala, W. Cheung, S. P. Chum, A. Hiltner and E. Baer, Macromolecules, 2007, 40, 2852–2862 CrossRef CAS.
  7. H. E. Park and J. M. Dealy, Macromolecules, 2010, 43, 6789–6799 CrossRef CAS.
  8. C. Shan and L. G. Hazlitt, Macromol. Symp., 2007, 257, 80–93 CrossRef CAS.
  9. H. P. Wang, S. P. Chum, A. Hiltner and E. Baer, J. Polym. Sci., Part B: Polym. Phys., 2009, 47, 1313–1330 CrossRef CAS.
  10. H. P. Wang, S. P. Chum, A. Hiltner and E. Baer, J. Appl. Polym. Sci., 2009, 113, 3236–3244 CrossRef CAS.
  11. G. Liu, Y. Guan, T. Wen, X. Wang, X. Zhang, D. Wang, X. Li, J. Loos, H. Chen, K. Walton and G. Marchand, Polymer, 2011, 52, 5221–5230 CrossRef CAS PubMed.
  12. S. Li and R. A. Register, Macromolecules, 2012, 45, 5773–5781 CrossRef CAS.
  13. F. Zuo, C. Burger, X. Chen, Y. Mao and B. Hsiao, Macromolecules, 2010, 43, 1922–1929 CrossRef CAS.
  14. J. Jin, C. Zhao, J. Du and C. C. Han, Macromolecules, 2011, 44, 4326–4334 CrossRef CAS.
  15. T. Wen, G. Liu, Y. Zhou, X. Zhang, F. Wang, H. Chen, J. Loos and D. Wang, Macromolecules, 2012, 45, 5979–5985 CrossRef CAS.
  16. J. Jin, J. Du, H. Chen and C. C. Han, Polymer, 2011, 52, 6161–6172 CrossRef CAS PubMed.
  17. T. Wen, Y. Zhou, G. Liu, F. Wang, X. Zhang, D. Wang, H. Chen, K. Walton, G. Marchand and J. Loos, Polymer, 2012, 53, 529–535 CrossRef CAS PubMed.
  18. G. Liu, X. Zhang, Y. Liu, X. Li, H. Chen, K. Walton, G. Marchand and D. Wang, Polymer, 2013, 54, 1440–1447 CrossRef CAS PubMed.
  19. A. R. Kamdar, R. K. Ayyer, B. C. Poon, G. R. Marchand, A. Hiltner and E. Baer, Polymer, 2009, 50, 3319–3328 CrossRef CAS PubMed.
  20. Y. Lin, G. R. Marchand, A. Hiltner and E. Baer, Polymer, 2011, 52, 1635–1644 CrossRef CAS PubMed.
  21. P. Dias, Y. J. Lin, B. Poon, H. Y. Chen, A. Hiltner and E. Baer, Polymer, 2008, 49, 2937–2946 CrossRef CAS PubMed.
  22. J. Jin, H. Chen, M. Muthukumar and C. C. Han, Polymer, 2013, 54, 4010–4016 CrossRef CAS PubMed.
  23. G. S. Shibulal and K. Naskar, eXPRESS Polym. Lett, 2012, 6, 329–344 CrossRef CAS.
  24. S. Wu, H. Li, G. Huang and J. Wu, RSC Adv., 2014, 4, 19024–19033 RSC.
  25. Z. Z. Tong, B. Zhou, J. Huang, J. T. Xu and Z. Q. Fan, RSC Adv., 2014, 4, 15678–15688 RSC.
  26. Z. Z. Tong, B. Zhou, J. Huang, J. T. Xu and Z. Q. Fan, Compos. Sci. Technol., 2013, 85, 111–117 CrossRef CAS PubMed.
  27. M. A. Manchado, J. Biagitti and J. M. Kenny, Polym. Compos., 2002, 23, 779–789 CrossRef.
  28. I. Choi and D. G. Lee, Composites, Part A, 2013, 48, 1–8 CrossRef CAS PubMed.
  29. A. Kalapakdee and T. Amornsakchai, Polym. Test., 2014, 37, 36–44 CrossRef CAS PubMed.
  30. C. Hintze, R. Stocek, T. Horst, R. Jurk, S. Wiessner and G. Heinrich, Polym. Eng. Sci., 2014 DOI:10.1002/pen.23854.
  31. J. Gao, Y. Dai, X. Wang, J. Huang, J. Yao, J. Yang and X. Liu, Appl. Surf. Sci., 2013, 270, 627–633 CrossRef CAS PubMed.
  32. A. Chantaratcharoen, C. Sirisinha1, T. Amornsakchai1, S. Bualek-Limcharoen1 and W. Meesiri, J. Appl. Polym. Sci., 1999, 10, 2414–2422 CrossRef.
  33. S. Zhao, L. Cheng, Y. Guo, Y. Zheng and B. Li, Mater. Des., 2012, 35, 749–753 CrossRef CAS PubMed.
  34. Y. A. El-Shekeil, S. M. Sapuan, K. Abdan and E. S. Zainudin, Mater. Des., 2012, 40, 299–303 CrossRef CAS PubMed.
  35. Z. Dong, M. Liu, D. Jia and Y. Zhou, Chin. J. Polym. Sci., 2013, 31, 1127–1138 CrossRef CAS.
  36. M. Abdelmouleh, S. Boufi, M. N. Belgacem and A. Dufresne, Compos. Sci. Technol., 2007, 67, 1627–1639 CrossRef CAS PubMed.
  37. S. Jiang, A. Greiner and S. Agarwal, Compos. Sci. Technol., 2013, 87, 164–169 CrossRef CAS PubMed.
  38. S. M. Sapuan, H. Y. Lok, M. R. Ishak and S. Misri, Chin. J. Polym. Sci., 2013, 10, 1394–1403 CrossRef PubMed.
  39. G. S. Shibulal and K. Naskar, Polym. Compos., 2013, 35, 1767–1778 CrossRef.
  40. G. Liu, X. Zhang, X. Li, H. Chen, K. Walton and D. Wang, J. Appl. Polym. Sci., 2012, 125, 666–675 CrossRef CAS.
  41. G. Liu, X. Zhang, X. Li, H. Chen, K. Walton and D. Wang, J. Appl. Polym. Sci., 2011, 119, 3591–3597 CrossRef CAS.
  42. R. Su, Z. Li, H. Bai, K. Wang, Q. Zhang, Q. Fu, Z. Zhang and Y. Men, Polymer, 2011, 52, 3655–3660 CrossRef CAS PubMed.
  43. B. Na, K. Wang, P. Zhao, Q. Zhang, R. Du, Q. Fu, Z. Yu and E. Chen, Polymer, 2005, 46, 5258–5267 CrossRef CAS PubMed.
  44. R. Su, K. Jiang, Y. Ge, S. Hu, Z. Li, X. Li, K. Wang, Q. Zhang, Q. Fu and F. Yang, Polym. Int., 2011, 60, 1655–1662 CrossRef CAS.
  45. J. Wang, Q. Mao and J. Chen, J. Appl. Polym. Sci., 2013, 130, 2176–2183 CrossRef CAS.
  46. N. M. Barkoula and T. Peijs, Polym. Compos., 2005, 26, 114–120 CrossRef CAS.
  47. J. Ye, T. Hasegawa and A. Suzuki, J. Appl. Polym. Sci., 2006, 100, 1306–1311 CrossRef CAS.
  48. V. Caldas, G. R. Brown, R. S. Nohr and J. G. Macdonald, J. Polym. Sci., Part B: Polym. Phys., 1996, 34, 2085–2098 CrossRef CAS.
  49. T. N. Abraham, S. D. Wanjale, T. Bárány and J. Karger-Kocsis, Composites, Part A, 2009, 40, 662–668 CrossRef PubMed.
  50. N. Ning, S. Fu, W. Zhang, F. Chen, K. Wang, H. Deng, Q. Zhang and Q. Fu, Prog. Polym. Sci., 2012, 37, 1425–1455 CrossRef CAS PubMed.
  51. M. Zhou, J. Yan, Y. Li, C. Geng, C. He, K. Wang and Q. Fu, RSC Adv., 2013, 3, 26418–26426 RSC.
  52. C. K. Moon, J. Appl. Polym. Sci., 1998, 67, 1191–1197 CrossRef CAS.
  53. S. Ju, Y. Wang, G. Huang and J. Chang, RSC Adv, 2013, 3, 8298–8307 RSC.
  54. E. Białecka-Florjańczyk, J. Phys. Chem. B, 2006, 110, 2582–2592 CrossRef PubMed.
  55. M. Khayet, G. Chowdhury and T. Matsuura, AIChE J., 2002, 48, 3833–3843 Search PubMed.
  56. C. Han and S. Chun, Macromolecules, 1998, 31, 394–402 CrossRef CAS.
  57. Z. Horvath, B. Gyar mati, A. Menyhard and P. Doshev, RSC Adv., 2014, 4, 19737–19745 RSC.
  58. M. Bailly and M. Kontopoulou, Polymer, 2009, 50, 2472–2480 CrossRef CAS PubMed.
  59. Y. Tang and M. Lewin, Polym. Adv. Technol., 2009, 20, 1–15 CrossRef CAS.
  60. R. Su, K. Wang, Q. Zhang, F. Chen and Q. Fu, J. Phys. Chem. B, 2009, 113, 7423–7429 CrossRef CAS PubMed.

This journal is © The Royal Society of Chemistry 2014
Click here to see how this site uses Cookies. View our privacy policy here.