Synthesis, structure, characterization and photophysical properties of copper(I) complexes containing polypyridyl ligands†
Alberto Báez-Castroa,
Jesús Baldenebro-Lópeza,
Adriana Cruz-Enríqueza,
Herbert Höpflb,
Daniel Glossman-Mitnikc,
Miranda-Soto Valentínd,
Miguel Parra-Hake*d and
José J. Campos-Gaxiola*a
aFacultad de Ingeniería Mochis, Universidad Autónoma de Sinaloa, Fuente de Poseidón y Prol. A. Flores S/N, C.P. 81223, C.U. Los Mochis, Sinaloa, México. E-mail: gaxiolajose@uas.edu.mx; Fax: +52 668 8127641; Tel: +52 668 8127641
bCentro de Investigaciones Químicas, Universidad Autónoma del Estado de Morelos, Av. Universidad 1001, C.P. 62209, Cuernavaca, Morelos, México. E-mail: hhopfl@uaem.mx; Fax: +52 777 3297997; Tel: +52 777 3297997
cCentro de Investigación en Materiales Avanzados, S.C., Miguel de Cervantes 120, Complejo Industrial Chihuahua, Chihuahua 31190, México
dCentro de Graduados e Investigación, Instituto Tecnológico de Tijuana, Apartado Postal 1166, C.P. 22000, Tijuana, Baja California, México. E-mail: miguelhake@yahoo.com; Fax: +52 664 623 40 43; Tel: +52 664 623 37 72
First published on 28th August 2014
Abstract
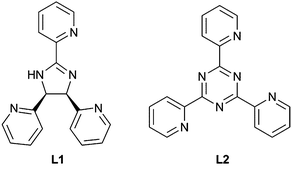
Two novel photoluminescent copper(I) complexes having the compositions [CuI(L1)(PPh3)2]NO3·3CHCl3(1) and [CuI(L2)(PPh3)2]NO3·H2O(2) with PPh3 = triphenylphosphine, L1 = cis-(±)-2-(2,5-di(pyridin-2-yl)-4,5-dihydro-1H-imidazol-4-yl)pyridine and L2 = 2,4,6-tris(2-pyridyl)triazine have been successfully synthesized and characterized by IR and 1H-NMR spectroscopy, FAB+ mass spectrometry and single-crystal X-ray diffraction analysis. Both complexes showed interesting photophysical properties, which were studied experimentally in solution and in the solid state by UV-Vis and fluorescence spectroscopy and theoretically using TD-DFT calculations.
Introduction
In the past decades, inorganic photochemistry has focused on molecular systems that possess low-lying metal-to-ligand charge transfer excited states capable of electron and energy transfer. In this context, ruthenium(II), osmium(II), and rhenium(II) complexes have received special attention because of their fascinating properties and potential applications for chemical sensing, display devices, probes of biological processes, phototherapy, and solar energy conversion schemes.1,2At the same time, the strong appealing possibility of using costless and nontoxic metals such as copper or zinc, as substitutes of the above-mentioned more expensive heavy metal ions, has stimulated further research in this field.3 Copper(I) forms pseudotetrahedral complexes with polypyridine ligands. A few coordination polymers of Cu(I) and mixed-valence Cu(I)–Cu(II) complexes of 2,4,6-tris(2-pyridyl)triazine (L2) with a four coordinated metal center have been reported.4 There is a number of complexes which are susceptible of fluorescent light emission. Cu(I) complexes prepared from phosphines and polypyridine ligands were first studied more than three decades ago, which resulted potentially useful as sensors due to their long lifetimes upon light excitation.
We are interested in exploring the coordination chemistry of Cu(I) complexes with phosphines and polypyridine ligands because of their promising photoluminescence properties and intriguing coordination architectures.3,5
In previous studies regarding the coordination behaviour of polypyridyl ligands, we analysed the influence of non-covalent interactions on the supramolecular structure of metal complexes.6 In this contribution, we report on two new Cu(I) complexes with triphenylphosphine and cis-(±)-2,4,5-tris(2-pyridyl)imidazoline (L1) and 2,4,6-tris(2-pyridyl)triazine (L2) ligands for which we explored their photophysical properties, both experimentally and theoretically.
Experimental
Materials and methods
All chemicals including ligand L2 were purchased from Aldrich and used as received without further purification. Complex 1 was synthetized under argon atmosphere with solvents purified according to reported methodologies,7 stored and manipulated under inert atmosphere by Schlenk techniques. Complex 2 was prepared under normal environment conditions. In both cases, phosphine ligands play a crucial role in the stabilization of the complexes.8 The starting complex[Cu(PPh3)2(NO3)] was synthesized by a previously reported methodology.9 The synthesis and spectroscopic data for L1 have been reported elsewhere.10 Infrared spectra (KBr) were measured on a Bruker Alpha Tensor 27 spectrophotometer using KBr pellets in the 4000–500 cm−1 region. Thermogravimetrtic analyses were performed under nitrogen (50 mL min−1) in the temperature range of 30–1000 °C (10 °C min−1) using a TA SDT Q600 apparatus. 1H and 31P{1H} NMR spectra were recorded with Varian 400 and 500 NMR instruments. Chemical shifts are reported in ppm and were referenced to residual solvent resonances. HR-FAB+ mass-spectrometric studies were carried out on a JMS-700 MSTATION JEOL equipment. UV-Vis absorption spectra were recorded on a Shimadzu UV-1800 UV spectrophotometer. Emission spectra in solution and in the solid state were obtained on a Perkin Elmer LS-55 fluorescence spectrophotometer. Single-crystal X-ray structures were determined on a Bruker-APEX diffractometer equipped with a CCD area detector (λMo-Kα = 0.71073 Å, monochromator: graphite). Frames were collected via ω/ϕ-rotation at 10 s per frame (SMART).11 The measured intensities were reduced to F2 and corrected for absorption with SADABS (SAINT-NT).12 Corrections were made for Lorentz and polarization effects. Structure solution, refinement and data output were carried out with the SHELXTL-NT program package.13 Non hydrogen atoms were placed in geometrically calculated positions using a riding model. The asymmetric compound 1 contains three CHCl3 molecules, one of which is disordered over two positions. The N–H hydrogen atom has been localized by difference Fourier maps, whereupon the N–H distance has been fixed to 0.860 Å, but the coordinates have been freely refined. The N(H) atom has approximate sp3 hybridization. Figures were created with ORTEP14 and MERCURY.15Preparation of [CuI(L1)(PPh3)2]NO3·3CHCl3 (1)
[Cu(PPh3)2(NO3)] (0.210 g, 0.33 mmol) and cis-(±)2-(2,5-di(pyridin-2-yl)-4,5-dihydro-1H-imidazol-4-yl)pyridine (L1) (0.100 g, 0.33 mmol) were dissolved in dry dichloromethane (3 mL) under argon atmosphere to obtain a yellow solution. The solution was stirred for 3 h at room temperature, and then concentrated to 1 mL under reduced pressure whereupon diethyl ether (3 mL) was added to obtain an orange microcrystalline solid. The product was filtered, washed with diethyl ether (2 × 3 mL) and dried under vacuum (0.28 g, 89%). The crude solid product was recrystallized by vapor diffusion of pentane into a concentrated solution of 1 in chloroform. IR (KBr): 3168, 3047, 3012, 2857, 1583, 1522, 1475, 1433, 1381, 1325, 1093, 746, 696 cm−1. 1H NMR (CDCl3, 399.7 MHz): resonances of L1 are slightly broad while two of the three phosphine resonances are sharp; δ 9.60 (br s, NH, 1H), 8.85 (slbr s, 1H), 8.16 (slbr m, 1H), 8.12 (slbr s, 2H), 7.98 (slbr m, 1H), 7.33 (t, J = 7.2 Hz, 8H, there is a small peak hidden by this resonance), 7.28 (slbr s, 1H), 7.18 (t, 7.6 Hz, 12H), 7.02 (br m, 12H), 6.82 (slbr m, 1H), 6.66 (slbr s, 2H), 6.56 (slbr s, 1H), 5.66 (slbr s, 2H). 31P {1H} NMR (CDCl3, 161.8 MHz): δ 0.49 (broad s, PPh3). MS [FAB+, m/z]: 951 [M + H]+, 689 [(M + H) − PPh3]+, 626 [M − PPh3 − NO3]+, 549 [M − PPh3 − Ph − NO3]+ 364 [M − 2PPh3 − NO3]+, 286 [M − 2PPh3 − Py − NO3]+. Exact mass-FAB(HR-FAB+) calcd for C54H46O3N6P2Cu [M + H]+, 951.2403, found: 951.2316.Preparation of [CuI(L2)(PPh3)2]NO3·H2O (2)
To a stirring solution of [Cu(PPh3)2(NO3)] (0.208 g, 0.32 mmol) in chloroform (4 mL) under argon was added 2,4,6-tris(2-pyridyl)triazine (0.100 g, 0.32 mmol) to give a dark red solution. The resulting mixture was stirred over a period of 3 h and then filtered. The filtrate was concentrated (3 mL) and red single crystals were obtained by vapour diffusion of diethyl ether into the solution (0.12 g, 39%). IR (KBr): 3057, 1584, 1476, 1435, 1375 cm−1. 1H NMR (CDCl3, 499.9 MHz): resonances of L2 are slightly broad; δ 8.91 (br d, J = 6.1 Hz, 3H), 8.04 (br m, 3H), 7.62–7.78 (m, 3H), 7.39–7.51 (br m, 3H), 7.32 (t, J = 7.2 Hz, 6H), 7.15 (t, J = 7.4 Hz, 12H), 7.09 (slbr m, 12H). 31P {1H} NMR (CDCl3, 202.3 MHz), selected resonance for the main species: δ 1.91 (broad s, PPh3), other minor unidentified species are present. MS [FAB+, m/z]: 899 [M − NO3]+, 637 [M − PPh3 − NO3]+, 485 [M − 2Ph − PPh3 − NO3]+. Exact mass-FAB+(HR-FAB+) calcd for C36H27CuN6P [M − NO3 − PPh3]+, 637.1331, found: 637.1918.Computational details
DFT structure calculations were performed with the Gaussian 09 package.16 Minimum energy structures were calculated and confirmed through a frequency calculation (no imaginary frequencies).17 The transitions between the different orbitals were evaluated with time-dependent (TD) DFT,18 using the M06 hybrid-meta-GGA functional19 combined with the 6-31G(d)20 basis set for atoms C, H, N and P, and the DZVP21 basis set for the Cu atom. The effects of a solvated environment were evaluated with the integral equation formalism for the polarizable continuum model (IEF-PCM) and the implementation of the non-equilibrium solvation model.22 The solvents considered for this analysis were dichloromethane and chloroform.Results and discussion
Combination of bis(triphenylphosphine)copper(I) nitrate with cis-(±)2-(2,5-di(pyridin-2-yl)-4,5-dihydro-1H-imidazol-4-yl)pyridine (L1) or 2,4,6-tris(2-pyridyl)triazine (L2), provided Cu(I) complexes of compositions [CuI(L1)(PPh3)2]NO3·3CHCl3 (1) and [CuI(L2)(PPh3)2]NO3·H2O (2). Both complexes have been characterized by IR and 1H-NMR spectroscopy, FAB+ mass spectrometry and single-crystal X-ray diffraction analysis.In the IR spectrum of complex 1, the intense band at 3168 cm−1 is assigned to the stretching vibration of the N–H group. The absorptions at 3047 and 3012 cm−1 are characteristic of the C–H aromatic and aliphatic stretching vibrations, respectively, while the bands in the region of 1522–1475 cm−1 can be assigned to the C![[double bond, length as m-dash]](https://www.rsc.org/images/entities/char_e001.gif) N and C
N and C![[double bond, length as m-dash]](https://www.rsc.org/images/entities/char_e001.gif) C stretching vibrations of the pyridyl substituents. The typical band for the C
C stretching vibrations of the pyridyl substituents. The typical band for the C![[double bond, length as m-dash]](https://www.rsc.org/images/entities/char_e001.gif) N vibration of the central imidazoline ring is located at 1583 cm−1, confirming the presence of ligand L1 in 1. Complex formation is additionally supported by bands at 1433 and 1381 cm−1, which are characteristic for the P–CAr (ref. 23) and N–O stretching vibrations in the phosphine and nitrate ligands, respectively.
N vibration of the central imidazoline ring is located at 1583 cm−1, confirming the presence of ligand L1 in 1. Complex formation is additionally supported by bands at 1433 and 1381 cm−1, which are characteristic for the P–CAr (ref. 23) and N–O stretching vibrations in the phosphine and nitrate ligands, respectively.
The IR spectrum of complex 2, shows a band at 3057 cm−1, characteristic of the C–H aromatic stretching vibrations. The absorptions in the region of 1584–1476 cm−1 can be assigned to the C![[double bond, length as m-dash]](https://www.rsc.org/images/entities/char_e001.gif) N and C
N and C![[double bond, length as m-dash]](https://www.rsc.org/images/entities/char_e001.gif) C vibrations of the pyridyl substituents in L2. As for 1, the absorption at 1435 cm−1 is characteristic for the P–CAr
C vibrations of the pyridyl substituents in L2. As for 1, the absorption at 1435 cm−1 is characteristic for the P–CAr![[thin space (1/6-em)]](https://www.rsc.org/images/entities/char_2009.gif) 23 vibration of the phosphine ligand and the band at 1375 cm−1 is typical of the nitrate counter ion.
23 vibration of the phosphine ligand and the band at 1375 cm−1 is typical of the nitrate counter ion.
The experimental values of the main vibrations in the IR spectra were confirmed by the theoretical results (Tables S1 and S2).†
The 1H NMR spectrum of 1 (Fig. S1 and S2†) showed slightly broad resonances for all hydrogens of L1, while two of the three resonances for the phosphine groups were sharp. For example, resonances in the region 6.50–8.90 ppm are assigned to 42 aromatic hydrogens; the two aliphatic hydrogens in the imidazoline ring appear at 5.66 ppm, whereas the characteristic NH of L1 is observed as a broad singlet at 9.60 ppm and is taken as evidence that the ligand coordinates to the Cu(I) centre as a neutral ligand without deprotonation of the NH group, as revealed by X-ray crystallography (vide infra). Two triplets, assigned to phosphine hydrogens, are observed at 7.18 (J = 7.6 Hz) and 7.33 ppm (J = 7.2 Hz). The 1H NMR spectrum of 2 (Fig. S4†) displays four sets of slightly broad peaks in the region 7.39–9.0 ppm for the 12 aromatic hydrogens in L2 and three sets in the region of 7.02–7.36 ppm for the 30 hydrogens in the phosphine ligands.
In summary, both complexes are fluxional molecules in solution, as revealed by the line broadening observed in 1H NMR. Additional evidence of this behavior was obtained by 31P NMR analysis of 1 and 2 (Fig. S3 and S5†), which showed very broad singlets at 0.49 and 1.91 ppm, respectively.
The FAB+ mass spectrum of complex 1 shows a peak at m/z = 951 for the expected molecular ion [M + H]+; however, for 2 only peaks for fragments are observed, which support the molecular composition of the complex. The mass spectrum of compound 1 shows five additional peaks at m/z = 689, 626, 549, 364 and 286, corresponding to fragments of composition [(M + H) − PPh3]+, [M − PPh3 − NO3]+, [M − PPh3 − Ph − NO3]+, [M − 2PPh3 − NO3]+ and [M − 2PPh3 − Py − NO3]+, respectively. For compound 2, peaks are observed at m/z = 899, 637 and 485, corresponding to fragments of the composition [M − NO3]+, [M − PPh3 − NO3]+ and [M − 2Ph − PPh3 − NO3]+, respectively. The correct assignment of the peaks at m/z = 951 for 1 and m/z = 637 for 2 has been confirmed by high-resolution FAB+ mass spectrometry.
X-ray crystallographic study
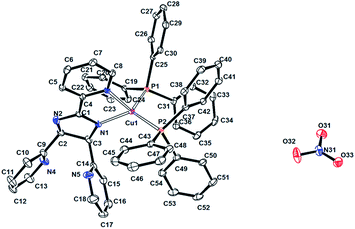
Complexes 1 and 2 were also characterized by single-crystal X-ray diffraction analysis. The most relevant crystallographic data are summarized in Table 1. The molecular structures of 1 and 2 are given in Fig. 1 and 2, respectively. Selected bond lengths and bond angles are given in Table 2, the theoretical values are listed in Table S3.† Hydrogen bonding geometries are listed in Tables S4 and S5.†| Crystal dataa | 1 | 2 |
|---|---|---|
| a λMoKα = 0.71073 Å.b Fo> 4σ(Fo).c R = Σ||Fo| − |Fc||/Σ|Fo|.d All data.e Rw = [Σw(Fo2 − Fc2)2/Σw(Fo2)2]1/2. | ||
| Formula | C57H48Cl9CuN6O3P2 | C54H44CuN7O4P2 |
| Mw (g mol−1) | 1309.55 | 980.44 |
| Crystal system | Monoclinic | Triclinic |
| Space group | P21/n | P![[1 with combining macron]](https://www.rsc.org/images/entities/char_0031_0304.gif) |
| Temp. (K) | 100(2) | 100(2) |
| Crystal size (mm3) | 0.39 × 0.43 × 0.45 | 0.42 × 0.45 × 0.48 |
| a/Å | 16.0948(11) | 10.7485(16) |
| b/Å | 21.1398(15) | 14.948(2) |
| c/Å | 17.9889(12) | 16.371(3) |
| α/° | 90 | 86.290(2) |
| β/° | 100.028(1) | 73.060(2) |
| γ/° | 90 | 70.947(2) |
| V/Å3 | 6027.1(7) | 2377.0(6) |
| Z | 4 | 2 |
| ρcalcd/g cm−3 | 1.443 | 1.370 |
| μ/mm−1 | 0.863 | 0.582 |
| F(000) | 2680 | 1016 |
| θ range for data collection/° | 1.50 to 25.00 | 1.90 to 25.00 |
| Reflections collected | 35![[thin space (1/6-em)]](https://www.rsc.org/images/entities/char_2009.gif) 918 918 |
22![[thin space (1/6-em)]](https://www.rsc.org/images/entities/char_2009.gif) 415 415 |
| Independent reflections | 10![[thin space (1/6-em)]](https://www.rsc.org/images/entities/char_2009.gif) 597 597 |
8341 |
| Observed reflections (I > 2σ (I) | 9201 | 7641 |
| R(int) | 0.032 | 0.036 |
| R1[I > 2σ(I)]b,c | 0.0631 | 0.0529 |
| wR2[I > 2σ(I)] | 0.1588 | 0.1285 |
| R1 (all data)wd,e | 0.0716 | 0.0583 |
| wR2 [all data] | 0.1650 | 0.1316 |
| Goof (F2) | 1.027 | 1.135 |
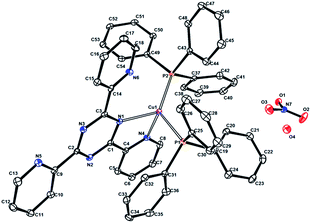 | ||
| Fig. 2 Perspective view of the molecular structure of compound 2. Hydrogen atoms have been omitted for clarity. The displacement ellipsoids are shown at 30% probability level. | ||
| 1 | |
|---|---|
| Cu(1)–N(1) | 2.023(3) |
| Cu(1)–N(3) | 2.135(3) |
| Cu(1)–P(1) | 2.2482(10) |
| Cu(1)–P(2) | 2.2264(11) |
| N(1)–Cu(1)–N(3) | 80.05(12) |
| N(1)–Cu(1)–P(2) | 128.24(10) |
| N(3)–Cu(1)–P(2) | 108.30(9) |
| N(1)–Cu(1)–P(1) | 106.32(9) |
| N(3)–Cu(1)–P(1) | 113.87(9) |
| P(2)–Cu(1)–P(1) | 115.02(4) |
| 2 | |
|---|---|
| Cu(1)–N(1) | 2.106(2) |
| Cu(1)–N(4) | 2.137(2) |
| Cu(1)–P(1) | 2.3032(8) |
| Cu(1)–P(2) | 2.2597(8) |
| N(4)–Cu(1)–N(1) | 78.22(9) |
| N(4)–Cu(1)–P(2) | 113.55(7) |
| N(1)–Cu(1)–P(2) | 125.95(6) |
| N(4)–Cu(1)–P(1) | 97.87(7) |
| N(1)–Cu(1)–P(1) | 99.93(6) |
| P(2)–Cu(1)–P(1) | 127.66(3) |
The X-ray crystallographic studies revealed that both complexes are composed of one copper(I) atom as metal centre, one polypyridine ligand, two triphenylphosphine molecules, one nitrate counterion and a varying number of uncoordinated solvent molecules (three CHCl3 for 1 and one H2O for 2).
In both samples, the Cu(I) atoms are embedded in N2P2 environments, resulting from coordination by the triphenylphosphine co-ligands and two N atoms from the neutral form of the tris-pyridine ligands, which adopted a bidentate coordination mode by bonding with one of the pyridyl substituents and one of the imidazoline or triazine nitrogens, respectively. Thus, five-membered Cu–N–C–C–N chelate rings are observed in the molecular structures. The Cu–N bond lengths are in the range of 2.023–2.137 Å, similar to the distances reported previously for [Cu(pbb)(DPPMB)][BF4]; pbb = 2-(2′-pyridyl)benzimidazolylbenzene, DPPMB = bis-(diphenylphosphinomethyl)diphenylborate.3a
The crystallographic study revealed that 1 crystallized in a monoclinic crystal system with the space group P21/n. The asymmetric unit contains the [Cu(L1)(PPh3)2]+ cation, one NO3− anion and three chloroform molecules. The copper atom in 1 has a distorted tetrahedral coordination environment (τ4 = 0.83),24 with Cu–N and Cu–P bond lengths in the range of 2.023(3) to 2.2482(10) Å. The bond angles range from 80.05(12) to 128.24(10)°, of which the smallest value corresponds to the five-membered chelate ring formed with the polypyridine ligand and the largest to the P–Cu–P bond angle formed with the sterically hindered PPh3 ligand. Compound 2 crystallized in a triclinic crystal system with space group P![[1 with combining macron]](https://www.rsc.org/images/entities/char_0031_0304.gif) . The asymmetric unit contains the [Cu(L2)(PPh3)2]+ cation, one NO3− anion and one water molecule. In contrast with 1, the Cu atom in 2 is embedded in a four-coordinate coordination polyhedron with a distorted trigonal pyramidal coordination geometry (τ4 = 0.7545).24 The Cu–N and Cu–P bond lengths are in the range of 2.137(2)–2.3032(8) Å. The bond angles vary from 78.22(9) to 127.66(3)°.
. The asymmetric unit contains the [Cu(L2)(PPh3)2]+ cation, one NO3− anion and one water molecule. In contrast with 1, the Cu atom in 2 is embedded in a four-coordinate coordination polyhedron with a distorted trigonal pyramidal coordination geometry (τ4 = 0.7545).24 The Cu–N and Cu–P bond lengths are in the range of 2.137(2)–2.3032(8) Å. The bond angles vary from 78.22(9) to 127.66(3)°.
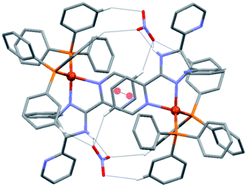
A close inspection of the crystal structure of 1 reveals the presence of dimeric units of composition {[Cu(L1)(PPh3)2][NO3]}2, in which the cations are linked through intermolecular π–π interactions between the metal-coordinated 2-(2-pyridyl) of ligand L1 (centroid⋯centroid = 3.744 Å),25 and a series of four C–H⋯O and two N–H⋯O hydrogen bonding interactions formed with the intermediate uncoordinated nitrate ions (Fig. 3).
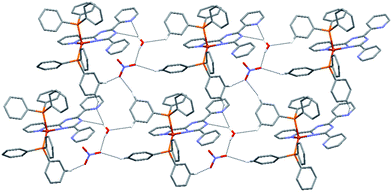
These dimeric units are further arranged into one-dimensional (1D) chains along c through intermolecular C–H⋯N contacts formed by interactions between two H atoms of the pendant pyridyl rings and the nitrogen atoms of the two uncoordinated pyridyl groups (Fig. 4). The geometric details of these supramolecular interactions are summarized in Table S4.† All intermolecular distances and angles are within the expected range.26,27
 | ||
| Fig. 4 1D hydrogen-bonded chains in the crystal structure of 1, formed through C–H⋯N interactions. Hydrogen atoms not involved in hydrogen bonding interactions have been omitted for clarity. | ||
As shown in Fig. 5, in the crystal structure of complex 2 a 2D supramolecular network is formed through a total of one O–H⋯O, two O–H⋯N, four C–H⋯O and one C–H⋯N hydrogen bonds, in which the NO3− anions and solvate H2O molecules interconnect the [CuI(L2)(PPh3)2]+ cations. Of these, the O–H⋯O interactions are formed between water molecules and nitrate ions; the O–H⋯N interactions are the result of interactions between water molecules and nitrogen atoms of the central triazine and pyridyl rings. As for complex 1, the C–H⋯O interactions are formed between the H atoms of the pyridyl rings and the nitrate oxygen atoms. Finally, between neighbouring phenyl and uncoordinated pyridyl rings C–H⋯N intermolecular interactions are observed. The details of these supramolecular interactions are summarized in Table S5.† All intermolecular distances and angles are within the range found in previously reported structures.26,27
Photophysical properties
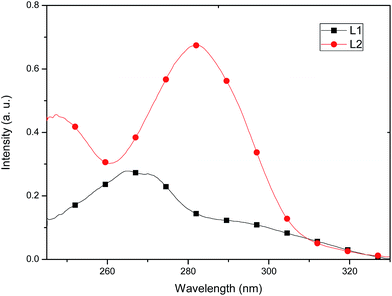
The absorption and emission spectra of the free ligands and their respective Cu(I) complexes were measured in CH2Cl2 at room temperature. The free ligands display multiple absorption bands in the UV region (<330 nm), due to ligand-centered π–π* transitions. λmax for L1 is located at 265 nm (ε = 13![[thin space (1/6-em)]](https://www.rsc.org/images/entities/char_2009.gif) 900) and λmax for L2 at 282 nm (ε = 33
900) and λmax for L2 at 282 nm (ε = 33![[thin space (1/6-em)]](https://www.rsc.org/images/entities/char_2009.gif) 700), see Fig. 6.
700), see Fig. 6.
Both complexes show two bands in the UV region due to ligand-centered π–π* transitions (for 1, at 265 nm, ε = 19![[thin space (1/6-em)]](https://www.rsc.org/images/entities/char_2009.gif) 250 and for 2 at 290 nm, ε = 47
250 and for 2 at 290 nm, ε = 47![[thin space (1/6-em)]](https://www.rsc.org/images/entities/char_2009.gif) 250) at wavelengths close to those observed for the uncoordinated ligand. A broad band in the visible region characteristic of metal-to-ligand charge transfer-transitions (MLCT)8,28 is also observed with a notable quenching in the absorption of 1 (Fig. 7), which is consistent with the molecular distortion of the complex from D2d symmetry (τ4 = 0.8279).29 This low-symmetry conformation likely occurs to maximize intramolecular π-stacking interactions between opposing ligands L1. These interactions are clearly seen in the solid-state structure (vide supra). Thus, the intensity of the low-energy shoulder is a rough measure of the distortion away from D2d symmetry. Conversely, as the more sterically demanding ligands impart more rigidity to the complex and enforce D2d symmetry, the low-energy shoulder should decrease.29 As suggested by TD-DFT studies (vide infra), the lowest-lying transition of 1 and 2 are ascribed as Cu(3d) → N^N and phosphine → N^N charge transfer (1MLCT/1LLCT) transitions.
250) at wavelengths close to those observed for the uncoordinated ligand. A broad band in the visible region characteristic of metal-to-ligand charge transfer-transitions (MLCT)8,28 is also observed with a notable quenching in the absorption of 1 (Fig. 7), which is consistent with the molecular distortion of the complex from D2d symmetry (τ4 = 0.8279).29 This low-symmetry conformation likely occurs to maximize intramolecular π-stacking interactions between opposing ligands L1. These interactions are clearly seen in the solid-state structure (vide supra). Thus, the intensity of the low-energy shoulder is a rough measure of the distortion away from D2d symmetry. Conversely, as the more sterically demanding ligands impart more rigidity to the complex and enforce D2d symmetry, the low-energy shoulder should decrease.29 As suggested by TD-DFT studies (vide infra), the lowest-lying transition of 1 and 2 are ascribed as Cu(3d) → N^N and phosphine → N^N charge transfer (1MLCT/1LLCT) transitions.
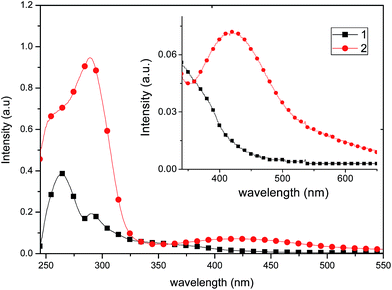 | ||
| Fig. 7 Absorption spectra of 1 and 2 recorded in a 2.0 × 10⁻⁵ mol L−1 solution in CH2Cl2. Inset: amplified visible region of the absorption spectra. | ||
The solid state emission spectra of complexes 1 and 2 are shown in Fig. 8. Both complexes show a broad band in the green region (535 nm), which is common for copper compounds,30 and can be assigned to dπ(Cu) → π*(diimine) and 3MLCT excited states,31 mixed with some contributions from the phosphine ligands.
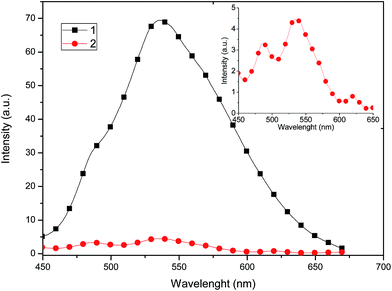 | ||
| Fig. 8 Solid state emission spectra of 1 and 2 recorded at room temperature upon excitation at λ = 320 nm. Inset: amplified emission spectrum of 2. | ||
Compound 1 exhibits a marked enhancement in the photoluminescence properties in comparison with 2, which can be attributed to the dimeric supramolecular structure (vide supra), which shows the presence of intermolecular π–π stacking interactions that can efficiently suppress the relaxation process from the excited state, decreasing the non-radiative rate constant.23 By measuring the photoluminescence in solution (Fig. 9), a similar behaviour is observed in the emission spectrum, probably because dimeric supramolecular structure in solution is retained.
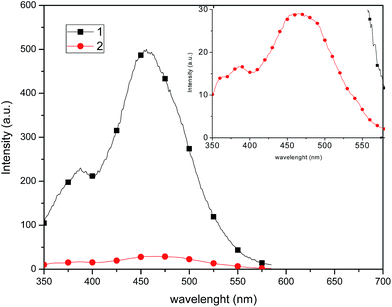 | ||
| Fig. 9 Emission spectra of 1 and 2 recorded in 1 × 10⁻⁴ mol L−1 CH2Cl2 solution at room temperature upon excitation at λ = 320 nm. Inset: amplified emission spectrum of 2. | ||
In CH2Cl2 solution at room temperature, complexes 1 and 2 show a broad single emission band (Fig. 9) centered at 454 and 465 nm, respectively. It has been reported that an increase of the P–Cu–P angle can reduce the d–σ* interactions and increase the energy required for the MLCT.32 Thus, it is likely that the P–Cu–P angle plays a partial role on the emission variation of 1 and 2, and virtually the P–Cu–P angle of 1 (115.02°) and 2 (127.66°) follow the same order as the MLCT (454 and 465 nm, respectively), consistent with the observations of MacMillin et al.32a,33 Therefore, the emissions of 1 and 2 are markedly affected by both the electronic properties of the phosphines and the P–Cu–P angles.
Theoretical investigations
The origin of the charge transfer between molecular orbitals is an important aspect in the study of molecular systems. Fig. 10 shows the iso density plots of some of the molecular orbitals at the M06/6-31G(d)+DZVP level of calculation.19 The absorption band at λmax corresponds to the transition from the highest occupied molecular orbital (HOMO) to the lowest unoccupied molecular orbital (LUMO). In both complexes, the HOMO electron density distribution is located at the copper metal center and at the phosphorus atoms, while the LUMO electron density is distributed over the ligands.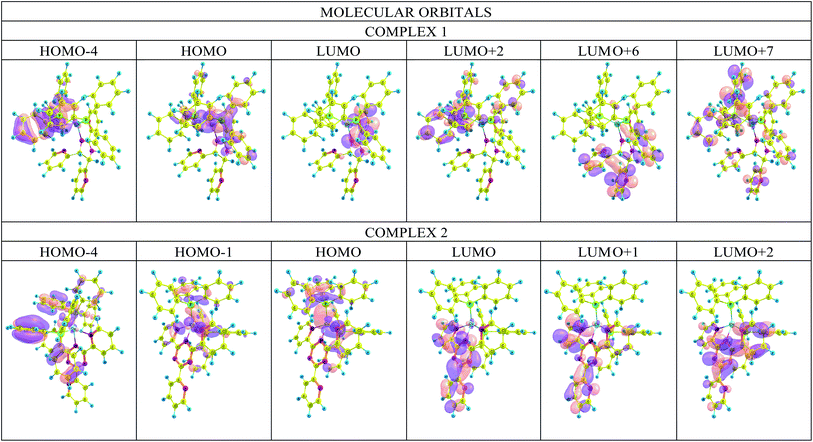 | ||
| Fig. 10 Plots of the frontier orbitals involved in the lowest-lying electronic absorption transitions of the complexes. | ||
The results of the TD-DFT calculations indicate five major transitions for complex 1. In the UV region, a ligand-to-ligand transition (L1–L1) between the HOMO − 4 → LUMO orbitals and three metal/phosphorus → ligand transitions: HOMO → LUMO + 6, HOMO → LUMO + 2 and HOMO → LUMO + 7. In the visible region there is one metal/phosphor → ligand HOMO → LUMO transition. Four main transitions can be observed for 2, a HOMO − 4 → LUMO charge transfer (L2–L2) in the UV region and three metal/phosphor → ligand transitions in the visible region: HOMO − 1 → LUMO, HOMO → LUMO + 1 and HOMO → LUMO. This analysis shows that there is indeed a mixture of charge transfer interactions between the components of the complex. Details of the assignments of TD-DFT in terms of FMO are included in the ESI (Table S6 and Fig. S6†).
Thermal analyses
To examine the thermal stability of 1 and 2, thermal gravimetric analyses (TGA) were performed under N2 atmosphere for crystalline samples with a heating rate of 10 °C min−1 from ambient temperature up to 1000 °C. The TGA curve of compound 1 reveals four main regions of weight loss (see Fig. S7, ESI†). The first initiates at 30 °C with completeness at 150 °C, and corresponds to the release of three lattice CHCl3 molecules. This phenomenon can be understood because of the presence of hydrogen-bonding interactions between the lattice CHCl3, NO3− and PPh3 phenyl rings. The observed weight loss of 25.6% is close to the calculated value (27.3%). The second step in the temperature range of 150 to 330 °C corresponds to the loss of two PPh3 ligands. The observed weight loss of 40.3% is in good agreement with the calculated value (40.0%). The third step (found 11.3%; theoretical, 11.9%), in the range of 330–500 °C, is attributed to the loss of two Py molecules. Finally, a fourth step in the temperature range of 600 to 1000 °C corresponds to the loss of the remaining Py and imidazoline groups (found 10.0%, theoretical, 11.0%). As shown in Fig. S7,† the TGA curve of compound 2 reveals also four main steps of weight loss. The first, starting at 90 °C with completeness at 150 °C, corresponds to the release of the crystal lattice water molecules. The observed weight loss of 2.6% is slightly larger than the calculated value (1.8%). The second step, from 150 to 290 °C, corresponds to the loss of two PPh3 ligands and the observed weight loss of 52.5% is in good agreement with the calculated value (53.4%). The third step (found 20.0%; theoretical, 20.6%), in the range of 290–400 °C, is attributed to the loss of two Py molecules and one NO2− ion. Finally, the fourth step in the temperature range of 400 to 1000 °C corresponds to the loss of the remaining Py and triazine fragments (found 15.0%, theoretical, 15.9%).Conclusions
Two new copper(I) complexes with polypyridine chelating ligands and phosphine groups were synthesized and characterized by single-crystal X-ray crystallography, mass spectrometry as well as NMR, FT-IR, UV-Vis and fluorescence spectroscopy. Their photophysical properties are reported. It is found that the fluorescence intensity in 1 is enhanced due to its rigid structure caused by π-stacking which generates a pseudo sandwich structure. A series of additional interactions such as O–H⋯N, O–H⋯O, C–H⋯O, C–H⋯N and π–π contacts also play a significant role in stabilizing the supramolecular networks of the complexes. The application of mononuclear Cu(I) complexes in the field of solar cell sensitizers needs further research.Acknowledgements
This work was supported by Universidad Autónoma de Sinaloa, México (DGIP-PROFAPI-2012/031). The authors gratefully acknowledge access to the X-ray facilities in the Chemical Research Center at the Autonomous State University of Morelos (CIQ-UAEM) and the NMR facilities at the San Diego State University (SDSU). A. B. C. thanks the support from Consejo Nacional de Ciencia y Tecnología (CONACYT) in the form of a graduate scholarship (248950).Notes and references
- (a) K. Kalyanasundaram, Coord. Chem. Rev., 1982, 46, 159 CrossRef CAS; (b) A. Hagfeldt and M. Grätzel, Acc. Chem. Res., 2000, 33, 269 CrossRef CAS PubMed; (c) M. Grätzel, Inorg. Chem., 2005, 44, 6841 CrossRef PubMed; (d) A. Hagfeldt, G. Boschloo, L. Sun, L. Kloo and H. Pettersson, Chem. Rev., 2010, 110, 6595 CrossRef CAS PubMed.
- (a) C. Malins, H. Glever, T. Keyes, J. Vos, W. Dressick and B. MacCraith, Sens. Actuators, B, 2000, 67, 89 CrossRef CAS; (b) F. Gao, Y. Wang, D. Shi, J. Zhang, M. Wang, X. Jing, R. Humphry-Baker, P. Wang, S. M. Zakeeruddin and M. Grätzel, J. Am. Chem. Soc., 2008, 130, 10720 CrossRef CAS PubMed; (c) H. Xiang, J. Cheng, X. Ma, X. Zhou and J. J. Chruma, Chem. Soc. Rev., 2013, 42, 6128 RSC; (d) E. C. Constable, M. Neuburger, P. Rösel, G. E. Schneider, J. A. Zampese, C. E. Housecroft, F. Monti, N. Armaroli, R. D. Costa and E. Ortí, Inorg. Chem., 2013, 52, 885 CrossRef CAS PubMed; (e) M. V. Werrett, S. Muzzioli, P. J. Wright, A. Palazzi, P. Raiteri, S. Zacchini, M. Massi and S. Stagni, Inorg. Chem., 2014, 53, 229 CrossRef CAS PubMed; (f) H. Shahroosvand, F. Nasouti and A. Sousaraei, Dalton Trans., 2014, 43, 5158 RSC.
- (a) T. McCormick, W.-L. Jia and S. Wang, Inorg. Chem., 2006, 45, 147 CrossRef CAS PubMed; (b) A. Caselli, F. Cesana, E. Gallo, N. Casati, P. Macchi, M. Sisti, G. Celentano and S. Cenini, Dalton Trans., 2008, 4202 RSC; (c) L. Shi, B. Li, S. Yue and D. Fan, Sens. Actuators, B, 2009, 137, 386 CrossRef PubMed; (d) A. Beitat, S. P. Foxon, C. C. Brombach, H. Hausmann, F. W. Heinemann, F. Hampel, U. Monkowius, C. Hirtenlehner, G. Knör and S. Schindler, Dalton Trans., 2011, 40, 5090 RSC; (e) X.-L. Li, X.-L. Xin, Y.-B. Ai, M. Tan, H. Lu and B.-X. Du, Inorg. Chim. Acta, 2013, 401, 58 CrossRef CAS PubMed; (f) M. Osawa, Chem. Commun., 2014, 50, 1801 RSC.
- (a) T. E. Hewat, L. J. Yellowlees and N. Robertson, Dalton Trans., 2014, 43, 4127 RSC; (b) T. H. Huang and M. H. Zhang, Inorg. Chim. Acta, 2014, 410, 150 CrossRef CAS PubMed; (c) L. Bergmann, J. Friedrichs, M. Mydlak, T. Baumann, M. Nieger and S. Bräse, Chem. Commun., 2013, 49, 6501 RSC; (d) M. Schatz, M. Becker, F. Thaler, S. Schindler, R. R. Jacobson, Z. Tyeklár, N. N. Murthy, P. Ghosh, Q. Chen, J. Zubieta and K. D. Karlin, Inorg. Chem., 2001, 40, 2312 CrossRef CAS PubMed; (e) M. T. Buckner, T. G. Matthews, F. E. Lytle and D. R. McMillin, J. Am. Chem. Soc., 1979, 101, 5846 CrossRef CAS.
- (a) X.-P. Zhou, D. Li, S.-L. Zheng, X. Zhang and T. Wu, Inorg. Chem., 2006, 45, 7119 CrossRef CAS PubMed; (b) X.-P. Zhou, D. Li, T. Wu and X. Zhang, Dalton Trans., 2006, 2435 RSC.
- (a) J. J. Campos-Gaxiola, H. Höpfl and M. Parra-Hake, Inorg. Chim. Acta, 2010, 363, 1179 CrossRef CAS PubMed; (b) J. J. Campos-Gaxiola, H. Höpfl and M. Parra-Hake, Inorg. Chim. Acta, 2008, 361, 248 CrossRef CAS PubMed; (c) J. J. Campos-Gaxiola, H. Höpfl and M. Parra-Hake, J. Mex. Chem. Soc., 2007, 51, 27 CAS; (d) A. Baez-Castro, H. Höpfl, M. Parra-Hake, A. Cruz-Enriquez and J. J. Campos-Gaxiola, Acta Crystallogr., Sect. E: Struct. Rep. Online, 2012, 68, m815 CAS.
- (a) A. J. Gordon and R. A. Ford, The Chemists Companion, Wiley Interscience, 1992 Search PubMed; (b) J. P. Collin, A. Jouaiti, J. P. Sauvage, W. C. Kaska, M. A. McLoughlin, N. L. Keder, W. T. Harrison and G. D. Stucky, Inorg. Chem., 1990, 29, 2238 CrossRef CAS.
- I. Andrés-Tomé, J. Fyson, F. B. Dias, A. P. Monkman, G. Iacobellis and P. Coppo, Dalton Trans., 2012, 41, 8669 RSC.
- G. J. Kubas, Inorg. Synth., 1979, 19, 90 CrossRef CAS PubMed.
- M. L. Larter, M. Phillips, F. Ortega, G. Aguirre, R. Somanathan and P. J. Walsh, Tetrahedron Lett., 1998, 39, 478 CrossRef.
- SMART Bruker Molecular Analysis Research Tool, Versions 5.057 and 5.618, Bruker Analytical X-ray Systems, 1997 and 2000 Search PubMed.
- SAINT+NT, Versions 6.01 and 6.04, Bruker Analytical X-ray systems, 1999 and 2000 Search PubMed.
- (a) G. M. Sheldrick, SHELX86, Program for Crystal Structure Solution, University fo Göttingen, Germany, 1986 Search PubMed; (b) SHELXTL-NT, V. 5.10 and 6.10, Bruker Analytical X-ray systems, 1999 and 2000 Search PubMed.
- L. J. Farrugia, J. Appl. Crystallogr., 1999, 32, 837 CrossRef CAS.
- C. F. Macrae, I. J. Bruno, J. A. Chisholm, P. R. Edigton, P. McCabe, E. Pidcock, L. Rodriguez-Monge, R. Taylor, J. van de Streek and P. A. Wood, J. Appl. Crystallogr., 2008, 41, 466 CrossRef CAS.
- M. J. Frisch, G. W. Trucks, H. B. Schlegel, G. E. Scuseria, M. A. Robb, J. R. Cheeseman, G. Scalmani, V. Barone and B. Mennucci, et al., Gaussian 09 Revision A.1, Gaussian, Inc., Wallingford, CT, 2009 Search PubMed.
- (a) P. Hohenberg and W. Kohn, Phys. Rev., 1964, 136, B864 CrossRef; (b) W. Kohn and L. J. Sham, Phys. Rev., 1965, 140, A1133 CrossRef.
- (a) K. Burke, J. Werschnik and E. Gross, J. Chem. Phys., 2005, 123, 062206 CrossRef PubMed; (b) R. E. Stratmann, G. E. Scuseria and M. J. Frisch, J. Chem. Phys., 1998, 109, 8218 CrossRef CAS PubMed.
- Y. Zhao and D. G. Truhlar, Theor. Chem. Acc., 2008, 120, 215 CrossRef CAS.
- V. A. Rassolov, M. A. Ratner, J. A. Pople, P. C. Redfern and L. A. Curtiss, J. Comput. Chem., 2001, 22, 976 CrossRef CAS PubMed.
- C. Sosa, J. Andzelm, B. C. Elkin, E. Wimmer, K. D. Dobbs and D. A. Dixon, J. Chem. Phys., 1992, 96, 6630 CrossRef CAS.
- J. Tomasi, B. Mennucci and R. Cammi, Chem. Rev., 2005, 105, 2999 CrossRef CAS PubMed.
- L.-F. Shi, B. Li, L.-M. Zhang, Q.-H. Zuo and S. Yue, Inorg. Chim. Acta, 2013, 400, 91 CrossRef CAS PubMed.
- L. Yang, D. R. Powell and R. P. Houser, Dalton Trans., 2007, 955 RSC.
- For reviews on system with π–π interactions, see: (a) M. L. Glówka, D. Martynowski and K. Kozlowska, J. Mol. Struct., 1999, 474, 81 CrossRef; (b) C. J. Jianiak, J. Chem. Soc., Dalton Trans., 2000, 3885 RSC; (c) M. Nishio, CrystEngComm, 2004, 6, 130 RSC; (d) E. A. Meyer, R. K. Castellano and F. Diederich, Angew. Chem., Int. Ed., 2003, 42, 1210 CrossRef CAS PubMed.
- (a) T. J. Burchell and R. J. Puddephatt, Inorg. Chem., 2005, 44, 3718 CrossRef CAS PubMed; (b) X. Q. Liang, X. H. Zhou, C. Chen, H. P. Xiao, Y. Z. Li, J. L. Zuo and X. Z. You, Cryst. Growth Des., 2009, 9, 1041 CrossRef CAS; (c) F. Marandi, M. Jangholi, M. Hakimi, H. A. Rudbari and G. Bruno, J. Mol. Struct., 2012, 1036, 71 CrossRef PubMed.
- For reviews on C–H⋯O interactions, see: (a) G. R. Desiraju, Acc. Chem. Res., 1996, 29, 441 CrossRef CAS PubMed; (b) T. Steiner, Chem. Commun., 1997, 727 RSC.
- C. Femoni, S. Muzzioli, A. Palazzi, S. Stagni, S. Zacchini, F. Monti, G. Accorsi, M. Bolognesi, N. Armaroli and M. Massi, Dalton Trans., 2013, 42, 997 RSC.
- (a) M. T. Miller, P. K. Gantzel and T. B. Karpishin, Inorg. Chem., 1999, 38, 3414 CrossRef CAS PubMed; (b) F. K. Klemens, C. E. A. Palmer, S. M. Rolland, P. E. Fanwick, D. R. McMillin and J. P. Sauvage, New J. Chem., 1990, 14, 129 CAS.
- (a) M. H. Lim and S. J. Lippard, J. Am. Chem. Soc., 2005, 127, 12170 CrossRef CAS PubMed; (b) N. P. Rath, E. M. Holt and K. Tanimura, Inorg. Chem., 1985, 24, 3934 CrossRef CAS.
- (a) K. A. Vinogradova, V. F. Plyusnin, A. S. Kupryakov, M. I. Rakhmanova, N. V. Pervukhina, D. Y. Naumov, L. A. Sheludyakova, E. B. Nikolaenkova, V. P. Krivopalov and M. B. Bushuev, Dalton Trans., 2014, 43, 2953 RSC; (b) P. A. Papanikolaou and N. V. Tkachenko, Phys. Chem. Chem. Phys., 2013, 15, 13128 RSC; (c) L. Shi and B. Li, Eur. J. Inorg. Chem., 2009, 48, 2294 CrossRef PubMed; (d) Q. H. Wei, G. Q. Yin, L. Y. Zhang and Z. N. Chen, Inorg. Chem., 2006, 45, 10371 CrossRef CAS PubMed.
- (a) D. G. Cuttell, S.-M. Kuang, P. E. Fanwick, D. R. McMillin and R. A. Walton, J. Am. Chem. Soc., 2002, 124, 6 CrossRef CAS PubMed; (b) J.-L. Chen, X.-F. Cao, J.-Y. Wang, L.-H. He, Z.-Y. Liu, H.-R. Wen and Z.-N. Chen, Inorg. Chem., 2013, 52, 9727 CrossRef CAS PubMed.
- S. M. Kuang, D. G. Cuttell, D. R. McMillin, P. E. Fanwick and R. A. Walton, Inorg. Chem., 2002, 41, 3313 CrossRef CAS PubMed.
Footnote |
| † Electronic supplementary information (ESI) available: Experimental and theoretical IR spectral data of complexes 1 and 2, Table of hydrogen bonding geometries of compounds 1 and 2, TD-DFT assessment data, 1H-NMR and 31P {1H} NMR spectra and thermograms of compounds 1 and 2. CCDC 969083–969084. For ESI and crystallographic data in CIF or other electronic format see DOI: 10.1039/c4ra06512c |
| This journal is © The Royal Society of Chemistry 2014 |

