DOI:
10.1039/C4RA06499B
(Paper)
RSC Adv., 2014,
4, 37236-37243
Charge inhomogeneity of graphene on SiO2: dispersion-corrected density functional theory study on the effect of reactive surface sites
Received
1st July 2014
, Accepted 1st August 2014
First published on 1st August 2014
Abstract
Graphene is a promising high-mobility material, but the mobility of graphene supported on a substrate is far from the theoretical limit. The degradation of remarkable electronic properties is often attributed to a spatial charge inhomogeneity, so-called charge puddle, present in supported graphenes. Since the most widely used substrate for electronic devices, amorphous SiO2, tends to expose various types of surface species, we investigate how a variety of surface species present on amorphous SiO2 substrates would affect the electronic structure of graphenes on them. Four representative surface species (saturated and unsaturated) are constructed on pristine SiO2 (001) surfaces, and a dispersion-corrected spin-polarized density functional theory calculation is carried out on a graphene sheet bound on each of them. The calculation shows that, among the four model species, the unsaturated model with exposed oxygen dangling bonds is the only surface species which can bind graphene rather strongly. Only this one accepts a significant amount of electrons from graphene, leading to a non-negligible amount of p-doping and band-gap opening of graphene. Such reactive surface species present in a mixture with inert ones could be one likely origin of the charge puddle observed in supported graphenes. A thermal annealing or passivation of oxygen dangling bonds on SiO2 would reduce the charge puddle in supported graphenes.
1 Introduction
Graphene is a two-dimensional sheet of carbon atoms packed into a honeycomb lattice, which constitutes a single-atomic-layer building block of graphite.1,2 It has great potential to use in electronic devices, owing to the high mobilities of its charge carriers, both electrons and holes.1,3–5 In most devices, however, graphene is supported by a silicon dioxide (SiO2) dielectric layer, and the mobility measured on supported graphenes is far from the theoretical limit and highly vulnerable to external conditions.3,6 The degradation of remarkable electronic properties of graphene is often attributed to a spatial charge inhomogeneity observed in supported graphenes: some areas in a graphene sheet display excess of electrons and some other areas exhibit excess of holes, inducing extra electron scattering and reduced mobility.7–10 The origin of the so-called electron–hole puddle or charge puddle2,7,11 is not clear yet.12 It could come from corrugations or ripples of graphene, either intrinsic (found in free-standing graphenes)13–15 or extrinsic (conforming to the corrugation of the underlying SiO2 substrate),16–18 and also from charged impurities (H2O or other unknown moieties which survive vacuum annealing)22,23 present either between graphene and SiO2 or on top of graphene.11,19–23 A recent Kelvin probe force microscopy study21 has reported that a high degree of potential disorder and charge inhomogeneity of amorphous SiO2 substrate itself (compared to h-BN) is related to the mobility reduction in graphene on it. Electron beam exposure (often employed in graphene fabrication) increases the charge density fluctuation by producing a large amount of metastable charge traps on SiO2, which is reversed by thermal annealing.21 We therefore speculate that the presence of unsaturated reactive surface species produced on the underlying SiO2 substrate during device fabrication could be responsible for the charge puddle of supported graphenes. We therefore investigate the effect of a variety of saturated and unsaturated SiO2 surface species on the electronic structure of graphene, by performing density functional theory (DFT) calculations on several model surfaces.
The most stable polymorph of SiO2 is α-quartz and its most stable surface is (001).24,25 The pristine (001) surface exposes unsaturated dangling bonds (·SiO·; 0 in Fig. 1), which can be saturated by dissociative adsorption of water on both sides of the dangling bond to form a pair of geminal silanols (HOSiOH; 1 in Fig. 1).24,26 At temperatures above 300 K, the saturation can also be achieved by a surface reconstruction connecting adjacent dangling bonds (SiOSi; 2 in Fig. 1).24,25,27 These surface models (hydrated or fully-hydroxylated 1 and reconstructed 2) have been used in DFT calculations on graphenes supported by SiO2.28–34 We expect that, in addition to the saturated species, a significant amount of unsaturated surface species with silicon (Si·) and oxygen (O·) dangling bonds should exist on amorphous SiO2 substrates used in most electronic devices, as a result of laser/ion radiation or plasma treatment in the course of device fabrication. We model these unsaturated sites by two types of partially-hydrogenated intermediates of H2 passivation of the pristine (001) surface 0,35 where a hydrogen atom has been added either to the oxygen dangling bond (·SiO· + H· → ·SiOH; 3 in Fig. 1) or to the silicon dangling bond (H· + ·SiO· → HSiO·; 4 in Fig. 1), leaving a silicon (Si·) and oxygen (O·) dangling bond, respectively. The interaction between a graphene sheet and each of the four representative (two stable and two reactive) SiO2 surfaces 1–4 and the resulted charge transfer between them are calculated and related to the substrate-induced spatial charge inhomogeneity, that is, the charge puddle of graphene.
 |
| Fig. 1 Side (left) and top (right) views on α-quartz SiO2 (001) surface with ·SiO· dangling bonds (0; top) and on four (two saturated and two unsaturated) surfaces built from it: hydrated 1 (HOSiOH), reconstructed 2 (SiOSi) and partially-hydrogenated 3 (with silicon dangling bonds ·SiOH) and 4 (with oxygen dangling bonds HSiO·). Color code: black (H), red (O), blue (Si), and black solid line (unit-cell lattice). | |
2 Calculation details
2.1 Model
Periodic slab models are used to represent the four SiO2 (001) surfaces 1–4 (Fig. 1) and their interfaces with a graphene sheet 1a–4b (Fig. 2). On the basis of the convergence test of Goumans and coworkers,24 we represent the surfaces 1–4 by three-unit-cell-high slabs cut from a hexagonal α-quartz crystal (a = 4.916 Å, c = 5.405 Å).36 The lateral lattice parameters of these slab models (4.916 Å) are scaled up by 0.2% to match those of graphite and graphene (4.928 Å).37 A vacuum slab of ∼19 Å (which is chosen from a convergence test; not shown here) is inserted between the slabs in vertically adjacent unit cells in order to avoid fictitious interactions between the images of slabs. Right on top of the topmost oxygen atom of the optimized slab models 1–4, either a carbon atom (on-top configuration a) or the center of a hexagon of carbon atoms (hollow configuration b) of an ideally-flat single-layer graphene sheet is placed to build eight different periodic slab models of the graphene/SiO2 interface (1a–4b; Fig. 2). A vacuum slab of ∼15 Å is inserted between the composite slabs in vertically adjacent unit cells. These slab models 1–4 and 1a–4b are submitted to an optimization of atomic positions at the lattice parameters fixed at 4.928 Å and 35.256 Å.
 |
| Fig. 2 Side (left) and top (right) views on the optimized structures of eight graphene/SiO2 interface models, where a graphene sheet is adsorbed on four SiO2 surface models [HOSiOH (1), SiOSi (2), ·SiOH (3), and HSiO· (4)] in two configurations (on-top a and hollow b). Only the topmost SiO2 layer is shown in the top views (right) for clarity. Color code: black (H), grey (C), red (O), blue (Si), and black solid line (unit-cell lattice). | |
2.2 Calculation method
Periodic DFT calculations are carried out using the VASP code.38 The dispersion correction scheme of Grimme39,40 is used in conjunction with the PBE functional41,42 to describe correctly the interaction between graphene and SiO2 surfaces, as done by Fan and coworkers.34 This PBE-D functional is known to describe the adsorption of organic molecules quite well (with a certain degree of overestimation).43,44 The core electrons of each atom are replaced by the projector-augmented-wave pseudopotentials,45,46 and the outer valence electrons (4 electrons in Si 3s/3p, 6 in O 2s/2p, 4 in C 2s/2p, and 1 in H 1s) are described by a set of plane waves with kinetic energies up to 600 eV. Spin-polarized calculations are carried out for the unsaturated surfaces 3–4 and their composites with graphene 3a–4b. For saturated surfaces 1–2 and their composites with graphene 1a–2b, both spin-unpolarized and spin-polarized calculations give the same results. On the basis of a convergence test on the bulk SiO2 α-quartz crystal (not shown), the Brillouin-zone integration is performed on a set of k-points generated by a 7 × 7 × 1 Γ-point-centered Monkhorst-Pack mesh47 with a Gaussian smearing of 0.2 eV. The convergence criterion for the electronic self-consistent-field cycle is 1 × 10⁻⁵ eV. For geometry optimization, the atomic coordinates are fully relaxed with a conjugate gradient method until the energy change is less than 1 × 10⁻⁴ eV. At the final geometry, the band structure, DOS, and a series of partial DOS projected onto each group of atoms (PDOS) are analyzed with a 21 × 21 × 1 Monkhorst-Pack k-point mesh and a tetrahedron method.48 The number of valence electrons carried by each atom (and thus the atomic charge) is estimated by the Bader analysis, which partitions a charge density grid into Bader volumes whose dividing surfaces, so-called zero-flux surfaces, lie in the bonding regions between atoms.49–51 The model structures and charge densities are visualized by VESTA.52
3 Results and discussion
3.1 Stabilities of SiO2 surfaces 1–4
The relative stabilities of the surface species 1–4 (Fig. 1) are measured by a surface energy (Esurf; Table 1) defined as24,53 |
Esurf = (2A)−1 × [E(slab) − E(bulk) − E(ads)].
| (1) |
Table 1 SiO2: surface energy (Esurf)a
Surface model (Fig. 1) |
PBE |
PBE-D |
E(slab) eV |
E(ads) eV |
Esurf eV nm−2 |
E(slab) eV |
E(ads) eV |
Esurf eV nm−2 |
Eqn (1), E(bulk) = −213.3 (PBE), −216.3 (PBE-D) eV; 2A = 0.4206 nm2. From spin-unpolarized calculations. From spin-polarized calculations. 2E(H2O(l)) at 298 K = 2[E(H2O(g)) − ΔEvap(H2O)] = 2[−14.22 – 0.43] eV. E(H2(g)). Exp. 0.719–1.25 eV nm−2. Other calc. 2.3–5 eV nm−2. |
1 |
−242.3b |
−29.3d |
0.7f |
−245.2b |
−29.3d |
0.9f |
2 |
−212.0b |
0.0 |
3.1g |
−214.5b |
0.0 |
4.2g |
3 |
−214.7c |
−6.8e |
12.8 |
−217.3c |
−6.8e |
13.6 |
4 |
−212.1c |
−6.8e |
18.8 |
−214.7c |
−6.8e |
19.7 |
Less positive numbers represent more stable surfaces. A is the surface area of the unit cell (0.2103 nm2 = 4.928 Å × 4.928 Å × sin
60°), E(slab) is the total energy of each SiO2 slab (1–4; Fig. 1), and E(bulk) is the total energy of the bulk α-quartz SiO2 crystal whose unit cell contains the same number of atoms as the stoichiometric slab 2 (nine formula units of SiO2). E(ads) is zero for the stoichiometric slab 2. For non-stoichiometric surfaces 1 and 3–4, E(ads) is the total energy (in the most stable phase) of molecules added to both sides of 2 to create 1 [2E(H2O(l)) = 2E(H2O(g)) − 2ΔEvap(H2O)] or 3–4 [E(H2(g))]. The total energy of a gas-phase molecule, E(H2O(g)) or E(H2(g)), is calculated in a cubic cell of a size of 10 Å. The energy of vaporization ΔEvap is given from the experimental enthalpy of vaporization at room temperature54 with the ideal gas approximation [ΔHvap − PΔVvap ≅ ΔHvap − RT = 43.990 – 2.479 = 41.511 kJ mol−1 = 0.43022 eV].
The PBE-D values of Esurf are higher than the PBE values by ∼25% in the case of 1–2 and by ∼5% in the case of 3–4, showing a significant effect of the dispersion correction on the description of weak interaction. Both PBE and PBE-D values, however, show that the model 1 (HOSiOH) is the most stable form of the SiO2 (001) surface, followed by 2 (SiOSi), 3 (·SiOH), and 4 (HSiO·). For the stable surfaces 1–2, both PBE and PBE-D values (0.7–4.2 eV nm−2) are comparable with various literature values from experiments (0.719–1.25 eV nm−2 = 115–200 mJ m−2),26,55,56 from previous DFT calculations (0.94–1.3 eV nm−2 = 150–200 mJ m−2 for 1; 2.3–3.1 eV nm−2 = 360–490 mJ m−2 for 2),24 from classical molecular dynamics simulations (1.3 eV nm−2 = 0.5 × 430 mJ m−2 for 1; the original literature value is divided by two due to the difference in the definition of the surface energy),53 and from ab initio molecular dynamics simulations (5 eV nm−2 for 2).57
For the unsaturated surfaces 3–4, both PBE and PBE-D values of Esurf (12.8–19.7 eV nm−2 or 2.7–4.1 eV per unit cell which contains one dangling bond) are indeed higher than the values for the saturated surfaces 1–2 (0.7–4.2 eV nm−2 or 0.14–0.89 eV per unit cell). The difference in the stability between 1–2 and 3–4 is less than 4 eV per dangling bond, which is lower than the energy (101 to 102 eV) provided by incoming particles or radiation in typical etching and sputtering processes.58,59 We therefore expect that a significant amount of reactive surface species such as 3–4 should be present in typical graphene devices.
3.2 Stability of graphene on SiO2 surfaces 1a–4b
The stability of graphene on SiO2 surface in the composite 1a–4b (Fig. 2) is measured by the binding energy (Eb) defined as |
Eb = A−1 × [E(G) + E(SiO2) − E(G/SiO2)].
| (2) |
E(G/SiO2) is the total energy of the graphene/SiO2 composite 1a–4b, E(G) is the total energy of an ideally-flat free-standing single-layer graphene, and E(SiO2), which is the same as E(slab) of eqn (1), is the total energy of the bare SiO2 slab 1–4 (Fig. 1). The binding energy Eb should be sufficiently positive (Eb > 0) for a stable binding. We first obtain binding energy curves of 1a–4b by performing a series of geometry optimization with the graphene constrained at a given height d from the topmost oxygen atoms of each SiO2 surface 1–4 for each binding configuration a–b (Fig. 3). At the minimum-energy height from each SiO2 surface (that is, at the bottom of each binding energy curve), the constraint is removed and the geometry is fully optimized. The fully optimized geometries of 1a–4b are shown in Fig. 2, and their equilibrium heights de and binding energies Eb are listed in Table 2.
 |
| Fig. 3 Binding energy curves for a graphene sheet on SiO2 surface 1–4 in configuration a–b at various heights d from the topmost oxygen atoms of the SiO2 surface. The horizontal dashed line indicates the reference energy to estimate the binding energy, which is the sum of the total energies of a flat free-standing graphene sheet and of each bare SiO2 surface 1–4. The horizontal grey bands indicate a range of experimental binding energies. The PBE and PBE-D values are given together by open marks and filled marks, respectively, to show the effect of the dispersion correction on the description of weak interaction. | |
Table 2 Graphene/SiO2: equilibrium distancea and binding energyb
Surface |
Site |
PBE |
PBE-D |
de Å |
Eb eV nm−2 |
de Å |
Eb eV nm−2 |
Equilibrium height de of graphene from the topmost O atom of SiO2. kJ mol−1 per C atom in parentheses. |
1 |
a |
3.90 |
0.2 (0.5)b |
3.13 |
1.1 (2.8)b |
b |
3.90 |
0.2 (0.5) |
3.03 |
1.2 (3.0) |
2 |
a |
4.00 |
0.1 (0.3) |
3.10 |
1.4 (3.6) |
b |
4.00 |
0.1 (0.3) |
2.98 |
1.5 (3.9) |
3 |
a |
3.90 |
0.05 (0.1) |
3.10 |
1.0 (2.5) |
b |
3.80 |
0.05 (0.1) |
3.01 |
1.1 (2.7) |
4 |
a |
2.93 |
1.5 (3.8) |
2.75 |
2.4 (6.1) |
b |
2.86 |
1.5 (3.9) |
2.70 |
2.5 (6.2) |
The black and red curves in each graph of Fig. 3 essentially overlap each other. The binding configuration, a (black) or b (red), of graphene on SiO2 has a negligible effect. Since the hollow-site binding (b; red) is slightly more stable than the on-top-site binding (a; black), the following discussions focus on the hollow-site binding b (red).
Experimental binding energies are indicated as horizontal grey bands in Fig. 3: 2.8 ± 0.1 eV nm−2 (0.45 ± 0.02 J m−2) and 1.9 ± 0.2 eV nm−2 (0.31 ± 0.03 J m−2) for single-layer and multilayer graphene, respectively, from a blister test on SiO2 substrates patterned with microcavities,60 2.1 eV nm−2 (0.33 J m−2) from an atomic force microscopy study on multiwall carbon nanotubes collapsed onto SiO2/Si substrates,55 and 1.72–2.5 eV nm−2 (0.275–0.4 J m−2) from a combination of the surface energies of SiO2 and of graphite.55,61
In all the graphs of Fig. 3, the PBE-D (filled-mark) curves are positioned much lower and closer to the grey bands than the PBE (open-mark) curves, showing a significant effect of the dispersion correction. With PBE, binding of graphene is not clear at all (Eb = 0.05–0.2 eV nm−2 = 0.1–0.5 kJ mol−1 per C atom at ∼4 Å) on the surfaces except 4, where a clear binding (Eb = 1.5 eV nm−2 = 3.9 kJ mol−1 per C atom) is detected at a height de of 2.9 Å. On the other hand, with PBE-D, the binding of graphene is clear on all the surfaces 1–4 (Eb = 1.1–2.5 eV nm−2 = 2.7–6.2 kJ mol−1 per C atom) at equilibrium heights de of 2.7–3.0 Å. As expected, the PBE-D functional appears more appropriate than PBE to describe the weak interaction between graphene and SiO2, and thus the following discussions focus on the PBE-D results (filled marks).
It is still intriguing, however, to notice that the PBE-D binding energies (filled marks) on most abundant surfaces 1–2 (1.1–1.5 eV nm−2) still significantly underestimate the experiments (grey bands; 1.7–2.9 eV nm−2). This is surprising because the PBE-D functional is known to overestimate, not underestimate, binding energies.43,44 Other shortcomings of our calculations such as the uncorrected basis set superposition errors and the assumption of perfect contacts between ideally-flat graphenes and SiO2 surfaces would also overestimate, not underestimate, the binding energies. A likely explanation for this would be that the SiO2 surfaces employed in experiments do not correspond purely to the stable surface models 1–2 but in fact expose a fair amount of reactive surface species such as 3–4. Indeed the PBE-D value on the surface model 4 (2.5 eV nm−2) is in the best agreement with the experiments (1.7–2.9 eV nm−2). In fact, a creation of dangling bonds on SiO2 surfaces by using O2 plasma has been employed to provide a fixing layer for strong binding of graphene.62
Now that we find that less stable surfaces exposing reactive surface species would show stronger binding of graphene, it is surprising to find that one of our reactive surfaces 3 (Esurf = 13.6 eV nm−2) shows a binding energy Eb of 1.1 eV nm−2, which is similar to 1.2 eV nm−2 of the most stable surface model 1 (Esurf = 0.9 eV nm−2). This should be because the silicon dangling bond (·Si) of 3 is located 1 Å below the hydroxyl (OH) group and does not participate in the interaction with graphene.
3.3 Electronic structure of graphene/SiO2
Charge transfer. Charge density difference maps of 1b–4b before and after the binding of graphene to 1–4 are defined as |
Δρ(x, y) = ρG(x, y) + ρSiO2(x, y) − ρG/SiO2(x, y)
| (3) |
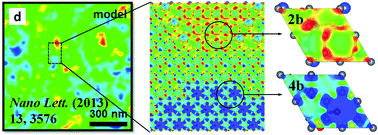
and calculated for a plane at 0.3 Å below the graphene. They are collected into one map (Fig. 4) for a schematic representation of the charge density fluctuation in graphene induced by a variety of surface states (blue for p-doping and excess of holes; red for n-doping and excess of electrons). Only for 4b we see a clear development of electron depletion localized on top of the oxygen dangling bond (O·) due to its electronegative nature. Indeed, when O2 plasma was used to provide a fixing layer for strong binding of graphene by creating dangling bonds on SiO2, a graphene transistor fabricated on it showed a dominant hole conduction but no electron conduction.62 If the graphene layer is perfect with no defect in it, the electron depletion would not be confined in 4b as much as in Fig. 4. However, in a typical graphene layer which tends to have a large amount of grain boundaries and crack-type line defects, the excess holes produced by oxygen dangling bonds (O·) as in 4b would be confined within grain boundaries surrounding them and localized in small patchwork-type areas, producing an inhomogeneous charge distribution. We thus propose that a combination of the presence of grain boundaries in graphene and the presence of reactive surface species (O· as in 4b) in a mixture of various surface species (mostly inert as in 1b–3b) on SiO2 could be one likely origin of the charge puddle observed in supported graphenes, partly supporting a previous proposition by Kang and coworkers.28
 |
| Fig. 4 Charge density fluctuation in a supported graphene schematically represented by collecting the charge density difference maps of 1b–4b obtained for a plane 0.3 Å below the graphene. The unit of the isovalue is e Å−3. Blue and red regions represent excess of holes and electrons, respectively, in graphene induced by the adsorption on the surfaces 1–4. | |
The amount of graphene-to-SiO2 electron transfer (Δq; Table 3) is defined as Δq = N0(C) – N(C), where N0(C) and N(C) are the numbers of valence electrons of graphene before and after binding on SiO2 surface, which are estimated from the Bader analysis.49–51 As expected from Fig. 4, weakly bound graphenes 1b–3b lose essentially no charge to SiO2 (|Δq| ∼ 0.001 |e| per C atom, which corresponds to a doping concentration of ∼1012 cm−2). Only the strongly bound graphene 4b loses a noticeable amount of electrons to SiO2 to produce a positively-charged (p-doped) graphene: Δq ∼ 0.03 |e| per C atom, 0.24 |e| per O· dangling bond, or a doping concentration of ∼1014 cm−2.
Table 3 Graphene/SiO2: electronic structure for PBE-D geometries
Model |
Esurf eV nm−2 |
de Å |
Eb eV nm−2 |
Δq |e|/C atom |
Eg meV |
kJ mol−1 per C atom. Band gaps of spin-up (spin-down) components. |
1b |
0.9 |
3.03 |
1.2 (3.0)a |
0.0006 |
10 |
2b |
4.2 |
3.10 |
1.5 (3.9) |
0.0016 |
5 |
3b |
13.6 |
3.01 |
1.1 (2.7) |
−0.0008 |
17 (12)b |
4b |
19.7 |
2.70 |
2.5 (6.2) |
0.0295 |
24 (24) |
Our estimation of doping concentration for the predominant states of graphene (weakly bound 1b–3b) agrees with the average background charge density of 0.9 × 1012 cm−2, which has been estimated from a tunneling differential conductance measurement using low-temperature scanning tunneling microscopy.9 The same study has also reported the amount of total charge in each puddle of the graphene (∼0.3 |e|),9 which is in the same ballpark as our estimation of charge transfer for 4b (∼0.24 |e| per O· dangling bond). Spatially resolved Raman scattering studies63,64 have shown that, while free-standing graphene monolayers are spatially homogeneous without intrinsic doping (with an upper bound of ∼1011 cm−2 for the residual carrier density), supported graphenes exhibit an order of magnitude of doping variation with a few showing a high doping over ∼1013 cm−2, which agrees with our estimation of doping concentration for 4b.
We also propose that removing or hiding such reactive sites on SiO2 by thermal annealing and passivation by hydrogen or organic layers (polymers or self-assembled monolayers of alkyl trimethoxysilane or hexamethyldisilazane) would reduce the charge puddle in graphene. Indeed, it has been shown65,66 that a graphene field-effect transistor built on a passivated SiO2 substrate exhibits a one-order-magnitude lower carrier density than on an untreated SiO2 substrate (supposedly with dangling bonds) but its device performance in terms of carrier mobility is doubled owing to effectively suppressed charge puddle scattering.
PDOS and band structure. The PDOS curves of 1b–2b are similar to each other (Fig. 5). They are essentially the same as those of their isolated components, the bare SiO2 surface 1–2 and the free-standing graphene. The total DOS curves of 1b–2b are simply a sum of those of the two isolated components without any discernible perturbation to each other. The bare SiO2 surfaces 1–2 exhibit large band gaps due to strong Si–O hybridization. The valence and conduction bands have major contributions from O and Si, respectively. Due to the large band gaps (>5 eV) of 1–2, the binding of graphene on them (1b–2b) brings no new state around the Dirac point, no strong interaction between the two components, and no discernible change in PDOS. This explains the weak binding and the essential absence of charge transfer between graphene and the surfaces 1–2. The remarkable characteristics of graphene such as the Dirac point is retained in the band structure of 1b–2b, and the band-gap opening of graphene is negligible on both surfaces (Eg = 5–10 meV; Table 3).
 |
| Fig. 5 DOS of 1b–4b projected onto each element. The energy level of each system is shown relative to the Fermi energy level EF (vertical black dashed line). The PDOS for O is reduced by a factor of six for clarity. | |
It has been reported that silicon dangling bonds on SiO2 would significantly affect the band structure of graphene and open its band gap up to 1.2 eV.28 This is not observed in our study on 3b which has silicon dangling bonds as well. The PDOS curves of 3b are similar to those of 1b–2b, except for a small amount of localized Si states (two blue peaks) near the Fermi energy level EF (vertical black dashed line) (Fig. 5 and 6), which originate exclusively from the defect states of the surface 3. These defect states appear as flat bands in the middle of the large band gap (>5 eV) on each side of EF, each of which correspond to occupied spin-up (black solid curves) and unoccupied spin-down (red dashed curves) Si states, respectively (Fig. 7). When a surface silicon loses one of its oxygen neighbors to form a silicon dangling bond (·SiOH), an occupied state in the Si–O hybridized valence-band region is shifted up to the mid-gap region, making the surface 3 unstable and supposedly reactive. However, this Si dangling bond (·Si), which is located 1 Å beneath the surface hydroxyl (OH) group and tucked away from graphene, does not form a new bond with it, and thus the mid-gap defect states of 3 as well as the Dirac point of graphene are preserved intact through the binding of graphene. The DOS for 3b is again a simple sum of those of the two isolated components without any perturbation to each other, and this is consistent with the weak binding and the negligible amount of charge transfer of graphene in 3b as well as the negligible band-gap opening (Eg = 17 and 12 meV for spin-up and spin-down component, respectively; Table 3) The same trend has been observed for threefold-coordinated Si· defect sites in the model surface of Rudenko and coworkers.67
 |
| Fig. 6 Spin-polarized PDOS defined as [PDOS (spin-up)–PDOS (spin-down)] for the topmost layer of the surfaces 3–4 (upper panel) and the composites with graphene 3b–4b (lower panel). The Dirac point of graphene (vertical green dotted line) is close to the Fermi energy EF (vertical black dashed line at 0 eV) in the case of 3b, but it is shifted up by 1 eV in the case of 4b. The PDOS for O is reduced by a factor of six. | |
 |
| Fig. 7 Band structure of 1b–4b with zoom-in near the Dirac point of graphene. The spin-up and spin-down components are represented by black solid and red dashed lines, respectively, for 3b–4b. The energy level is shown relative to EF (horizontal black dashed lines at 0 eV). | |
On the other hand, the PDOS curves and the band structure of 4b exhibit clear differences from those of 1b–3b (Fig. 5–7). Contrary to the surface 3 whose silicon dangling bonds (·SiOH) create the mid-gap defect states, the oxygen dangling bonds (HSiO·) of the surface 4 create defect states right above the high-energy edge of the valence band (upper right panel, Fig. 6), and the Fermi energy of the surface 4 is brought down from the mid-gap region to this level, leaving a small amount of unoccupied state just above EF. Contrary to the hidden silicon dangling bond (·SiOH) of surface 3, the oxygen dangling bond (HSiO·) in the topmost layer of the surface 4 is exposed towards graphene, and thus a significant amount of mixing is expected between these unoccupied defect states of 4 and the occupied states of graphene. This is captured by the broadening and the partial occupation of the unoccupied defect states of 4 after binding graphene to form 4b (lower right panel, Fig. 6). This mixing leads to the graphene-to-SiO2 electron transfer, that is, the p-doping of graphene in 4b as well as the strong binding of graphene and the shift of the Dirac point of graphene to ∼1 eV above EF (vertical green dotted line; Fig. 5 and 6) in 4b. This is consistent with the relationship between the Dirac point shift and the spatial charge inhomogeneity visualized from a differential resistance curve (dI/dV) measurement.7–9
The band gap of graphene in 4b (Eg ∼ 24 meV; Table 3) is also larger than those in 1b–3b. (The band-gap opening of 4b could be even larger than our estimation, considering that the PBE-D functional used in this study tends to underestimate the band gap.) In fact this is one of the largest band gaps calculated for graphene retaining the linear energy dispersion at the Dirac point. While previous calculations have reported band gaps as large as 0.1–2.9 eV for graphene on reactive SiO2 surfaces, the band structure and the Dirac point have been completely distorted. Thus we expect that the creation of a homogeneous distribution of oxygen dangling bonds (HSiO·) on SiO2 (001) surfaces with well-controlled O2 plasma and partial H-passivation may lead to a band-gap opening as well as a strong binding of graphene.
4 Conclusions
Four surface models were selected to represent a variety of surface states of amorphous SiO2 substrates and to study how these surface states affect the properties of graphene bound on them. Graphene barely binds on saturated stable surfaces (1b–2b) or unsaturated surfaces with silicon dangling bonds (·SiOH; 3b). Graphene strongly binds only on unsaturated surfaces exposing oxygen dangling bonds (HSiO·; 4b). Only in this model 4b the binding energy is close to the experimental values, implying that the presence of such reactive surface states should be responsible for the binding of graphene on SiO2 substrates. Only in the model 4b the adsorption of graphene leads to a significant amount of electron transfer from graphene to the surface and produces p-doped graphene, while the amount of charge transfer is negligible in the models 1b–3b. This implies that the presence of reactive surface states such as 4 on amorphous SiO2 surfaces could be one likely origin of the inhomogeneous charge distribution and the reduction of graphene mobility of supported graphenes. A better control of the surface homogeneity would therefore improve the charge transport properties of graphene for the use in electronic devices.
Acknowledgements
This work was supported by the Global Frontier Hybrid Interface Materials Program (2013M3A6B1078882), the Korean CCS 2020 Program (2013M1A8A1040838), and the Korea–India SAVI Program (2013K2A1B9066145), and the Basic Research Program (2013R1A1A3012254) of the National Research Foundation of Korea funded by the Ministry of Science, ICT & Future Planning. This work was also supported by the Brain Pool Program (121S-1-3-0380 and 131S-1-3-0504) of KOFST, the Inter-ER Cooperation Project (R0000499) of KIAT/MKE, the Grand Challenge Program (KSC-2012-C2-12) and the PLSI supercomputing resources of KISTI, and also by GIST Specialized Research Project of GIST.
Notes and references
- K. S. Novoselov, A. K. Geim, S. V. Morozov, D. Jiang, Y. Zhang, S. V. Dubonos, I. V. Grigorieva and A. A. Firsov, Science, 2004, 306, 666–669 CrossRef CAS PubMed.
- A. K. Geim and K. S. Novoselov, Nat. Mater., 2007, 6, 183–191 CrossRef CAS PubMed.
- F. Schwierz, Nat. Nanotechnol., 2010, 5, 487–496 CrossRef CAS PubMed.
- K. S. Novoselov, A. K. Geim, S. V. Morozov, D. Jiang, M. I. Katsnelson, I. V. Grigorieva, S. V. Dubonos and A. A. Firsov, Nature, 2005, 438, 197–200 CrossRef CAS PubMed.
- A. H. Castro Neto, F. Guinea, N. M. R. Peres, K. S. Novoselov and A. K. Geim, Rev. Mod. Phys., 2009, 81, 109–162 CrossRef CAS.
- S. V. Morozov, K. S. Novoselov, M. I. Katsnelson, F. Schedin, D. C. Elias, J. A. Jaszczak and A. K. Geim, Phys. Rev. Lett., 2008, 100, 016602 CrossRef CAS.
- J. Martin, N. Akerman, G. Ulbricht, T. Lohmann, J. H. Smet, K. v. Klitzing and A. Yacoby, Nat. Phys., 2007, 4, 144–148 CrossRef.
- A. Deshpande, W. Bao, F. Miao, C. N. Lau and B. J. Leroy, Phys. Rev. B: Condens. Matter Mater. Phys., 2009, 79, 205411 CrossRef.
- Y. Zhang, V. W. Brar, C. Girit, A. Zettl and M. F. Crommie, Nat. Phys., 2009, 5, 722–726 CrossRef CAS.
- A. Deshpande, W. Bao, Z. Zhao, C. N. Lau and B. J. LeRoy, Phys. Rev. B: Condens. Matter Mater. Phys., 2011, 83, 155409 CrossRef.
- E. H. Hwang, S. Adam and S. Das Sarma, Phys. Rev. Lett., 2007, 98, 186806 CrossRef CAS.
- Y. A. Eva, L. Guohong and D. Xu, Rep. Prog. Phys., 2012, 75, 056501 CrossRef PubMed.
- J. C. Meyer, A. K. Geim, M. I. Katsnelson, K. S. Novoselov, T. J. Booth and S. Roth, Nature, 2007, 446, 60–63 CrossRef CAS PubMed.
- A. Fasolino, J. H. Los and M. I. Katsnelson, Nat. Mater., 2007, 6, 858–861 CrossRef CAS PubMed.
- M. Gibertini, A. Tomadin, F. Guinea, M. I. Katsnelson and M. Polini, Phys. Rev. B: Condens. Matter Mater. Phys., 2012, 85, 201405 CrossRef.
- M. Ishigami, J. H. Chen, W. G. Cullen, M. S. Fuhrer and E. D. Williams, Nano Lett., 2007, 7, 1643–1648 CrossRef CAS PubMed.
- C. H. Lui, L. Liu, K. F. Mak, G. W. Flynn and T. F. Heinz, Nature, 2009, 462, 339–341 CrossRef CAS PubMed.
- W. G. Cullen, M. Yamamoto, K. M. Burson, J. H. Chen, C. Jang, L. Li, M. S. Fuhrer and E. D. Williams, Phys. Rev. Lett., 2010, 105, 215504 CrossRef CAS.
- J. H. Chen, C. Jang, S. Adam, M. S. Fuhrer, E. D. Williams and M. Ishigami, Nat. Phys., 2008, 4, 377–381 CrossRef CAS.
- A. Castellanos-Gomez, R. H. M. Smit, N. Agraït and G. Rubio-Bollinger, Carbon, 2012, 50, 932–938 CrossRef CAS PubMed.
- K. M. Burson, W.
G. Cullen, S. Adam, C. R. Dean, K. Watanabe, T. Taniguchi, P. Kim and M. S. Fuhrer, Nano Lett., 2013, 13, 3576–3580 CrossRef CAS PubMed.
- P. Joshi, H. E. Romero, A. T. Neal, V. K. Toutam and S. A. Tadigadapa, J. Phys.: Condens. Matter, 2010, 22, 334214 CrossRef CAS PubMed.
- H. E. Romero, N. Shen, P. Joshi, H. R. Gutierrez, S. A. Tadigadapa, J. O. Sofo and P. C. Eklund, ACS Nano, 2008, 2, 2037–2044 CrossRef CAS PubMed.
- T. P. M. Goumans, A. Wander, W. A. Brown and C. R. A. Catlow, Phys. Chem. Chem. Phys., 2007, 9, 2146–2152 RSC.
- W. Steurer, A. Apfolter, M. Koch, T. Sarlat, E. Søndergård, W. E. Ernst and B. Holst, Surf. Sci., 2007, 601, 4407–4411 CrossRef CAS PubMed.
- E. Papirer and H. Balard, The Surface Properties of Silicas, ed. A. P. Legrand, Wiley, New York, 1998 Search PubMed.
- F. Bart and M. Gautier, Surf. Sci., 1994, 311, L671–L676 CrossRef CAS.
- Y. J. Kang, J. Kang and K. J. Chang, Phys. Rev. B: Condens. Matter Mater. Phys., 2008, 78, 115404 CrossRef.
- M. Z. Hossain, Appl. Phys. Lett., 2009, 95, 143125 CrossRef PubMed.
- P. Shemella and S. K. Nayak, Appl. Phys. Lett., 2009, 94, 032101 CrossRef PubMed.
- T. C. Nguyen, M. Otani and S. Okada, Phys. Rev. Lett., 2011, 106, 106801 CrossRef.
- K. Chen, X. Wang, J. B. Xu, L. Pan and Y. Shi, J. Phys. Chem. C, 2012, 116, 6259–6267 CAS.
- P. Havu, M. Ijäs and A. Harju, Phys. Rev. B: Condens. Matter Mater. Phys., 2011, 84, 205423 CrossRef.
- X. F. Fan, W. T. Zheng, V. Chihaia, Z. X. Shen and J. L. Kuo, J. Phys.: Condens. Matter, 2012, 24, 305004 CrossRef CAS PubMed.
- F. Messina and M. Cannas, J. Phys. Chem. C, 2007, 111, 6663–6667 CAS.
- L. Levien, C. T. Prewitt and D. J. Weidner, Am. Mineral., 1980, 65, 920–930 CAS.
- P. Trucano and R. Chen, Nature, 1975, 258, 136–137 CrossRef CAS.
- G. Kresse and J. Furthmüller, Phys. Rev. B: Condens. Matter Mater. Phys., 1996, 54, 11169–11186 CrossRef CAS.
- S. Grimme, J. Comput. Chem., 2004, 25, 1463–1473 CrossRef CAS PubMed.
- S. Grimme, J. Comput. Chem., 2006, 27, 1787–1799 CrossRef CAS PubMed.
- J. P. Perdew, K. Burke and M. Ernzerhof, Phys. Rev. Lett., 1996, 77, 3865–3868 CrossRef CAS.
- J. P. Perdew, K. Burke and M. Ernzerhof, Phys. Rev. Lett., 1997, 78, 1396 CrossRef CAS.
- G. Mercurio, E. R. McNellis, I. Martin, S. Hagen, F. Leyssner, S. Soubatch, J. Meyer, M. Wolf, P. Tegeder, F. S. Tautz and K. Reuter, Phys. Rev. Lett., 2010, 104, 036102 CrossRef CAS.
- A. Otero-De-La-Roza and E. R. Johnson, J. Chem. Phys., 2012, 137, 054103 CrossRef CAS PubMed.
- P. E. Blöchl, Phys. Rev. B: Condens. Matter Mater. Phys., 1994, 50, 17953–17979 CrossRef.
- G. Kresse and D. Joubert, Phys. Rev. B: Condens. Matter Mater. Phys., 1999, 59, 1758–1775 CrossRef CAS.
- H. J. Monkhorst and J. D. Pack, Phys. Rev. B: Condens. Matter Mater. Phys., 1976, 13, 5188–5192 CrossRef.
- P. E. Blöchl, O. Jepsen and O. K. Andersen, Phys. Rev. B: Condens. Matter Mater. Phys., 1994, 49, 16223–16233 CrossRef.
- R. F. W. Bader, Atoms in Molecules: A Quantum Theory, Oxford University Press, New York, 1994 Search PubMed.
- G. Henkelman, A. Arnaldsson and H. Jónsson, Comput. Mater. Sci., 2006, 36, 354–360 CrossRef PubMed.
- W. Tang, E. Sanville and G. Henkelman, J. Phys.: Condens. Matter, 2009, 21, 084204 CrossRef CAS PubMed.
- K. Momma and F. Izumi, J. Appl. Crystallogr., 2011, 44, 1272–1276 CrossRef CAS.
- N. H. De Leeuw, F. M. Higgins and S. C. Parker, J. Phys. Chem. B, 1999, 103, 1270–1277 CrossRef CAS.
- D. R. Lide, CRC Handbook of Chemistry and Physics, CRC Press, Boca Raton, 87th edn, 2006–2007 Search PubMed.
- M. F. Yu, T. Kowalewski and R. S. Ruoff, Phys. Rev. Lett., 2001, 86, 87–90 CrossRef CAS.
- P. Staszczuk, B. Jańczuk and E. Chibowski, Mater. Chem. Phys., 1985, 12, 469–481 CrossRef CAS.
- G. M. Rignanese, A. De Vita, J. C. Charlier, X. Gonze and R. Car, Phys. Rev. B: Condens. Matter Mater. Phys., 2000, 61, 13250–13255 CrossRef CAS.
- C. F. Abrams and D. B. Graves, J. Vac. Sci. Technol., A, 1998, 16, 3006–3019 CAS.
- J. Henri, G. Han, B. Meint de, E. Miko and F. Jan, J. Micromech. Microeng., 1996, 6, 14 CrossRef.
- S. P. Koenig, N. G. Boddeti, M. L. Dunn and J. S. Bunch, Nat. Nanotechnol., 2011, 6, 543–546 CrossRef CAS PubMed.
- J. N. Israelachvili, Intermolecular and Surface Forces, Academic Press, New York, 3rd edn, 2011 Search PubMed.
- X. Liang, Z. Fu and S. Y. Chou, Nano Lett., 2007, 7, 3840–3844 CrossRef CAS.
- S. Berciaud, S. Ryu, L. E. Brus and T. F. Heinz, Nano Lett., 2009, 9, 346–352 CrossRef CAS PubMed.
- C. Casiraghi, S. Pisana, K. S. Novoselov, A. K. Geim and A. C. Ferrari, Appl. Phys. Lett., 2007, 91, 233108 CrossRef PubMed.
- K. Chen, X. Wan, D. Liu, Z. Kang, W. Xie, J. Chen, Q. Miao and J. Xu, Nanoscale, 2013, 5, 5784–5793 RSC.
- S.-Y. Chen, P.-H. Ho, R.-J. Shiue, C.-W. Chen and W.-H. Wang, Nano Lett., 2012, 12, 964–969 CrossRef CAS PubMed.
- A. N. Rudenko, F. J. Keil, M. I. Katsnelson and A. I. Lichtenstein, Phys. Rev. B: Condens. Matter Mater. Phys., 2011, 84, 085438 CrossRef.
|
This journal is © The Royal Society of Chemistry 2014 |
Click here to see how this site uses Cookies. View our privacy policy here.