Felycia E. Soetaredjo*,
Alfin Kurniawan,
L. K. Ong,
Dimas R. Widagdyo and
Suryadi Ismadji
Department of Chemical Engineering, Widya Mandala Surabaya Catholic University, Kalijudan 37, Surabaya 60114, East Java, Indonesia. E-mail: felyciae@yahoo.com; Fax: +62 31 389 1267; Tel: +62 31 389 1264
First published on 7th October 2014
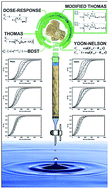
Remediation of aquatic environments polluted by toxic heavy metals has become a focus of interest for many chemical and environmental engineers throughout the world. In the present study, rice straw was employed as a low-cost agricultural waste material for the removal of Cd(II) and Pb(II) ions from single and binary solutions. Isothermal biosorption experiments were conducted at 303.15 K using a column at various flow rates and bed heights. The breakthrough curves for single metal systems were fitted with the Thomas, Yoon-Nelson, bed-depth-service-time (BDST) and dose-response models. A new semi-empirical model based on the classical Thomas equation has been developed for simulation of the breakthrough curves for binary metal systems. This modified Thomas model, combined with sorption-inhibiting coefficients determining competitive sorption behavior, was found to represent the breakthrough data very adequately. The exhausted biosorbent bed was readily regenerated using an acid elution method involving a 0.05 mol l−1 HCl solution, and was reused for five consecutive sorption–regeneration cycles without significant loss of adsorption capacity. The used biosorbent also showed economic promise in the packed bed treatment of actual electroplating wastewater containing Cd(II) and Pb(II) ions.
Over the past decade, adsorption has become the method of choice for the purification of water and wastewater. The key advantages of adsorption methods include their high efficiency, cost-effectiveness and wide adaptability, and also the fact that they are environmentally acceptable and capable of generating effluents of high quality. The success of adsorption processes is, however, strongly dependent on selection of the adsorbent material and design of the separation unit. A wide range of materials have been evaluated for the adsorption of heavy metals, including microbial and seaweed biomass (living or dead), cellular products, activated carbons, sewage sludges, clays and clay-like minerals, hybrid materials and ordered mesoporous silica.3–12 Among these, living or dead ligno-cellulosic biomass consisting of natural polymeric materials are promising alternatives to commercial adsorbents for the purification of metal-bearing effluents. These naturally occurring polymeric materials (e.g., lignin, cellulose and hemicellulose) contain hydroxyl, carboxyl, phosphate and amino functional groups, all of which possess a specific ability to bind heavy metals.13–15 With this in mind, rice straw residues, of which about 40 million tons per annum are generated in Indonesia alone, have been highlighted in the present study as a cheap source of biomass for the potential detoxification of heavy metals in aqueous solution.
In practical applications the adsorption operation is usually performed in a packed bed system, in which the effluent stream is passed through a column packed with a specific quantity of a suitable adsorbent. The design of a reliable packed bed adsorber requires the construction of a satisfactory modeling framework centered on establishing the shape of the breakthrough curve.16 The characteristic shape of the breakthrough curve of an adsorption system depends strongly on the design data, such as flow rate, initial solute concentration and the dimensions of the adsorber. In recent years an increasing number of publications have appeared in the literature dealing with heavy metal adsorption in packed bed operations and breakthrough modeling.17–21 However, studies related to single-solute adsorption are not entirely relevant to practical industrial wastewater treatment.
In practical wastewater treatment, two or more heavy metal species may coexist within the liquid system. Although a large number of studies have sought to establish mathematical models for simulating the breakthrough curves for binary or multicomponent systems, there remains a major challenge to construct a simple yet reliable model that has high accuracy and is computationally efficient. The building block of most breakthrough models for heavy metal sorption is based on rate-controlling mechanisms, typical examples being film diffusion, surface diffusion, pore diffusion, and combinations of these.22–24 Most, if not all, of these mass transfer-based models have had only limited success due to the complexity of the modeling, which often requires advanced computer resources for resolution. On the other hand a semi-empirical modification of the well-established column model can be a more effective approach for constructing breakthrough curves which give a closer match to the experimental data. In line with this, the present study has aimed at providing a new column model based on the classical Thomas model, for simulation of the breakthrough curves of heavy metal (e.g., Cd(II) and Pb(II)) sorption from binary mixtures. The effect of bed height and flow rate on the breakthrough characteristics for single and binary metal systems are discussed in detail. The practical application of rice straw in handling practical electroplating wastewater containing multiple metal ions has also been evaluated in terms of its adsorption performance and cycling efficiency, along with the possibility of transforming waste biosorbent into value-added products.
A given quantity of biosorbent was tightly packed into the column to give a bed height of 10, 15 or 20 cm. Precautions were taken to avoid channeling and air pockets within the packed bed by soaking the column in deionized water for 2 h before the biosorption experiments. Cd(NO3)2 or Pb(NO3)2, or an equimolar mixture of the two, were continuously pumped to the top of the column (downflow mode) at a prescribed flow rate (10, 20 or 30 ml min−1). A solution of 0.1 N HCl was used to adjust the pH of the metal effluents to between 5.5 and 6.0. The column experiments were conducted at room temperature over 8 h.
Preliminary investigation showed that the bed exhaustion time (te) was 8 h (te is the time at which solute concentration in the outlet stream reaches 95% of its initial concentration). Effluent samples from the exit of the column were collected periodically and analyzed for residual ion concentration. In the initial period of the experiments (2 h), 5 ml aliquots were collected every 15 min, and thereafter every half hour. Duplicate runs were conducted, and the data recorded are the mean of the two.
![]() | (1) |
![]() | (2) |
![]() | (3) |
The FTIR transmittance spectra (not shown) displayed a number of representative bands in native rice straw: stretching of H-bonded OH groups at 3418 cm−1, symmetrical stretching of sp3 C–H in CH2 groups near 2850 cm−1, stretching of CO at 1758 cm−1, assigned to carboxylic acids or aliphatic esters in lignin or hemicellulose, stretching of C
C in the aromatic rings of bound lignin at 1520 cm−1, symmetrical sp3 C–H bending at 1361 cm−1, stretching of C–O corresponding to glycosidic linkages in cellulose and hemicellulose near 1100 cm−1, out-of-plane sp2 C–H bending at 675 cm−1 and Si–O–Si stretching in silica at 524 cm−1. The binding of Cd(II) and Pb(II) on the surface of the biosorbent was confirmed by the absorption bands within the range 510–450 cm−1, possibly arising from the stretching vibration of M–O bonding, where M refers to the divalent Cd(II) and Pb(II) cations. Specifically, the coordination modes of metal–carboxylate complexes can be categorized into unidentate coordination, bidentate chelating coordination or bidentate bridging coordination.27 Taking into account the spectral information of Δv(COO−)complex and the possibility of interaction between divalent metal atom and the second carboxylate oxygen of the COO− moiety present in cellulose and hemicellulose structures, it can be suggested that Cd(II)– or Pb(II)–carboxylate complexes are coordinated in the bidentate bridging form. In this case, the bidentate carboxylate-binding mode is preferred to the monodentate mode, in order to minimize the steric repulsion between the incoming metal ions and the ligand moiety. Furthermore, the clear shift to lower wavenumbers in the position of the stretching peaks of hydroxyl and carboxylic groups near 3400 and 1750 cm−1 identifies the chemical interaction between metal species and these surface functional groups during the biosorption process.
In Fig. 1 it may be seen that the gradient of the breakthrough curves became less sharp with increasing bed height, representing a greater degree of bed uptake capacity. The mass transfer zone (MTZ) (i.e., the active part of the packed bed where adsorption actually takes place) in the Cd(II)-loaded column was 7.67, 10.47 and 11.96 cm for 10, 15 and 20 cm bed height, respectively. A longer time to reach the break point was also accomplished using beds of increased height. The dynamic uptake capacity at 1% breakthrough for a 15 cm packing height was 6.20 × 10⁻⁴ mmol g−1 (0.070 mg g−1) for Cd and 6.72 × 10⁻⁴ mmol g−1 (0.139 mg g−1) for Pb; these values were increased to 6.74 × 10⁻⁴ mmol g−1 (0.076 mg g−1) and 7.30 × 10⁻⁴ mmol g−1 (0.151 mg g−1), respectively, for a 20 cm bed height by feeding the effluent at 10 ml min−1.
This indicates that an increased bed height provided a greater depth of MTZ for the metal effluent to travel before reaching the exit, thus allowing a delayed breakthrough and an increase in the throughput volume of solution treated, ultimately extending the lifetime of the bed. With regard to bed exhaustion, beds with smaller heights become saturated more quickly due to a reduction in the number of superficial areas of the adsorbent, and consequently the active sites available for sorption.
Furthermore, lower adsorption capacity at 1% breakthrough was obtained at higher flow rates. For example, by doubling the flow rate from 10 to 20 ml min−1, the 20 cm breakthrough capacity of Cd(II) decreased from 6.74 × 10⁻⁴ mmol g−1 (0.076 mg g−1) to 5.72 × 10⁻⁴ mmol g−1 (0.064 mg g−1), and a further decrease to 4.48 × 10⁻⁴ mmol g−1 (0.050 mg g−1) was noted as the flow rate increased to 30 ml min−1.
![]() | (4) |
The second model applied for correlating the breakthrough curve was the Yoon-Nelson model. This model was developed by assuming that the rate of decrease in the probability of adsorption for each solute was proportional to the probability of its sorption and the breakthrough on the adsorbent.29 The original and linearized forms of the Yoon-Nelson model for single component adsorption may be expressed by eqn (5) and (6), as follows:
![]() | (5) |
![]() | (6) |
The third model used for breakthrough curve analysis was the BDST model. The underlying assumption of the BDST model is that the adsorption rate is proportional both to the unused capacity of the adsorbent and to the remaining concentration of solute in the liquid phase, by neglecting the axial dispersion factor. The BDST model is regarded as a simple yet reliable model based on physical measurement of the adsorption capacity of the bed for different breakthrough values. The classical BDST model is expressed as follows:30
![]() | (7) |
Eqn (7) has been further modified by Hutchins31 to estimate the bed height required for a given service time at breakthrough point:
![]() | (8) |
Solving eqn (8) for Z by substituting tb = 0:
![]() | (9) |
![]() | (10) |
![]() | (11) |
The regression analysis of all column models against experimental breakthrough data was performed using Systat SigmaPlot 12.3.1 software, and the correlation model parameters obtained were used to construct the predicted breakthrough curves shown in Fig. 2. The accuracy of prediction of the models was further determined by computing the root mean square error (RMSE), defined as follows:
![]() | (12) |
As shown in Fig. 1, very good agreement is seen between the experimental and predicted column data by the Thomas, Yoon-Nelson and dose-response models. The coefficients of determination (R2) for the three models are mostly greater than 0.94. The column correlation coefficients associated to each model are summarized in Tables 1 and 2.
Thomas model | ||||||
---|---|---|---|---|---|---|
Metal | Bed height (cm) | KTh (l mmol−1 min−1) | qmax (mmol g−1) | qbeda (mmol g−1) | RMSE | R2 |
a Dynamic uptake capacity, determined by eqn (1). | ||||||
Cadmium | 10 | 3.06 | 1.62 × 10⁻³ | 1.39 × 10⁻³ | 0.056 | 0.948 |
15 | 2.71 | 1.39 × 10⁻³ | 1.18 × 10⁻³ | 0.046 | 0.976 | |
20 | 2.64 | 1.20 × 10⁻³ | 1.09 × 10⁻³ | 0.029 | 0.981 | |
Lead | 10 | 3.25 | 1.79 × 10⁻³ | 1.53 × 10⁻³ | 0.089 | 0.940 |
15 | 2.87 | 1.54 × 10⁻³ | 1.29 × 10⁻³ | 0.025 | 0.972 | |
20 | 2.79 | 1.32 × 10⁻³ | 1.18 × 10⁻³ | 0.016 | 0.984 |
Yoon-Nelson model | ||||||
---|---|---|---|---|---|---|
Metal | Bed height (cm) | KYN (min−1) | τ (min) | τexp (min) | RMSE | R2 |
Cadmium | 10 | 0.030 | 194 | 182 | 0.060 | 0.943 |
15 | 0.027 | 246 | 236 | 0.048 | 0.967 | |
20 | 0.026 | 285 | 293 | 0.034 | 0.982 | |
Lead | 10 | 0.034 | 170 | 180 | 0.079 | 0.949 |
15 | 0.028 | 241 | 238 | 0.051 | 0.960 | |
20 | 0.026 | 282 | 271 | 0.023 | 0.977 |
Dose-response model | ||||||
---|---|---|---|---|---|---|
Metal | Bed height (cm) | q (mmol g−1) | b1 (ml) | d | RMSE | R2 |
Cadmium | 10 | 1.47 × 10⁻³ | 1721.37 | 3.94 | 0.038 | 0.993 |
15 | 1.30 × 10⁻³ | 2284.10 | 4.86 | 0.031 | 0.995 | |
20 | 1.15 × 10⁻³ | 2694.45 | 6.42 | 0.021 | 0.998 | |
Lead | 10 | 1.42 × 10⁻³ | 1428.62 | 3.89 | 0.025 | 0.997 |
15 | 1.27 × 10⁻³ | 2231.39 | 4.89 | 0.024 | 0.996 | |
20 | 1.18 × 10⁻³ | 2764.74 | 6.44 | 0.022 | 0.997 |
Thomas Model | ||||||
---|---|---|---|---|---|---|
Metal | Flow rate (ml min−1) | KTh (l mmol−1 min−1) | qmax (mmol g−1) | qbeda (mmol g−1) | RMSE | R2 |
a Dynamic uptake capacity, determined by eqn (1). | ||||||
Cadmium | 10 | 2.64 | 1.20 × 10⁻³ | 1.09 × 10⁻³ | 0.029 | 0.981 |
20 | 3.15 | 1.03 × 10⁻³ | 0.85 × 10⁻³ | 0.022 | 0.958 | |
30 | 3.36 | 0.92 × 10⁻³ | 0.79 × 10⁻³ | 0.052 | 0.965 | |
Lead | 10 | 2.79 | 1.32 × 10⁻³ | 1.18 × 10⁻³ | 0.016 | 0.984 |
20 | 3.24 | 1.22 × 10⁻³ | 1.08 × 10⁻³ | 0.024 | 0.941 | |
30 | 3.45 | 1.11 × 10⁻³ | 0.96 × 10⁻³ | 0.023 | 0.958 |
Yoon-Nelson model | ||||||
---|---|---|---|---|---|---|
Metal | Flow rate (ml min−1) | KYN (min−1) | τ (min) | τexp (min) | RMSE | R2 |
Cadmium | 10 | 0.026 | 285 | 293 | 0.034 | 0.982 |
20 | 0.029 | 168 | 147 | 0.074 | 0.954 | |
30 | 0.033 | 157 | 142 | 0.041 | 0.968 | |
Lead | 10 | 0.026 | 282 | 271 | 0.023 | 0.977 |
20 | 0.030 | 190 | 180 | 0.051 | 0.948 | |
30 | 0.035 | 139 | 128 | 0.051 | 0.939 |
Dose-response model | ||||||
---|---|---|---|---|---|---|
Metal | Flow rate (ml min−1) | q (mmol g−1) | b1 (ml) | d | RMSE | R2 |
Cadmium | 10 | 1.15 × 10⁻³ | 2694.45 | 6.42 | 0.021 | 0.998 |
20 | 1.21 × 10⁻³ | 2835.03 | 3.89 | 0.022 | 0.998 | |
30 | 1.82 × 10⁻³ | 4264.26 | 3.64 | 0.032 | 0.995 | |
Lead | 10 | 1.18 × 10⁻³ | 2764.74 | 6.44 | 0.022 | 0.997 |
20 | 1.46 × 10⁻³ | 3420.78 | 4.03 | 0.030 | 0.995 | |
30 | 1.57 × 10⁻³ | 3678.51 | 3.62 | 0.023 | 0.998 |
The rate constants for the Thomas (KTh) and Yoon-Nelson (KYN) models decreased with increasing bed height and decreasing flow rate. The relationship between rate constant and bed height can be understood on the basis that the rate at which the MTZ traveled through the bed decreased with bed height, due to the increasing number of service areas treating the effluent. The higher rate constant suggested that a shorter bed would be sufficient to avoid breakthrough.33
The maximum bed adsorption capacity obtained from the Thomas model prediction ranged between 0.92 × 10⁻³ and 1.79 × 10⁻³ mmol g−1 within the experimental conditions. However, the prediction overestimated the qbed values obtained from eqn (1) by between 10 and 21%. This conspicuous difference has also been observed in a number of other column studies.34–36 The increase in adsorption rate constant with flow rate might be attributed to a decrease in the fluid-film mass transfer resistance, meaning that solute molecules could diffuse more easily from the liquid to the solid phase. The correlation of column data by the Yoon-Nelson model also indicated that the time required for adsorbing 50% of the initial concentration decreased with increasing flow rate and decreasing bed height. In addition, the estimate of the time required to reach 50% breakthrough was very close to the values obtained experimentally.
The breakthrough curves predicted by the dose-response model showed an excellent fit to the experimental data. The column parameters associated with this model (q, b1 and d) confirmed the dependence of these parameters on flow rate and the height of packed biosorbent. With an increase in mass of biosorbent from 11.71 g (10 cm) to 23.43 g (20 cm), the values of parameter q decreased from 1.42 × 10⁻³ to 1.18 × 10⁻³ mmol g−1 for Pb(II). The adsorption capacity of Cd(II) at 50% break point increased from 1.15 × 10⁻³ to 1.82 × 10⁻³ mmol g−1 as the flow rate increased from 10 to 30 ml min−1; a similar effect applied to Pb(II) sorption. The parameter b1 associated with the volumetric throughput at 50% break point also increased with increasing bed height and flow rate. The values of q and b1 were each in conformity with the experimental data. The model constant (d) increased with increase in bed height and decrease in flow rate, suggesting that parameter d of the dose-response model might be related to the design of the fixed bed column, with improved adsorption performance.
The relationship between bed height and breakthrough level can be studied by applying the BDST model to the column data. ESI Fig. S3† shows the specific trends in the BDST column parameters (N0, Ka and Z0) with variation in the breakthrough points. The dynamic bed capacity of Cd(II) gradually increased from 0.127 to 0.154 mmol l−1 within a 1–40% breakthrough range. Within a breakthrough range of 60–95%, the dynamic bed capacity decreased and then increased to its highest point, 0.160 mmol l−1. A similar trend was observed in the sorption of Pb(II), in which there was a sharp increase in the value of N0 between 1% and 40% breakthrough, followed by a slight increase over the breakthrough range 60–95%. At low breakthrough points, there are a large number of vacant adsorption sites on the biosorbent, allowing metal ion uptake to occur with limited or no resistance. The dynamic capacity at 95% breakthrough (saturation) was found to be 0.160 mmol l−1 (0.11 mg g−1) for Cd(II) and 0.198 mmol l−1 (0.25 mg g−1) for Pb(II). Meanwhile, a gradually diminishing rate of transfer of solute from bulk fluid to the solid phase (Ka) with increasing breakthrough level was noticed, and the value of Ka remained relatively constant between 60 and 95% breakthrough. This might be ascribed to the limited degree of metal ion uptake, since more adsorption sites were occupied and an increasing proportion of the packed bed became saturated as the volume of effluent flowing into the column increased. The effect of diffusional resistance might also contribute significantly at high-end breakthrough levels, leading to slower uptake of metal ions.
The critical bed heights calculated at various breakthrough points showed a trend similar to that of the adsorption rate constant. For breakthrough points beyond 50%, it was not possible to calculate the critical bed height, due to the negative value of the natural logarithmic expression in eqn (9). This has also been confirmed by other authors,37–39 indicating that the BDST model may be used only for interpretation of the initial part of the breakthrough curve, up to 50% breakthrough.
At 50% breakthrough the natural logarithmic expression in eqn (8) is reduced to zero and the bed capacity is estimated to be 0.157 mmol l−1 (0.11 mg g−1) for Cd(II) and 0.194 mmol l−1 (0.24 mg g−1) for Pb(II). These values are considerably lower than those reported by Bhatia and his group39 for cadmium and lead ions removal in a fixed-bed column by a macro-fungus. They obtained an estimated 50% breakthrough capacity per unit bed volume of 8.54 and 7.72 mmol l−1 for Cd(II) and Pb(II) ions, respectively.
The fruit body of the oyster mushroom (Pleurotus platypus) has been utilized for the fixed-bed column removal of Cd(II) from industrial wastewater by Vimala and co-workers.40 A breakthrough capacity per unit bed volume of 21.51 mmol l−1 was obtained from the BDST model prediction. A low adsorption capacity of the biomass bed was expected, and was probably due to the initial metal concentration used in the column experiments. It is well known that adsorption is a concentration-driven surface phenomenon, and the dependence of dynamic bed capacity on the initial solute concentration is confirmed mathematically from the slope of the linear BDST plot in eqn (8). We purposely used low influent metal concentrations (1.12 mg l−1 of Cd(II) and 2.07 mg l−1 of Pb(II)) to represent the actual range of heavy metal contamination present in local public water systems.
Other fixed bed column parameters (e.g., linear velocity) and the characteristics of the packing adsorbent might also contribute to determining the bed uptake capacity. Table 3 summarizes a comparison of the adsorption performance of various biosorbent materials for the single removal of Cd(II) and Pb(II) ions in a fixed bed operation. The poor prediction of the BDST model beyond a 50% breakthrough point could be attributed to the complex mechanisms of the binding of metal ions by the biosorbent, which might involve two or more rate-limiting steps, including ion exchange, coordination, complexation, chelation, micro-precipitation, adsorption and surface adsorption–complexation. Interestingly, the curve shows an S-like pattern for the variation of critical bed height with breakthrough points (ESI Fig. S3†), confirming the interrelationship of critical bed height and axial flow of MTZ inside the bed column.
Biomass | Influent Concentration (mmol l−1) | Column parameters | Predicted bed capacity (mmol l−1) | Reference | |
---|---|---|---|---|---|
Flow rate (ml min−1) | Bed Height (cm) | ||||
P-doped rice husk | 0.05 – Pb(II) | 20 | 10–30 | 2.51 × 10⁻³ | 20 |
Wheat straw | 0.89 – Cd(II) | 1000 | 50–200 | 2.77 | 34 |
Allspice residue | 0.07 – Pb(II) | 20 | 15 | 11.75 – Pb(II) | 38 |
Sunflower waste carbon calcium-alginate beads | 0.09 – Cd(II) | 1 | 10–30 | 0.07 | 39 |
Macro fungus (Pycnoporus sanguineus) | 0.7 – Cd(II) | 10 | 4–15 | 7.72 – Pb(II) | 40 |
0.38 – Pb(II) | 8.54 – Cd(II) | ||||
Macro fungus (Pleurotus platypus) | 0.09 – Cd(II) | 5 | 5–15 | 21.51 | 41 |
Filamentous green algae (Spirogyra neglecta) | 0.24 – Pb(II) | 5 | 1 | 0.88 | 42 |
Spent Agaricus bisporus | 0.24 – Pb(II) | 5 | 4 | 32.01 | 43 |
Palm oil boiler mill fly ash | 0.18 – Cd(II) | 5 | 1–2 | 75.80 | 44 |
Rice straw | 0.01 – Cd(II) | 10 | 10–20 | 0.157 – Cd(II) | This study |
0.01 – Pb(II) | 0.194 – Pb(II) |
Based on an analysis of all the column models discussed above, it could be deduced that the Yoon-Nelson and dose-response models provided a satisfactory representation for the present column system with respect to statistical parameters (RMSE or R2) and the theoretical justification of the model parameters. From the goodness-of-fit point of view, the Thomas, Yoon-Nelson and dose-response models were all in general acceptable. While the BDST model demonstrated a satisfying linear correlation between column service time and bed height, the failure of this model beyond 50% breakthrough was inevitable. Further weaknesses of the BDST model were, firstly, that it assumed the adsorption of single solute in the liquid phase system and, secondly, it was unable to address the important effect of changes in pH, ionic form of the adsorbent or solute concentration on the column performance.37 Regarding the Thomas model, the prediction of column kinetic data fell reasonably within the measured range, although a fairly significant deviation tended to occur within the initial part of the breakthrough curves. Additionally, a packing height of 10 cm was considered as the optimum bed height, since an increase in packing height of 5 cm or 10 cm to this point was insignificant in terms of the percentage metal removal (Table 4).
Metal | Bed height (cm) | Flow rate (ml min−1) | tba (min) | tea (min) | MTZc (cm) | qbb (×10−4 mmol g−1) | Ve (ml) | % Rd |
---|---|---|---|---|---|---|---|---|
a Experimentally determined from Fig. 1, tb and te were considered at 1% and 95% break points, respectively.b The bed adsorption capacity at 1% breakthrough, determined by eqn (3).c Mass transfer zone is calculated by Z = (1 − tb/te) where Z is the bed height (cm).d Removal percentage was calculated by dividing Mr with the influent metal load (VeC0). | ||||||||
Cadmium | 10 | 10 | 68 | 292 | 7.67 | 5.81 | 2920 | 93.5 |
20 | 27 | 210 | 8.71 | 4.61 | 4200 | 85.6 | ||
30 | 15 | 205 | 9.27 | 3.84 | 6150 | 78.7 | ||
15 | 10 | 109 | 361 | 10.47 | 6.20 | 3610 | 93.8 | |
20 | 48 | 240 | 12.00 | 5.46 | 4800 | 85.8 | ||
30 | 25 | 233 | 13.39 | 4.27 | 6990 | 79.2 | ||
20 | 10 | 158 | 393 | 11.96 | 6.74 | 3930 | 94.0 | |
20 | 67 | 272 | 15.07 | 5.72 | 5440 | 86.1 | ||
30 | 35 | 267 | 17.38 | 4.48 | 8010 | 79.4 | ||
Lead | 10 | 10 | 72 | 270 | 7.33 | 6.15 | 2700 | 95.4 |
20 | 32 | 212 | 8.49 | 5.47 | 4240 | 87.6 | ||
30 | 18 | 178 | 8.99 | 4.61 | 5340 | 81.2 | ||
15 | 10 | 118 | 361 | 10.10 | 6.72 | 3610 | 95.7 | |
20 | 51 | 271 | 12.18 | 5.81 | 5420 | 87.8 | ||
30 | 29 | 210 | 12.93 | 4.95 | 6300 | 81.5 | ||
20 | 10 | 171 | 395 | 11.34 | 7.30 | 3950 | 96.1 | |
20 | 73 | 300 | 15.13 | 6.23 | 6000 | 88.2 | ||
30 | 42 | 237 | 16.46 | 5.38 | 7110 | 82.0 |
The general view of binary and/or multicomponent systems is that the solute species compete with one another for the available adsorption sites on the solid surface. Such behavior affects the rate of sorption of each solute, and consequently its concentration in the adsorbed phase. Therefore, the effect of competitive adsorption should be incorporated in the design model, and for this purpose we have introduced two dimensionless parameters as follows:
![]() | (13) |
![]() | (14) |
![]() | (15) |
![]() | (16) |
The solution of eqn (15) and (16) can readily be obtained by nonlinear regression curve fitting, using Systat SigmaPlot 12.3.1 software or the Microsoft Excel ‘Solver’ function. To start the computation the initial values of all the fitted parameters were randomly estimated, with the following constraints: θ1 > 0, θ2 > 0, q1,max > 0, q2,max > 0 and θ1 + θ2 < 1. The computation was conducted point by point until the tolerance and convergence tests were fulfilled. We considered that the total portion of metal ions adsorbed on the surface (θ1 + θ2) was less than unity, by considering the free-volume fraction (porosity) in a fixed bed in which adsorption did not take place. The bed porosity (ε) was determined using eqn (17):
![]() | (17) |
Bed height (cm) | Flow rate (ml min−1) | Experimental | Fitted parameters | Calculated parameters | RMSE | R2 | |||||||
---|---|---|---|---|---|---|---|---|---|---|---|---|---|
qbed,1 (mmol g−1) | qbed,2 (mmol g−1) | θ1 | θ2 | qmax,1/bin (mmol g−1) | qmax,2/bin (mmol g−1) | I12 | I21 | KTh,1/bin (l mmol−1 min−1) | KTh,2/bin (l mmol−1 min−1) | ||||
10 | 10 | 1.24 × 10⁻³ | 1.44 × 10⁻³ | 0.35 | 0.42 | 1.41 × 10⁻³ | 1.57 × 10⁻³ | 0.55 | 0.45 | 1.38 | 1.79 | 0.024 | 0.987 |
20 | 1.74 × 10⁻³ | 1.96 × 10⁻³ | 0.37 | 0.43 | 1.96 × 10⁻³ | 2.13 × 10⁻³ | 0.54 | 0.46 | 1.69 | 1.92 | 0.017 | 0.993 | |
30 | 2.06 × 10⁻³ | 2.38 × 10⁻³ | 0.40 | 0.45 | 2.33 × 10⁻³ | 2.69 × 10⁻³ | 0.53 | 0.47 | 1.86 | 2.08 | 0.019 | 0.995 | |
15 | 10 | 0.95 × 10⁻³ | 1.12 × 10⁻³ | 0.36 | 0.42 | 1.08 × 10⁻³ | 1.29 × 10⁻³ | 0.54 | 0.46 | 1.25 | 1.55 | 0.021 | 0.989 |
20 | 1.31 × 10⁻³ | 1.53 × 10⁻³ | 0.38 | 0.44 | 1.46 × 10⁻³ | 1.75 × 10⁻³ | 0.54 | 0.46 | 1.57 | 1.84 | 0.017 | 0.992 | |
30 | 1.49 × 10⁻³ | 1.75 × 10⁻³ | 0.40 | 0.45 | 1.62 × 10⁻³ | 1.92 × 10⁻³ | 0.53 | 0.47 | 1.74 | 1.94 | 0.017 | 0.995 | |
20 | 10 | 8.74 × 10⁻⁴ | 9.48 × 10⁻⁴ | 0.36 | 0.42 | 9.71 × 10⁻⁴ | 1.08 × 10⁻³ | 0.54 | 0.46 | 1.21 | 1.51 | 0.020 | 0.984 |
20 | 1.12 × 10⁻³ | 1.34 × 10⁻³ | 0.38 | 0.44 | 1.24 × 10⁻³ | 1.44 × 10⁻³ | 0.54 | 0.46 | 1.45 | 1.75 | 0.014 | 0.997 | |
30 | 1.35 × 10⁻³ | 1.56 × 10⁻³ | 0.41 | 0.46 | 1.48 × 10⁻³ | 1.71 × 10⁻³ | 0.53 | 0.47 | 1.58 | 1.83 | 0.022 | 0.991 |
It has been shown in Fig. 2 that the modified Thomas model correlated well with the experimental breakthrough curves for binary system (R2 ∼ 0.99), but the graphical fit showed that the original Thomas model (solid lines) was generally inadequate for describing the binary adsorption breakthrough curves, and an amplifying confirmation was provided by the coefficient of determination (0.5 < R2 < 0.7). The incorporation of the dimensionless parameters, θ1 and θ2, to account for the effect of competitive adsorption between two solutes was therefore helpful in improving the goodness-of-fit of the proposed model. The values of the calculated parameters (KTh,1 and KTh,2) confirmed the applicability of the proposed modified Thomas model, in which the adsorption rate constants for each solute in the binary system were lower than the corresponding values for the single system. The presence of competing solutes not only decreases the adsorption rate constant, but also the maximum solid phase concentration of each solute. The values of the fractional parameters, θ1 and θ2, obtained by non-linear regression analysis showed that higher amounts of Pb(II) were sorbed on the packed bed.
EDXRF was performed to analyze the heavy metal content in the packed bed and to examine the conformity between EDXRF measurement and its theoretical calculation. The results indicate an error of at most 18% between the EDXRF measurement and the theoretical calculation, indicating that θ1 and θ2 can be treated as fractional parameters representing the amount of solutes adsorbed, in addition to the empirical correction coefficients for improving the graphical fit. The maximum bed adsorption capacity of Cd(II) predicted by the modified Thomas model declined from 1.62 × 10⁻³ mmol g−1 (0.18 mg g−1) to 1.41 × 10⁻³ mmol g−1 (0.16 mg g−1) when Pb(II) was present in the effluent for the fixed bed experiment at a flow rate of 10 ml min−1 and 10 cm bed height. Under these conditions, the maximum adsorption capacity of Pb(II) in the binary system was 1.57 × 10⁻³ mmol g−1 (0.33 mg g−1), compared to 1.79 × 10⁻³ mmol g−1 (0.37 mg g−1) in the single system.
Regarding the fitted parameters, θ1 and θ2, it can be implied that Pb(II) ions were adsorbed in preference to Cd(II), which may be ascribed to the smaller hydrated ionic radius of Pb(II) (4.01 Å) than Cd(II) (4.26 Å). It has been noted that the greater the hydration of the ion, the farther it is from the adsorbing surface, and the weaker its adsorptive capability. A consistent link between the hydrated ionic radii of the metals and their dynamic adsorption capacity was confirmed in the present study. Furthermore, according to Pearson's hard and soft (Lewis) acids and bases concept,45 the Cd(II) cation is a “soft” Lewis acid, whereas the Pb(II) cation is a borderline Lewis acid. The Pb(II) cation can therefore form stronger complexes than the Cd(II) cation with electronegative ligands that are “hard” Lewis bases, such as F−, OH− or RO− (carboxylate oxygen).
Increasing the solution flow rate resulted in an increased level of metal complex on the surface, whereas an increase in bed height had a small or no effect. Interestingly, the calculated sorption-inhibiting coefficients of the two metal ions showed a weak dependence on variation in flow rate and bed height. According to the results obtained, it can now be suggested that on changing either the flow rate or the bed height, the extent of competition between the adsorbed components remains essentially unchanged. Our hypothetical conclusion is that the extent of competition between the two solutes is more dependent on their initial concentrations in the binary system. Accordingly, further systematic investigation in this direction will be necessary by conducting the sorption-column tests using mixtures of various solute compositions.
![]() | (18) |
Metal | Cycle no. | tb (min) | te (min) | qbb (mg g−1) | qeb (mg g−1) | Desorption (mg g−1) | Regeneration efficiency (%) |
---|---|---|---|---|---|---|---|
a Note: bed height: 10 cm and flow rate of the metal influent and desorbing solution (0.5 N HCl): 10 ml min−1.b The bed adsorption capacity at 1% and 95% breakthrough were calculated using eqn (3). | |||||||
Cadmium | 1 | 68 | 292 | 0.065 | 0.280 | 0.265 | Original |
2 | 65 | 287 | 0.062 | 0.276 | 0.263 | 98.57 | |
3 | 60 | 275 | 0.058 | 0.264 | 0.251 | 94.29 | |
4 | 54 | 262 | 0.052 | 0.252 | 0.242 | 90.00 | |
5 | 50 | 247 | 0.048 | 0.237 | 0.227 | 84.64 | |
Lead | 1 | 72 | 270 | 0.127 | 0.478 | 0.439 | Original |
2 | 70 | 262 | 0.124 | 0.464 | 0.420 | 97.07 | |
3 | 65 | 252 | 0.115 | 0.446 | 0.411 | 93.31 | |
4 | 62 | 240 | 0.110 | 0.425 | 0.389 | 88.91 | |
5 | 57 | 215 | 0.101 | 0.380 | 0.343 | 79.50 |
Fig. 3 shows a set of graphical information about the desorption profiles of cadmium and lead ions through a 10 cm packed bed. A 93% recovery of Cd(II) was achieved by placing the exhausted bed in contact with 0.1 N HCl solution for 50 min, corresponding to a throughput volume of 0.50 l. After 30 min, a five-fold increase in the concentration of HCl solution resulted in an increase in desorption efficiency from 74.6 to 91.1%. On the other hand, 0.1 N HCl (0.60 l) gave almost complete desorption of Pb(II) ions (∼98%), and the throughput volume was reduced to 0.50 l using 0.5 N HCl solution.
Desorption of metal ions from the biosorbent wall takes place through an equivalent exchange reaction in which one mole of divalent Cd(II) or Pb(II) ions is displaced by two moles of H+ ions.46 Thus, an increase in the concentration of H+ ions in the desorbent solution leads to an enhanced exchange performance between H+ ions and metal ions at the solid–solution interface.
The stability performance of the biosorbent bed for up to five successive sorption–regeneration cycles was evaluated and the results are presented in Fig. 3(b). Prior to further cycles of adsorption–desorption, the eluted bed was washed a number of times with deionized water, until the pH of the washing solution was in the range 5.0–6.0. The washing step is essential to remove excess H+ ions deposited on the surface of the biosorbent. It was shown that the adsorption capacity of the bed was almost equal for the first two cycles, but then dropped progressively from the third cycle to the fifth. The desorption of Pb(II) was nearly 90–92%, and in excess of 94% of sorbed Cd(II) was desorbed in each successive cycle. The lower desorption efficiency of Pb(II) reflects once again the higher adsorption affinity of the biosorbent for this metal ion. Compared to the original bed sorption capacity, the values after the fifth cycle corresponded to 84.64% for Cd(II) and 79.50% for Pb(II), showing good adsorptive retention efficiency, even though the biosorbent bed had been reused several times. By the end of the fifth cycle, about 2.97 and 3.26 l of individual effluents containing Cd(II) or Pb(II) ions had effectively been treated to reach the permissible concentration prior to discharge. The loss of biosorption performance after the bed had been consecutively regenerated and reused was due mainly to the detrimental effect of desorbing solution.47
Continual contact between HCl solution and biosorbent bed not only resulted in the dislocation of sorbed metal ions, but led also a gradual deterioration in the biosorbent structure. The SEM image in Fig. 3(c) shows some visible changes on the biosorbent surface structure after multiple sorption–regeneration cycles, indicating the leaching effect of hydrochloric acid during desorption, which may be responsible for the reduced metal biosorption capacity of the regenerated bed. An additional plausible reason for the decrease in the bed adsorption capacity during further cycles of adsorption and desorption could be the incomplete desorption of metal ions.
The management of solid waste is an environmental concern which has to be taken into account, since the disposal of metal-laden adsorbent on the land can contaminate the soil and leach into groundwater. The conversion of waste adsorbent materials to high-value end-products is therefore of considerable interest for environmental sustainability. The adsorptive capacity of the regenerated bed was considerably reduced after the tenth cycle, when less than 10% of its original adsorption capacity was retained. Elemental analysis by an EDXRF technique showed that the biosorbent bed contained 0.15 mmol g−1 (1.69 wt%) of Cd(II) and 0.16 mmol g−1 (3.31 wt%) of Pb(II).
An effective treatment for the solid waste is to employ a two-step thermal activation process at 700 °C for 4 h under a nitrogen atmosphere, followed at 900 °C for 2 h in an oxidizing (air) environment, producing activated carbon of high surface area. The porous properties and structural morphology of the resultant activated carbon are given in ESI Table S1 and Fig. S4, respectively.† The cadmium oxide- and lead oxide-impregnated carbons are each high-value products and may be further applied in a composite electrode for the electrocatalytic sensing of gaseous, inorganic and organic analytes,48 catalysis of various oxidation and reduction reactions of gases and/or liquid chemicals,49 or sorption-based water purification.50
The BDST laboratory-scale column parameters were used for prediction of the service time of the scaled-up column. The values obtained at a given flow rate (Q) and initial feed concentration (C0) from laboratory-scale tests were used to calculate the BDST column parameters without further experimental determination, according to the relationship proposed by Cooney:33
![]() | (19) |
Eqn (19) was used to assess the change in dynamic adsorption capacity with flow rate. The intercept of the BDST equation related to adsorption rate constant remained unchanged with flow rate, and the new intercept value was thus equal to the old one. On the other hand, the slope and y-intercept of the BDST equation were both changed when the initial feed concentration was changed, and the new values can be calculated as follows:
![]() | (20) |
![]() | (21) |
ESI Fig. S5a† shows the breakthrough curves for the individual heavy metals present in actual wastewater after biosorption through a 10 cm bed. It can be seen that the breakthrough curves for the biosorption of Cu(II), Cd(II) and Pb(II) ions each evolved in a similar manner, resembling the typical S-shape, while deformed breakthrough curves were observed for Cr(VI), Fe and Ni(II) ions. The deformed breakthrough curves for Cr(VI), Fe and Ni(II) ions might have been the result of the slow adsorption kinetics of these metal ions due to competition from other metal ions possessing greater specific binding affinity for certain surfaces.
The biosorbent bed also exhibited a lower adsorption capacity for Cd(II) (6.84 × 10⁻⁴ mmol g−1) and Pb(II) (9.64 × 10⁻⁴ mmol g−1) in the case of actual wastewater, compared to that in single and binary synthetic effluents. The loss of adsorption capacity may be attributed to the presence of multi-metal ions in the actual wastewater. ESI Fig. S5b† shows the percentage removal of each heavy metal, and it is clear that more than 50% of the total Cd(II) and Pb(II) ions in the real wastewater can still be removed using an appropriate amount of packed biosorbent.
The plots of the bed service time at breakthrough, obtained from experimental measurements and prediction by eqn (20) and (21) for Cd(II) and Pb(II) ions, are presented in ESI Fig. S5c.† For other heavy metals the figures are not presented, due to the unavailability of column data from laboratory-scale experiments. In Fig. S5c† it can be seen that for a 10 cm bed height, the predicted 1% breakthrough service time for Cd(II) and Pb(II) ions was 30 and 37 min, respectively. On the other hand, the predicted values are quite different from the experimental results, in which the 1% breakthrough service time was 18 min for Cd(II) and 28 min for Pb(II). This might suggest that the application of the BDST relationship proposed by Cooney for the purpose of column scale-up was limited to an adsorption system under comparable circumstances. Since real electroplating wastewater was used in the scale-up experiments, whereas synthetic aqueous solutions of Cd(II) and Pb(II) ions were used in the laboratory-scale tests, it is reasonable to expect some deviation between experimental and predicted breakthrough service time for such adsorption systems with different characteristics.
Footnote |
† Electronic supplementary information (ESI) available. See DOI: 10.1039/c4ra06425a |
This journal is © The Royal Society of Chemistry 2014 |