
Fluorescence quenching between unbonded graphene quantum dots and gold nanoparticles upon simple mixing†
Yi Liua,
Wei Quan Loha,
Arundithi Ananthanarayanana,
Cheng Yangb,
Peng Chena and
Chenjie Xu*a
aDivision of Bioengineering, School of Chemical and Biomedical Engineering, Nanyang Technological University, 70 Nanyang Drive, 637457, Singapore. E-mail: cjxu@ntu.edu.sg
bDivision of Energy & Environment, Graduate School at Shenzhen, Tsinghua University, 2279 Li Shui Road, Shenzhen, Guangdong Province, P. R. China
First published on 4th August 2014
Abstract
Fluorescence quenching is an interesting phenomenon that has been widely utilized in developing fluorescence-based sensors. However, most of the research focuses on the quencher and fluorophore in the bonded states. The fluorescence quenching between two unbonded nanostructures has been rarely studied. In this work, we observed and studied the fluorescence-quenching phenomenon between the unbonded gold nanoparticles (Au NPs) and graphene quantum dots (GQDs) upon simple mixing. We observed that the fluorescence of GQDs gradually decreased with the increase of Au NP concentration. This fluorescence quenching between unbonded GQDs and Au NPs obeys the nonlinear form of the Stern–Volmer model, which suggests that the process contains both static and dynamic quenching.
Introduction
Metal nanoparticles (NPs), such as gold (Au) and silver (Ag) NPs, are known to dramatically change the optical properties of nearby fluorophores. This is due to the interaction between surface plasmons of metal NPs and the photoluminescence (PL) of the light-emitting fluorophores.1–6 When a fluorophore is situated close to the metal NP surface, its fluorescence is quenched due to energy transfer to the metal.7,8 In the past decades, the metal induced PL quenching has been widely utilized for sensing technologies,9–13 and amplification of surface plasmons.14,15The metal NPs can quench fluorescence of fluorophores in both bonded states and unbonded states as far as they get close enough. The fluorescence quenching between quencher and fluorophore in the bonded states has been well documented. For example, the gold/silica (Au/SiO2) core–shell structures were used to absorb cadmium selenide quantum dots (CdSe QDs) or graphene quantum dots (GQDs) on the shell. PL of the fluorophores (i.e. CdSe QDs or GQDs) was quenched by the Au NPs in 6 nm thick silica shell.2,6 Au NPs were found to quench the fluorescence of lissamine molecules which were chemically bonded to Au NPs surface at a constant 1 nm distance.16 Fluorescence of QDs can also be quenched by a carbocyanine dye (Cy5, an energy acceptor) that binds to the QDs through bio-conjugation.17 In those studies, the distance between quencher and fluorophore was precisely controlled through inorganic–organic bonding materials.
However, fluorescence quenching can also happen between un-bonded quenchers and fluorophores. For instance, when CdSe QDs and Au nanorod were mixed together in aqueous phase, Au nanorods significantly quenched the fluorescence of CdSe QDs.18 This fluorescence quenching between unbonded quenchers and fluorophores is important as they represent some conditions in bio-applications. Despite this importance, there have been few studies for this phenomenon.
Graphene quantum dots (GQDs) are a new class of fluorophores, which hold great promise for bio-analysis and bio-imaging because of their chemical inertness, biocompatibility and low toxicity.19–21 Recently, when we mixed its solution with Au NPs, we observed the fluorescence quenching of GQDs by Au NPs up to 94.1%. The fluorescence of GQDs gradually decreased with the increase of Au NP concentration. Through examining the relation between the fluorescence quenching and concentration of Au NPs, we realize that this phenomenon obeys the nonlinear form of Stern–Volmer model, suggesting that the process contains both static and dynamic quenching.18 Through dynamic light scattering (DLS) and transmission electron microscopy (TEM) analysis, we revealed that Au NPs and GQDs were unbonded initially; upon mixing, part of the GQDs absorbed onto Au NP surface and the rest GQDs remained in water. The Au NPs can quench the fluorescence from both GQDs attached on surface and nearby GQDs in water solution; this may be used to explain the coexistence of static and dynamic quenching. We believe our study about the fluorescence quenching of Au NPs and GQDs in unbonded state will help with biosensor design based on these nanostructures.
Results and discussion
Synthesis of GQDs and Au NPs
GQDs were prepared from Vulcan XC-72 carbon black by refluxing with concentrated nitric acid following a published method.22,23 The GQDs gained are single layered with a diameter about 15 nm.22 They contain plenty of carboxyl and hydroxyl groups that provide excellent water solubility. The cyclic voltammetry of the as-prepared GQDs showed no prominent reduction peak (Fig. S1†), indicating that the as-prepared GQDs were free from any reducing agent and free of any residual nitrate. We preserved the GQDs in water at a concentration of 0.1 mg GQD per mL H2O for later use. The Au NPs were synthesized by the reduction of HAuCl4 by NaBH4 with presence of tri-sodium citrate.24 The Au NPs were water-soluble due to the surface capping of citrate ions. Au NPs were preserved in the aqueous solution of 0.05 mg Au NP per mL H2O.Fluorescence quenching of GQDs by Au NPs
Optical properties of the GQDs, Au NPs and mixtures were investigated by fluorescence emission spectrum and UV-vis absorption spectrum.To study the fluorescence quenching effect of Au NPs, we compared a group of aqueous mixtures, containing 1 mL of GQDs and varied volumes of Au NPs (0, 0.2, 0.4, 0.6, 1, 2, 2.5, 3, or 4 mL) to make a total volume of 5 mL. As listed in Table 1 in experimental part, the GQDs concentration is constantly 20 μg mL−1 for all group I samples. The Au NPs concentrations are 0, 2, 4, 6, 10, 20, 25, 30, and 40 μg mL−1, correspondingly. With excitation energy at 294 nm, the emission spectrum of sample 1 (GQDs 20 μg mL−1, no Au NPs) was recorded and it presents the peak emission intensity (I0 = 266 a.u.) at 497 nm (Fig. 1A). Upon the addition of more Au NPs, the intensity gradually drops. The sample 9 (GQDs 20 μg mL−1, Au NPs 40 μg mL−1) only has a peak emission intensity (I) of 20 a.u. at 497 nm. The sample 28 with only Au NPs (10 μg mL−1) and without GQDs showed negligible emission in detection range. We also conducted two groups of fluorescence quench experiment with 10 μg mL−1 and 3 μg mL−1 GQDs, same trends were observed (Fig. S2†).
| Sample no. | H2O (mL) | GQDs solution (mL) | Au NPs solution (mL) | GQD concentration (μg mL−1) | Au NPs concentration (μg mL−1) | |
|---|---|---|---|---|---|---|
| Group I | 1 | 4 | 1 | 0 | 20 | 0 |
| 2 | 3.8 | 0.2 | 2 | |||
| 3 | 3.6 | 0.4 | 4 | |||
| 4 | 3.4 | 0.6 | 6 | |||
| 5 | 3 | 1 | 10 | |||
| 6 | 2 | 2 | 20 | |||
| 7 | 1.5 | 2.5 | 25 | |||
| 8 | 1 | 3 | 30 | |||
| 9 | 0 | 4 | 40 | |||
| Group II | 10 | 4.5 | 0.5 | 0 | 10 | 0 |
| 11 | 4.3 | 0.2 | 2 | |||
| 12 | 3.9 | 0.6 | 6 | |||
| 13 | 3.7 | 0.8 | 8 | |||
| 14 | 3.5 | 1 | 10 | |||
| 15 | 3 | 1.5 | 15 | |||
| 16 | 2.5 | 2 | 20 | |||
| 17 | 2 | 2.5 | 25 | |||
| 18 | 1.5 | 3 | 30 | |||
| 19 | 0.5 | 4 | 40 | |||
| Group III | 20 | 4.85 | 0.15 | 0 | 3 | 0 |
| 21 | 4.65 | 0.2 | 2 | |||
| 22 | 4.45 | 0.4 | 4 | |||
| 23 | 4.25 | 0.6 | 6 | |||
| 24 | 4.05 | 0.8 | 8 | |||
| 25 | 3.85 | 1 | 10 | |||
| 26 | 2.85 | 2 | 20 | |||
| 27 | 1.85 | 3 | 30 | |||
| Group IV | 28 | 4 | 0 | 1 | 0 | 10 |
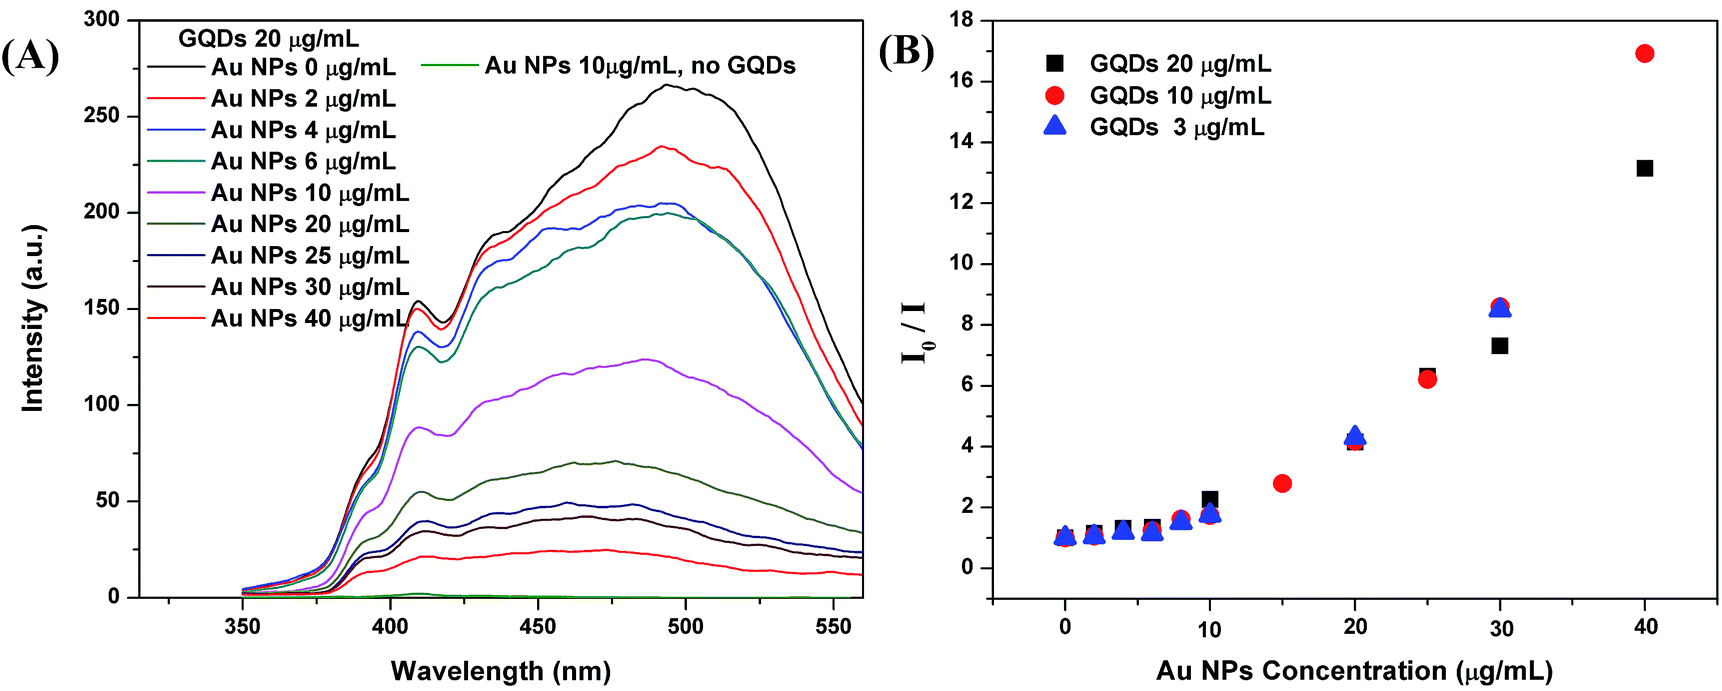 | ||
| Fig. 1 (A) Fluorescence spectra of group I mixtures with 20 μg mL−1 GQDs and varied concentration of Au NPs; and fluorescence spectrum of 10 μg mL−1 Au NPs without GQDs shows a plot (bottom) with very low intensity; (B) the Stern–Volmer plots: I0/I vs. Au NPs concentration, I0 and I are peak fluorescence intensities at 497 nm read from Fig. 1A and S2;† I0 is the initial peak intensities of the GQDs without Au NPs. | ||
For fluorescence quenching process, both linear and nonlinear forms of Stern–Volmer model were used:18
| I0/I = 1 + KD[Q] |
| I0/I = 1 + (KD + KS)[Q] + KDKS[Q]2 |
UV-vis spectra and size analysis of Au NPs with GQDs
The 1 mL GQDs in water suspension shows a broad UV-vis absorption below 600 nm, and the UV-vis absorption decreases with lower GQDs concentrations (Fig. S3A†). Au nanostructures are known to have a characteristic absorption peak in range of 500–900 nm depending on the size and shape of the NPs. In Fig. 2A, the pure Au NPs have an absorption peak at 512 nm. As GQDs were mixed with the Au NPs, the Au UV-vis absorption peak red shifted to high wavelengths as 516 nm, 520 nm and 531 nm, respectively to the GQDs concentrations of 3, 10 and 20 μg mL−1. The red shift of the Au NPs UV-vis absorption may be due to the size increase, so we carried the DLS size measurement. The number particle size distribution of the Au NPs increased along with the GQDs concentration (Fig. 2B), the peak size changed from 1.5 nm to 2.5, 3 and 10 nm accordingly. For example, the sample with 20 μg mL−1 GQDs and 10 μg mL−1 Au NPs showed a size range of 5.5 to 30 nm and a peak size at about 10 nm in DLS plot. A representative TEM image of the same sample is shown in Fig. S4A,† only Au NPs were observed at this magnification. A measurement of all Au NPs on the TEM image indicated a size range of 4 to 32 nm, with a mean diameter of 10 nm, and a mode diameter of 8.6 nm (Fig. S4B†). The UV-vis spectrum, DLS measurement and TEM image agree with each other, they all suggest a size increase of the Au NPs along with the concentration increase of GQDs. In the fluorescence study, we found that both static and kinetic quenchings exist in our system, this means the Au NPs quench the GQDs in two possible ways: (1) by forming a complex with the GQDs or (2) by quenching at a distance without direct contact. So, we propose that partial of the GQDs are attached on the Au NPs and partial stay in water. The Au NPs are stabilized by citrate ions, and GQDs are also negatively charged with carboxyl and hydroxyl groups. As GQDs concentration increases, they replace more and more citrate ions on Au NPs. Due to the bulky structure and low charge; the GQDs are weaker surface stabilizer than the citrate ions. Thus the original 1.5 nm Au NPs grow into larger NPs with more GQDs. When we kept the GQDs concentration constantly at 20 μg mL−1, and increased the Au NPs concentration (6, 10 and 20 μg mL−1), the Au absorption peak also red shifted (Fig. S3B†). This is because at a higher concentration, the Au NPs have more chance to aggregate with each other. | ||
| Fig. 2 (A) UV-vis absorption spectra and (B) DLS data, of mixtures with 10 μg mL−1 Au NPs and varied concentrations of GQDs (20, 10, 3 and 0 μg mL−1). | ||
Conclusions
We studied the fluorescence quenching behavior of unbonded Au NPs and GQDs in aqueous phase. Upon mixing, the fluorescence of GQDs was gradually quenched with increasing Au NP concentrations following the nonlinear form of Stern–Volmer model, suggesting that the process contains both static and dynamic quenching. The GQDs also caused aggregation of Au NPs observed by UV-vis spectra; DLS size measurement and TEM image. Our finding may help in developing biosensors based on GQDs and Au NPs.Experimental
Vulcan XC-72 carbon black was a product of Cabot Corporation. Nitric acid (HNO3) was produced by Honeywell Chemicals. Hydrogen tetrachloroaurate(III) (HAuCl4·3H2O), tri-sodium citrate (Na3C6H5O7) and sodium borohydride (NaBH4) were purchased from Sigma-Aldrich. All chemicals were used as received without further purification.Fluorescence spectrometer (Perkin Elmer, LS-55), UV-vis spectrometer (Shimadzu Scientific Instruments, UV-2450), dynamic light scattering (DLS) (Malvern Instruments, Zetasizer Nano ZS), transmission electron microscopy (TEM, FEI G2 spirit, 120 kV, America).
Preparation of the graphene quantum dots (GQDs)
GQDs were prepared from Vulcan XC-72 carbon black (Cabot Corporation) by refluxing with 6 M nitric acid.22,23 Specifically, 0.2 g dried XC-72 carbon black was put into 50 mL 6 mol L−1 (∼25%) HNO3 (boiling point: 100 °C) followed by refluxing in an oil bath maintained at 130 °C for 24 hours. After cooling to room temperature, the suspension was centrifuged (2770 g) for 10 min to obtain a supernatant and sediment. The supernatant was heated in an oil bath maintained at 200 °C to evaporate the water and nitric acid. And the GQDs were obtained as a reddish-brown solid. The GQDs were further filtered through a centrifugal filter device (3 kDa MWCO, Millipore). The fraction of GQDs smaller than 3 kDa was preserved in water solution that was dried and redispersed to form a water solution of 0.1 mg GQD per mL.Cyclic voltammetry of the graphene quantum dots (GQDs)
The cyclic voltammetry of GQDs was measured in 0.1 M phosphate buffer with pH 5. Briefly, 10 μL of GQDs (0.25 mg mL−1) was drop-casted on a pre-cleaned glassy carbon electrode and dried in air at 37 °C. Nafion was drop-casted on the GQD modified electrode to prevent the leakage of GQDs. The cyclic voltammetry was recorded from −0.8 to 0 V using a standard three-electrode setup with saturated calomel electrode as reference and platinum wire as counter electrode with a CHI 660D electrochemical workstation (Chenhua Inc).Preparation of gold nanoparticles (Au NPs)
Water-soluble Au NPs coated with citrate were synthesized following a published method with modifications.23,24 In detail, 10 mM HAuCl4, 1% wt Na3Citrate and 0.01 M NaBH4 water solutions were prepared in advance. 0.5 mL of 10 mM HAuCl4 and 0.15 mL of 1% wt Na3Citrate water solutions were added into 19.35 g H2O to yield a 20 mL solution of 0.25 mM HAuCl4 and 0.25 mM Na3Citrate. 0.6 mL of 0.01 M NaBH4 solution was added drop-by-drop into the 20 mL solution containing HAuCl4 and Na3Citrate under constant magnetic stirring. The reaction mixture quickly turned purple due to formation of Au NPs. The reaction mixture was stirred at room temperature for another 30 min for decomposition of excess NaBH4. The Au NPs were preserved and used in the synthesis solution without further purification. The as prepared Au NPs solution has a concentration of 0.05 mg Au NP per mL.Mixing of the GQDs and Au NPs
As-prepared GQDs solution (0.1 mg GQD per mL aqueous solution) was diluted with water and then mixed with Au NPs solution (0.05 mg Au NP per mL aqueous solution) to yield mixtures with varied concentrations of GQDs and Au NPs. The amount of water, GQDs and Au NPs solutions for each sample were listed in row 3–5 of Table 1. The calculated concentrations of GQDs and Au NPs in the mixtures were listed in row 6 and 7.Acknowledgements
This work was supported by the Start-Up Grants by Nanyang Technological University and the Tier-1 Academic Research Funds by Singapore Ministry of Education (RG 64/12 to CX) and Shenzhen Government Project no. JCYJ20130402145002411 (to CY).References
- S. T. Kochuveedu and D. H. Kim, Nanoscale, 2014, 6, 4966–4984 RSC.
- N. Liu, B. S. Prall and V. I. Klimov, J. Am. Chem. Soc., 2006, 128, 15362–15363 CrossRef CAS PubMed.
- K. Ray, R. Badugu and J. R. Lakowicz, J. Am. Chem. Soc., 2006, 128, 8998–8999 CrossRef CAS PubMed.
- C. Li, Y. Zhu, X. Zhang, X. Yang and C. Li, RSC Adv., 2012, 2, 1765–1768 RSC.
- J. Yang, F. Zhang, Y. Chen, S. Qian, P. Hu, W. Li, Y. Deng, Y. Fang, L. Han, M. Luqman and D. Zhao, Chem. Commun., 2011, 47, 11618–11620 RSC.
- L. Deng, L. Liu, C. Zhu, D. Li and S. Dong, Chem. Commun., 2013, 49, 2503–2505 RSC.
- V. N. Pustovit and T. V. Shahbazyan, J. Chem. Phys., 2012, 136, 204701 CrossRef CAS PubMed.
- P. Anger, P. Bharadwaj and L. Novotny, Phys. Rev. Lett., 2006, 96, 113002 CrossRef.
- J. L. West and N. J. Halas, Annu. Rev. Biomed. Eng., 2003, 5, 285–296 CrossRef CAS PubMed.
- B. Dubertret, M. Calame and A. J. Libchaber, Nat. Biotechnol., 2001, 19, 365–370 CrossRef CAS PubMed.
- D. J. Maxwell, J. R. Taylor and S. Nie, J. Am. Chem. Soc., 2002, 124, 9606–9612 CrossRef CAS PubMed.
- Y. Guo, Z. Wang, H. Shao and X. Jiang, Carbon, 2013, 52, 583–589 CrossRef CAS PubMed.
- Y. P. Kim, W. L. Daniel, Z. Xia, H. Xie, C. A. Mirkin and J. Rao, Chem. Commun., 2010, 46, 76–78 RSC.
- D. J. Bergman and M. I. Stockman, Phys. Rev. Lett., 2003, 90, 027402 CrossRef.
- K. E. Dorfman, P. K. Jha, D. V. Voronine, P. Genevet, F. Capasso and M. O. Scully, Phys. Rev. Lett., 2013, 111, 043601 CrossRef.
- E. Dulkeith, A. C. Morteani, T. Niedereichholz, T. A. Klar, J. Feldmann, S. A. Levi, F. C. J. M. van Veggel, D. N. Reinhoudt, M. Möller and D. I. Gittins, Phys. Rev. Lett., 2002, 89, 203002 CrossRef CAS.
- C. Xu, B. Xing and J. Rao, Biochem. Biophys. Res. Commun., 2006, 344, 931–935 CrossRef CAS PubMed.
- B. Nikoobakht, C. Burda, M. Braun, M. Hun and M. A. El-Sayed, Photochem. Photobiol., 2002, 75, 591–597 CrossRef CAS.
- J. Shen, Y. Zhu, X. Yang and C. Li, Chem. Commun., 2012, 48, 3686–3699 RSC.
- X. Sun, Z. Liu, K. Welsher, J. T. Robinson, A. Goodwin, S. Zaric and H. Dai, Nano Res., 2008, 1, 203–212 CrossRef CAS PubMed.
- S. Zhu, J. Zhang, C. Qiao, S. Tang, Y. Li, W. Yuan, B. Li, L. Tian, F. Liu, R. Hu, H. Gao, H. Wei, H. Zhang, H. Sun and B. Yang, Chem. Commun., 2011, 47, 6858–6860 RSC.
- Y. Dong, C. Chen, X. Zheng, L. Gao, Z. Cui, H. Yang, C. Guo, Y. Chi and C. M. Li, J. Mater. Chem., 2012, 22, 8764–8766 RSC.
- X. T. Zheng, A. Than, A. Ananthanaraya, D. H. Kim and P. Chen, ACS Nano, 2013, 7, 6278–6286 CrossRef CAS PubMed.
- N. R. Jana, L. Gearheart and C. J. Murphy, Adv. Mater., 2001, 13, 1389–1393 CrossRef CAS.
Footnote |
| † Electronic supplementary information (ESI) available. See DOI: 10.1039/c4ra06408a |
| This journal is © The Royal Society of Chemistry 2014 |