Susanta Beraa,
Monisankar Ghosh‡
b,
Moumita Pal‡a,
Nilanjana Dasa,
Suchandrima Sahab,
Samir Kumar Duttab and
Sunirmal Jana*a
aSol–Gel Division, CSIR-Central Glass and Ceramic Research Institute, P.O. Jadavpur University, 196 Raja S.C. Mullick Road, Kolkata 700032, West Bengal, India. E-mail: sjana@cgcri.res.in; janasunirmal@hotmail.com; Fax: +91 33 2473 0957; Tel: +91 33 2322 3303
bDrug Development Diagnostic & Biotechnology, CSIR-Indian Institute of Chemical Biology, P.O. Jadavpur University, 4 Raja SC Mullick Road, West Bengal, Kolkata 700032, India
First published on 4th August 2014
Europium incorporated ZnO-chemically converted graphene (CCG) nanocomposites (ZEG) were synthesized by adopting a solvothermal process at 95 °C from the precursors of varying europium nitrate to zinc acetate molar ratios (R = 0.00, 0.05, 0.10, 0.15) in a fixed content of graphene oxide. Eu level (R value) in the precursors was found to play a role on tailoring the crystallite/particle size of hexagonal ZnO, as evidenced from X-ray diffraction/transmission electron microscopy analysis. The presence of chemical interaction/complexation between the oxygen functionalities of CCG and inorganic moieties (ZnO/Zn2+ and Eu ions) of nanocomposites were studied by FTIR, Raman, UV-Vis spectral and XPS measurements. The nanocomposites possessed meso pores as confirmed from BET nitrogen adsorption isotherm, and the sample ZEG(10) (R = 0.10) was found to possess the highest specific surface area. In spite of an UV emission at ∼385 nm, an orange emission (appeared at 595 nm) along with other visible emissions was observed from the photoluminescence spectra of nanocomposites. However, the intensity of the orange emission (λex = 400 nm) was found to be maximum in the ZEG(10) sample, which produced relatively bright orange fluorescent images of human breast cancer cells (MCF7) under confocal laser scanning microscope. This indicated the internalization of the nanomaterials within the cells. As obtained from the MTT assay, the samples (R ≥ 0.10) exhibited comparatively low in vitro cytotoxicity (higher cell viability) on the cancer cells. The low cytotoxicity could be explained on the basis of the ID/IG (intensities of D and G bands of graphene) value of CCG, as realized from the Raman spectral measurement. The nanocomposite ZEG(10), having relatively large surface area, bright cell imaging capability and better cell viability, could be employed for cancer cell targeted optical imaging and drug delivery.
ZnO is a well-known functional semiconductor oxide23–26 having wide direct band gap (3.37 eV, at room temperature) and a large exciton binding energy (60 meV). Because of its characteristic UV emission, ZnO could be an important material for optoelectronic application.25 Moreover, several visible emissions26 could be observed under a single light excitation due to the formation of surface defects in ZnO. All these emissions could also be tuned through the doping/controlling of the parameters during material synthesis.23–29 Alternatively, the optical property of the semiconductor could also be modified12 through the formation of nanocomposite with graphene. In a basic aspect of the nanocomposite, Son et al.12 reported that Zn2+ ions chemisorbed on the embryo of ZnO nanoparticles, which could react with the oxygen functional groups of GO, led to the formation of Zn–O–C bonding. In addition, the GO sheets could be exfoliated chemically in the reaction medium. On the other hand, graphene is more biocompatible30 because the living cell can well adhere and proliferate on graphene sheets.31 The nanoparticles are generally toxic in nature but their toxicity could be mitigated to make the material biocompatible and nontoxic20 through proper surface modification with graphene. It could also be noted12,32 that the exfoliated graphene with several oxygen containing functional groups (carboxylic, hydroxyl and epoxide) could interact with suitable cations (adsorbed on the semiconductor oxide surface),12 resulting in the formation of graphene based functional nanocomposites. However, functional groups could interact with cations and would help to generate reactive sites towards the nucleation and crystal growth of nanoparticles.32 However, in the nanocomposites, the GO could transform into chemically converted graphene (CCG) (also called reduced graphene oxide, rGO) with a lesser number33 of oxygen containing functional groups. Sometimes, the highly toxic nanoparticles (for example, CdSe/ZnS quantum dots) could tag20 with rGO, which made them potential biomaterials for applications such as in situ monitored bright fluorescence imaging and photothermal therapy of living cells. On the other hand, the presence of numerous oxygen functional groups in GO would create a more toxic effect on living cells compared to CCG/rGO.34 This would be caused by chemical interactions34 between the functional groups of GO and living cells. In fact, the living cells when combined with GO enhances the mitochondrial respiration rate by donating its available electrons and creating reactive oxygen species (ROS).34 Although, ZnO is known to be a biocompatible24 material, due to particle dissolution35 in tissue culture medium, it could show toxic effects on living cells. During particle dissolution, Zn2+ ion shedding could damage lysosomes, perturb mitochondria, generate ROS, etc. In this context, by Fe doping, the dissolution can be reduced by the changes in particle matrix because the dopant could easily enter into the ZnO lattice.35
In europium graphene composite, europium shows higher adsorption energy with a lower diffusion barrier compared to other rare earth elements.11 Moreover, europium ions could form complexes with the oxygen functional groups of graphene that could be revealed by FTIR, Raman spectra and XPS measurements. In addition, the graphitic carbons could quench11,36 the fluorescence of organic dyes. Wang et al.36 synthesized three-dimensional europium-complexed rGO macroassembly by a one-pot self-assembly process. The authors reported the formation of inner-sphere surface complexes of europium ions and confirmed the formation of Eu(II) ions by XPS analysis. They also claimed that the reduction of Eu(III) to Eu(II) ions occurred due to complexation.36,37 Although, several authors38–40 have already reported Eu incorporated ZnO nanoparticles, very few claimed38 that Eu enters into the crystal lattice. The problem of incorporation could be addressed because of the large size of europium ions compared to Zn2+.40 However, it has already been reported that depending upon the incorporation41 of rare earth elements, an increase in surface defects were observed in ZnO as assessed from the photoluminescence emission spectral study.26,41
In general, the graphene based nanocomposites could mostly be synthesised by solvothermal,21,25 chemical deposition42 and microwave-assisted43 processes. However, the low temperature solvothermal process could be advantageous over others. Recently, several exciting properties were observed in graphene based ternary nanocomposites (e.g. Fe3O4–graphene–TiO2, rGO–porphyrin–ZnO, graphene–Fe2O3–polyaniline and Pt–ITO–graphene).44–47 The composite materials could be used in photoconversion, photovoltaics, supercapacitors, etc. However, to the best of our knowledge, there are no reports on Eu incorporated ZnO–graphene (ZEG) nanocomposites that would generate a new class of ternary nanocomposite materials for emerging applications. Thus, for both basic and applied fields of research, the synthesis of graphene-based ZEG nanocomposites would be very promising.
In the present work, a systematic study was performed on the synthesis of europium incorporated ZnO-chemically converted graphene (CCG) nanocomposites (ZEG) from the precursors of varying europium nitrate to zinc acetate molar ratios (R = 0.00, 0.05, 0.10, 0.15) in a fixed content of graphene oxide by adopting a low temperature (95 °C) solvothermal process. In the nanocomposites, the influence of Eu incorporation (in terms of R value) on the crystallite/particle size of hexagonal ZnO, the presence of chemical interaction/complexation and optical properties were analyzed. Moreover, the cell imaging capability of the samples was investigating using a confocal laser scanning microscope. Finally, in vitro cell viability in terms of cytotoxicity of the nanocomposites on MCF7 breast cancer cells from MTT assay was also verified.
![]() | ||
Fig. 1 XRD reflections of ZEG nanocomposites and as-synthesized graphene oxide. Inset shows the change in crystallite size on increasing Eu incorporation level in the precursors. |
TEM results of nanocomposites are given in Fig. 2 and S2, ESI.† From the TEM images (Fig. 2a, c and e and S2†), the agglomeration of composite nanoparticles appeared to be diminishing at the higher level of Eu incorporation, and nearly monodispersed quasi spherical particles (Fig. 2e) resulted in ZEG(15). However, on increasing the Eu level, the trend in the change of the average size of particles obtained from the histograms (insets, Fig. 2c and e, S2a and b†), constructed from their respective TEM images, were found to be identical to the calculated crystallite size (inset, Fig. 1) of h-ZnO, as obtained by the XRD patterns. Moreover, the particle size obtained from TEM analysis was always higher than the calculated value according to the XRD patterns. This difference could suggest the formation of ZEG nanocomposite particles because the calculated crystallite size from XRD considered only h-ZnO but the observed nanoparticles in TEM images could be for nanomaterials consisting of inorganic (ZnO/Zn2+ and Eu ion) and organic (CCG) moieties (discussed later). In HRTEM images (Fig. 2b, d and f) of the nanocomposites, the lattice fringe with a regular spacing of 0.26 nm is fully consistent12 with the interplanar distance of the (002) plane of h-ZnO. Although the XRD patterns of the nanocomposites did not show any evidence for the presence of CCG, their corresponding TEM images clearly show a sheet-like structure (Fig. 2), which could have originated from CCG layers. This sheet-like structure was the CCG layers present in the nanocomposites as also evidenced from its fast Fourier transform (FFT) patterns (inset (ii) of Fig. 2e). The FFT shows a set of spots corresponding to crystallographic planes (002) and (101) of h-ZnO along with (002) of CCG. In addition, as seen from the HRTEM image (Fig. 2b) of ZEG(00), the layers of chemically converted graphene (CCG) sheets of nearly ∼3 nm thickness on the nano ZnO crystals are clearly visible. Thus, the CCG layers could make the Eu incorporated ZnO@CCG core-shell-like structure in the nanocomposite. Irrespective of the incorporation level, it was not possible to quantify the Eu content from the TEM-EDS (insets, Fig. 2d and f) analysis of ZEG nanocomposites. This was because the characteristic peaks in EDS of Eu could be disguised39 within the broad peaks of Zn and Cu.
The presence of chemical interaction/complexation between the oxygen functionalities of CCG with inorganic moieties (ZnO/Zn2+ and Eu ions) was verified by FTIR vibrational spectra. Fig. 3 and S3† represent the FTIR spectra of ZEG nanocomposites and the as-synthesized GO. In GO, the presence33 of hydroxylates, carboxylates and epoxides in the form of oxygen functional groups, C–OH, C–O–C, O–H (deformation) and –COOH, were distinctly observed from the appearance of vibrations located at ∼1070 cm−1, ∼1225 cm−1, ∼1400 cm−1 and ∼1735 cm−1, respectively.11,21,51 In addition, a skeletal vibration of unoxidized graphitic domains in GO was also found at ∼1620 cm−1.51 However, the intensity of all the vibrational peaks were found to decrease to a large extent in the GO derived nanocomposites, (ZEG(00), ZEG(10) and Eu–CCG). In addition, a new vibration observed at ∼1570 cm−1 in ZEG(00), ZEG(10) and Eu–CCG samples were assigned to the characteristic skeletal vibrations of the graphitic domains of CCG.21 This result could favour the conversion of GO to chemically converted graphene (CCG) in the nanocomposites33 and corroborated the TEM result (Fig. 2). However, the complete conversion of GO to CCG was found after at least 9 h of reaction time, which could easily be understood from the FTIR spectral study (Fig. S3, ESI†) of the representative (ZEG(00)) nanocomposites synthesized by altering reaction times. In addition, a strong vibration appearing at 1375 cm−1 in Eu-CCG could be attributed to the symmetric stretching vibration because of the complexation of the –COOH group with europium ions36,52 (Eu3+/Eu2+) (discussed later under XPS result, Fig. 5). Moreover, its asymmetric stretching component52 might be overlapped within the broad vibration (∼1570 cm−1) of graphitic domains of CCG. Perhaps, the asymmetric and symmetric stretching vibrations53 of complexed –COOH groups of CCG with Zn2+ from ZnO/Zn2+ (discussed later) would be disguised within the broad spectral regions. However, the FTIR spectra of both ZEG(00) and ZEG(10) nanocomposites showed a strong vibration at ∼460 cm−1, which was not observed in europium–CCG nanocomposite (Eu–CCG), assigned21,54 to Zn–O bond vibration. Moreover, a sharp vibration appeared at 418 cm−1 in Eu–CCG that might be overlapped within the broad vibration region of Zn–O in ZEG(10), which is attributed to Eu–O bond vibration.36
Raman spectra of ZEG nanocomposites are displayed in Fig. 4. The Raman peaks located at 325 cm−1, 434 cm−1, 571 cm−1 and ∼1135 cm−1 were attributed to21–25 the modes of 2E2 (M), E2 (high), E1 (LO) and 2E1 (LO) of hexagonal wurtzite ZnO, respectively. In fact, the E2 (high) mode could be recognized as the signature of h-ZnO that was already confirmed by XRD (Fig. 1) and TEM (Fig. 2) studies. In addition, the defect band, D (intensity ID) at ∼1350 cm−1 as a breathing mode of k-point phonons in A1g symmetry, appeared in all the nanocomposites including precursor GO.12,25 This could strongly suggest the existence of defects in the graphene moiety.25,49 In GO, the Raman peak observed at 1597 cm−1 was assigned to the E2g phonon of sp2 carbon atoms12,25 and was designated as graphene (G) band (intensity IG). However, the G band was found to shift in the ZEG nanocomposites by 14 ± 2 cm−1 towards the lower energy region11,25 with respect to the band in GO, while the location of the D band remained approximately at the same position. Moreover, a systematic broadening11 of the D band was observed with increasing Eu level. The peak broadening could be assessed from the calculation of half width at full maxima (FWHM) (Table S1, ESI†) of the peak at 1350 cm−1. The result could support the conversion of GO to CCG, which is chemically interacted/formed complexes with inorganic moieties (ZnO/Zn2+ and Eu3+/Eu2+) in the nanocomposites. It could be noted that the chemical interaction/formation of complexes were also noticed from the FTIR vibrational spectra (Fig. 3 and S3, ESI†) of the ZEG nanocomposites. On the other hand, on increasing Eu level, a systematic enhancement of the intensity ratio, ID/IG, was found (Fig. 4 and Table S1 of ESI†) up to R = 0.10 (ZEG(10)), which remained the same in the next higher incorporation level for ZEG(15). The D band could be associated11 with the complexed oxygen functionalities of CCG. Moreover, the relative increase in the D band intensity could also account for the exfoliation46 of graphene layers that could be possible via chemical interaction/complexation with the inorganic moieties of nanocomposites. Therefore, on increasing Eu level in a fixed amount of CCG, the complexed oxygen functionalities in ZEG nanocomposites could be expected to reach a value with an optimum concentration of europium (Eu3+/Eu2+) ions. No evidence of Eu oxide formation that could support the incorporation of Eu into ZnO crystal lattice was found in the XRD patterns (Fig. 1), and thus, the europium ions should remain in the complexed species with CCG of the nanocomposites. Hence, after the Eu incorporation (R ≥ 0.10), there might not be available free oxygen functionalities. This would give rise the nearly constant ID/IG value of the nanocomposites. Although we explained the possible interaction/complex formation between the inorganic moieties and the oxygen functionalities in the nanocomposites, the existence of Zn2+and Eu2+/Eu3+ could not be determined by the Raman spectral study.
XPS analysis could also be a useful tool11,21,38 to confirm the interaction of oxygen functionalities of CCG with the inorganic moieties. Thus, the XPS measurement (Fig. 5) of a representative sample, ZEG(10), was performed to confirm the chemical state(s) of the elements as well as the chemical interactions existing between the organics, CCG, and the inorganic moieties (ZnO/Zn2+ and Eu3+/Eu2+ ions) of the nanocomposite. The XPS survey spectrum (Fig. S4, ESI†) shows the binding energy signals for C 1s, O 1s, Zn 2p and Eu 3d core levels. A broad signal for C 1s could be resolved (Fig. 5a) into three Gaussian peaks centered at 284.4 eV (a1), 285.4 eV (a2) and 288.8 eV (a3), which correspond to Sp2C, Sp3C and O–C–O, respectively,22,36 from the organic moiety, CCG, in the sample. The O 1s peak (Fig. 5b) could also be decomposed into three distinct components with binding energies ∼530.1 eV (S1), 531.8 eV (S2) and 533.1 eV (S3). The S1 signal could be due to the lattice oxygen (O2−)26 of hexagonal ZnO, whereas the higher binding energy signals of O 1s (S2 and S3) could associate with the presence of chemically interacted/complexed oxygen functional groups (epoxy/COOH/hydroxyl)36 of CCG. On the other hand, the strong binding energy signals located (Fig. 5c) at 1044.3 eV and 1021.6 eV were assigned to Zn 2p1/2 and Zn 2p3/2 core levels,21 respectively. In this work, we observed a shifting (∼2 eV) of the Zn 2p signals towards higher energy compared to pure ZnO, as already reported by Zhang et al.21 This result could imply the presence of interaction and electron transformation between ZnO/Zn2+ moiety and the oxygen functionalities of CCG.21 However, an energy difference of 22.7 eV between the binding energy levels supported the existence of Zn2+ in the nanocomposite.26 Although, the XRD (Fig. 1) study could not show the evidence for the presence of Eu; however, the XPS (Fig. 5d) confirmed the core level binding energies of Eu 3d. The intense doublets appearing at 1164.6 eV and 1134.7 eV could be assigned to the energy levels of Eu 3d3/2 and Eu 3d5/2, respectively, in Eu3+ species.36,38 In addition, the existence of Eu2+ species was also evidenced from relatively weak binding energy signals located at 1155.4 eV and 1124.4 eV of Eu2+ 3d3/2 and Eu2+ 3d5/2 components, respectively.36 In this synthesis, the presence of Eu2+ could be originated from the reduction of Eu3+ in the CCG environment.36 Mercier et al.55 reported a MmXxOy type oxo-compound showing a higher core level binding energy compared to MaOb. Here, M (M = Eu) is a more electropositive element than X (X = C), and consequently, the M–O bond has more ionic character than the X–O bond. In the X-O-M bond, electrons could pull away from M and Eu2+ is formed as a result of diminishing the valency of Eu3+. Therefore, both Eu2+ and Eu3+ ions could associate with the free oxygen functional groups of CCG and would form an MmXxOy type complex in the nanocomposites. Thus, it could be expected that at higher Eu incorporation level, it would reduce free oxygen functional groups of CCG. This would help to minimize the toxicity (discussed later, Fig. 9b) of nanocomposites on living cells because oxygen functionalities could easily interact with the cells.34
In Fig. 6, UV-vis absorption spectral (measured by diffused reflectance method) results of GO and ZEG nanocomposites are given. The appearance of two prominent absorption peaks at 232 nm and ∼290 nm (broad shoulder, inset (i), Fig. 6) in GO could correspond to the π → π* and n → π* transitions of CC and C
O bands,56 respectively. However, in all the nanocomposites, the peak at 232 nm red-shifted to ∼270 nm, while the peak at ∼290 nm disappeared completely in the Eu incorporated nanocomposites. This result could signify56 that strong coupling exists between the inorganic moieties (ZnO/Zn2+ and Eu3+/Eu2+ ions) and CCG during the conversion of GO to CCG in the nanocomposites. The present findings also supported the FTIR (Fig. 3), Raman (Fig. 4) and XPS (Fig. 5) results. It should be pointed out that in ZEG(00), a broad UV peak was also found at ∼360 nm, which shifted towards blue/red wavelength depending upon ZnO crystallite/particle size (as obtained from XRD (Fig. 1)/TEM (Fig. 2 and S2†), and demonstrated the size effect of semiconductor oxide in the nano regime.26,57 In addition, the spectral region of 240 to 390 nm could be resolved into three Gaussian fitted components, located at 272 nm, 332 nm and 360 nm in the ZEG(10) nanocomposite. The peak at 332 nm could relate to electronic transition in the bulk ZnO (band gap, ∼3.4 eV).
Room temperature photoluminescence (PL) spectra (at different excitation wavelengths) of the ZEG nanocomposites and other materials are displayed in Fig. 7, S5 and S6.† The excitation wavelengths were primarily selected from the absorption spectral (measured by diffused reflectance method, Fig. 6) study of the nanocomposites. In this context, initially an excitation wavelength of 360 nm was chosen and a strong UV PL emission was observed at 384 nm along with several visible emissions (Fig. S5(a), ESI†) for ZEG(00) and ZEG(10) nanocomposites. The peak corresponds12 to the characteristic UV emission of ZnO due to band-to-band transition. However, fixing the PL emission at 384 nm, the PLE spectrum was also recorded. The spectrum shows three distinct peaks (inset, Fig. 7a) at 224 nm, 240 nm and 340 nm. Hence, an excitation wavelength of 340 nm was further used, and recorded PL spectra where several distinct visible emissions (Fig. 7a) were located at ∼385 nm, ∼420 nm, ∼460 nm, ∼485 nm, ∼520 nm, ∼530 nm, ∼570 nm and ∼595 nm. It is known that except UV emission at 385 nm, all the visible emissions could relate to the intrinsic/extrinsic surface defects of nano ZnO.26,57–59 However, several researchers are still doubtful regarding the origin of individual visible emissions. It could be noted that the formation and nature of the defects depend upon several parameters26,58,59 (such as preparative method, doping) through which the concentration26 of an individual defect could be tailored. In this work, the emission observed at 420 nm could support the presence of zinc interstitial,26while the peak at 460 nm could relate to single positively charged oxygen vacancy in nano ZnO.26 The existence of antisite oxygen was also supported from the observation of PL emission at 485 nm.26 Moreover, a series of green emissions were observed (520 nm, 530 nm and 570 nm) in the PL spectra of the nanocomposites. The green emissions58,59 would be originating from the different levels of oxygen vacancies existed in the nano semiconductor oxide. It was interesting to note that a new PLE peak was observed at 400 nm (inset (i) of Fig. 7b, S5(b) and (c) of ESI†) in addition to 340 nm when the PL emission was fixed at 595 nm. Hence, the excitation at 400 nm was further used to measure the PL spectra, which showed a distinct orange emission at 595 nm along with a broad emission in the spectral range of 520–585 nm (Fig. 7b). In fact, the broad emission consisted of four Gaussian fitted peaks located at 530 nm, 543 nm, 560 nm and 570 nm (inset (ii), Fig. 7b). These peaks were considered to be originated from different energy levels of neutral oxygen vacancies in ZnO.58,59 However, the intensity of the orange emission at 595 nm could be influenced on Eu incorporation level in the nanocomposites and the highest intensity of the peak was found in ZEG(10), which is approximately twice as large as the peak intensity of ZEG(00). The origin of the orange emission would be related to interstitial oxygen in the nano semiconductor oxide.60 Moreover, a systematic broadening of the peak was observed on increasing the Eu incorporation level. This peak broadening could be determined from the measurement of FWHM, where the ZEG(00) and ZEG(15) showed the lowest (11 nm) and the highest (12.5 nm) values of FWHM, respectively. It should mention that the Eu ions could give emissions, especially due to 5D0—7F0 and 5D0—7F1 transitions.39 Therefore, broadening could be explained on the basis of increasing Eu incorporation in the nanocomposites but the highest emission intensity in ZEG(10) could certainly be an enhancement of the surface defect (interstitial oxygen) concentration. As the XPS (Fig. 5) study already confirmed the formation of Eu2+ ions in the nanocomposite, the Eu2+ ions in an optimum concentration might be playing a significant role39 in the enhancement of the intensity of PL emission at 595 nm. On the other hand, the influence of CCG on the intensity of orange emission was also investigated in detail (Fig. S6, ESI†) and a positive function towards the enhancement of the defect concentration in hexagonal ZnO of the ZEG(10) nanocomposite was noticed. Thus, it could be concluded that CCG in combination with Eu could assist in enhancing the orange emission at 595 nm.
Specific surface area (SSA) of ZEG nanocomposites measured by multipoint BET nitrogen adsorption isotherm (Fig. S7 and Table S2, ESI†) changed with Eu incorporation level. The highest surface area was measured in the ZEG(10) nanocomposite. It could be noted from the appearance of the hysteresis loop found in the relative pressure (p/p0) range of 0.6–1.0 that the BET isotherms of the all the samples highlight (Fig. S7†) an IUPAC Type IV isotherm,61 indicating the presence of mesopores in the nanocomposites. We also confirmed the existence of mesopore from the calculated average pore diameter that was found in the range of 11.9 to 34.1 nm (Table S2, ESI†).
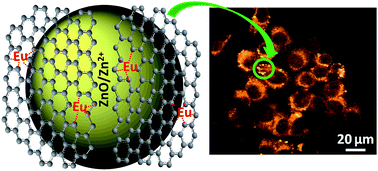
It could be believed that during the synthesis, major portions of zinc acetate (ZA) precursor would form12,22 ZnO nanoparticles (ZNPs) in the reaction medium, and remaining ZA would generate Zn2+ ions, which would chemisorb12 on the surface of the ZNPs, resulting in the formation of ZnO/Zn2+ moiety. Simultaneously, the GO converted into the chemically converted graphene (CCG) after an appreciable amount of reaction time (Fig. S1 and S3, ESI†) and could interact/form complexes with the inorganic moiety. On the other hand, in europium incorporated nanocomposites, no europium ions were found to enter into the ZnO crystal lattice (which might be due to self-purification process26 in nano semiconductors), as evidenced from the XRD result (Fig. 1). However, these ions could interact/form complexes with the free oxygen functional groups of CCG, as confirmed by FTIR (Fig. 3), Raman (Fig. 4), XPS (Fig. 5) and UV-Vis (Fig. 6) studies. However, TEM studies (Fig. 2) confirmed the presence of CCG layers on the surface of ZnO nano crystals. Thus, in the present work, on the basis of our experimental results, a tentative chemical structure of europium incorporated ZEG nanocomposite is given in Fig. 8.
Because of unique physical and optical properties of ZnO nanoparticles, these could have significant advantages in biomedical applications (e.g. cell imaging and drug delivery).19,20 In addition, the nanoparticles (NPs) could possess particle size dependent tunable band edge emission23 in the ultraviolet region. Moreover, these could be capable of generating visible emissions26 due to the presence of several intrinsic/extrinsic surface defects. Hence, it would be possible to utilize a suitable visible emission towards the application of cell imaging. In this regard, undoubtedly many studies24,58 have already been performed on ZnO nanoparticles. In the present work, the PL study already confirmed the existence of an orange emission at 595 nm (λex = 400 nm) in the nanocomposites. Moreover, the intensity of the orange emission was found to be dependent on EUN/ZA molar ratio (R value), where the ZEG(10) sample exhibited the highest intensity over the others and proved the necessity of optimum amount of Eu incorporation in the ZnO graphene nanocomposite to obtain the high intensity of orange emission. Hence, the ZEG(10) nanocomposite could be expected to have a better cell imaging capability. We have investigated the performance of ZEG(10) compared with ZEG(00) for the human breast cancer cell (MCF7) imaging under a confocal laser scanning microscope. The DIC pictures and the fluorescent images were taken (Fig. 9a) for a fixed concentration (100 μg ml−1) of ZEG nanocomposites. From the images, it was clear that the internalization of the nanomaterials within the living cells occurred. Bright cell images were found due to the orange fluorescence of the nanocomposites under the microscope. However, a relative intensity of the images (Fig. S8, ESI†) were calculated using ImageJ software and analyzed by one-way ANNOVA. It was noted that the highest intensity (Fig. S8, ESI†) was observed when the ZEG(10) nanocomposite was used, and in this case, the intensity was found to be more than two times higher (Fig. S8, ESI†) compared to the ZEG(00) nanocomposite. The intensity of the orange fluorescence also corroborated the PL results (Fig. 7b). Hence, the orange emission of the ZEG(10) nanocomposite could be useful for the study of cell imaging.
ZnO is generally biocompatible and cost effective but nano ZnO has been classified as “extremely toxic” in the environment.35 The extreme toxicity of nano ZnO could generally be mitigated to be biocompatible through coating on the surface of the nano semiconductor oxide by graphene derivatives. It could be noted that graphene possesses a large surface area, chemical purity and the possibility of easy functionalization with a suitable semiconductor20 or suitable organic molecule.6,7 Therefore, graphene based ZnO nanocomposite could be used as an alternative of organic dyes62 for cell imaging. However, for further improvement of the property, proper modification of nano matrix would be necessary, and the incorporation of an optimum amount of Eu would be beneficial in this respect. In the present work, a relatively better cell imaging performance (Fig. 9a) was found in ZEG(10). It was known that the toxic effect of nanocomposites on biological cells (known as cytotoxicity) could depend upon several of their characteristics.63 It had already been demonstrated that nano ZnO exhibited a toxic effect in mammalian cells.32 This could be due to particle dissolution in the tissue culture medium and resulting from intracellular Zn2+ shedding. It was also reported that doping35 with Fe could be an effective way to reduce the particle dissolution of nano ZnO for the concerned application. Thus, the change of particle matrix, as well as the rate of particle dissolution, could be reduced by Fe doping. On the other hand, graphene based semiconductor (e.g. ZnS, CdSe) NPs20 were reported to have an effective cell imaging as well as high cell viability. In this work, we measured the cytotoxicity by measuring the cell viability of human breast cancer cells (MCF7) with ZEG nanocomposites (Fig. 9b). Approximately 74% viable cells were observed in ZEG(10) for 30 μg ml−1 of ZEG nanocomposite in 24 h duration. However, low cell viability was observed for the ZEG(00) nanocomposite, where no Eu was incorporated. Moreover, the cell viability remained nearly the same in the ZEG(15) nanocomposite compared to ZEG(10). This could be because of the same ID/IG value (Fig. 4 and Table S1 of ESI†), generated due to the exfoliation31 of graphene layers through interaction/complexation between free organic functional groups of CCG and the inorganic moieties present in the nanocomposite, as already observed from Raman spectral study. Hence, the observation clearly indicates that an optimum concentration of Eu incorporation in the nanocomposite was necessary to obtain better cell viability. Usually, the better cell viability and cell imaging capability, as well as the relatively large surface area could make the materials an effective carrier for drug delivery.64 In this respect, the Eu incorporated nanocomposites (R ≥ 0.10) could find application in drug delivery.
Footnotes |
† Electronic supplementary information (ESI) available. See DOI: 10.1039/c4ra06243d |
‡ Authors contributed equally to this work. |
This journal is © The Royal Society of Chemistry 2014 |