A molecularly imprinted electrochemical enzymeless sensor based on functionalized gold nanoparticle decorated carbon nanotubes for methyl-parathion detection
Bowan Wuab,
Lijie Houa,
Miao Dua,
Tiantian Zhanga,
Zhihua Wangb,
Zhonghua Xueb and
Xiaoquan Lu*b
aLONGDONG UNIVERSITY-FLUOBON Surfactant Engineering Technology Center, College of Chemistry & Chemical Engineering, Cooperative Innovation Center of Industrial Surfactant, Longdong University, 45 Lanzhou Road, Qingyang, China. E-mail: qywbowan@gmail.com; Fax: +86-931-7971323; Tel: +86-15701709818
bKey Laboratory of Bioelectrochemistry & Environmental Analysis of Gansu Province, College of Chemistry & Chemical Engineering, Northwest Normal University, 967 Anning East Road, Lanzhou, China. E-mail: luxq@nwnu.edu.cn; Fax: +86-931-7971323; Tel: +86-931-7971276
First published on 3rd October 2014
Abstract
Functionalized gold nanoparticles (FuAuNP) have potential applications because of their specific functional groups. p-Aminothiophenol (p-ATP) possesses double functional groups that can be used to form an S–Au bond and oligoaniline. Based on molecular imprinting technology and electrochemical technology, a novel enzymeless methyl-parathion (MP) sensor has been constructed with nanocomposites. The template molecule (MP) is embedded in the imprinting sites by p-ATP molecular self-assembly and FuAuNP electro-polymerization. The imprinting effective sites and the conductive performance are improved by gold nanoparticles decorated carbon nanotube nanocomposites (AuNP–MCNT). The linear relationships between peak current and MP concentration are obtained in the range from 0.1 to 1.1 ng mL−1 and 1.1 to 11 ng mL−1, respectively. The detection limit can be achieved as low as 0.08 ng mL−1 (3σ) with relative standard deviation of 3.8% (n = 5). This sensor was also applied for the detection of MP in apples and vegetables, with average recoveries between 95.2% and 105.7% (RSD < 5%). The results mentioned above show that the novel electrochemical sensor is an ideal device for the real-time determination of MP in real samples.
Introduction
With the development of intensive agricultural practices, pesticides (herbicides, fungicides, insecticides) are being widely used throughout the world, and millions of tons of pesticides are used each year in agriculture, medicine, industry and related activities.1 Methyl-parathion (MP), a type of organophosphorus pesticide, is widely used in agriculture due to its high toxicity to insects and limited persistence in the environment.2–4 Nevertheless, low levels of MP pesticides in agricultural products and the natural environment are extremely harmful to human and animal health. Nowadays, there are many classical methods for the detection of MP.5–11 They are all highly efficient and allow discrimination between the different types of organophosphorus compounds, but they are expensive, time-consuming, require highly qualified technicians and generally not suitable for real-time detection. Moreover, an enzyme/antibody-based immunoassay has also been developed for the detection of organophosphate.12–19 However, the antibodies or enzymes can be easily destroyed under harsh and high temperature environments due to their poor chemical and physical stability. Accordingly, it is still a great challenge to develop a rapid, inexpensive, reliable and sensitive method for the detection of MP in environment.20,21Because of its highly selective recognition and a wide choice of templates and functional monomers, molecular imprinting technique (MIT) has attracted increasing attention.22–27 Because of their unique advantages over natural biological receptors in terms of physical and chemical stability, ease of preparation, low cost, and applicability in harsh environmental conditions,28–30 molecularly imprinted polymers (MIP) have been widely explored for mimicking natural receptors.31–33 However, a variety of traditional imprinted materials suffer from certain drawbacks including small binding capacity, slow mass transfer and irregular material shape.34,35 As is well known, the quantity of effective recognition sites and conductivity determine the sensitivity of the imprinted sensor. The number of binding sites increases with the thickness of imprinted membrane, but thick imprinted membranes can lead to slow diffusion of the analytes to the recognition sites and inefficient communication between the imprinted sites and the transducers.36 To further increase the amount of effective binding sites on the sensor surface, the simplest solution is to modify the existing electrode through an assembly of nanoparticles. The resulting electrode can offer high conductivity, large specific surface area, and good biocompatibility. In recent years, scientists have made considerable efforts to overcome these problems by adopting nanofabrication techniques, for example in the preparation of mesoporous silica particles and polyaniline nanofibers.37,38 This technique is based on the small dimension and extremely high surface-to-volume ratio of nano-imprinting materials, which enable the imprinting technique to create more effective recognition sites than those obtained by traditional approaches, which only use porogens.38,39
Furthermore, carbon nanotubes (CNT)40 are ideal materials for the construction of electrochemical sensors due to their exceptional mechanical properties, unique electrical properties, high surface area, high aspect ratio, and enhanced catalytic properties. Accordingly, researchers have continued to develop novel applications for these nanomaterials in electrochemical sensors at a rapid pace.41–44 Gold nanoparticles (AuNP) are being increasingly used in many electrochemical applications because they have the ability to enhance the electrode conductivity and facilitate the electron transfer.45,46 More recently, the integration of metallic nanoparticles with CNT has attracted considerable interest for the construction of electrochemical sensors because of the low resistance ohmic contacts of these composites.19,47,48 In addition, these nano-hybrid materials often exhibit interesting properties that are not exhibited by the respective components alone. Therefore, nano-hybrid materials can offer new opportunities for the development of new sensors and biosensors with high analytical performance.49–53 Electrochemical techniques have several advantages in the field of sensors, including low cost, simplicity, easy miniaturization and automation, and high stability. Molecularly imprinted electrochemical sensors (MIECS) combine the advantage of both MIT and electrochemical sensors, and are widely used in the areas of environmental monitoring,54 biological/chemical analysis,55 pharmaceutical analysis,56 and residue detection of pesticides and overdose.57,58
In this paper, a novel sensor for the determination of MP based on MIP and electrochemical technology is constructed. Molecularly imprinted film was modified on the electrode surface, and MP was linked to the cavities constructed by binding sites of molecularly imprinted film. We hypothesized that the combination of surface molecular self-assembly and hybridization of nanomaterials, coupled with the polymerization of the functionalized gold nanoparticles (FuAuNP) and template molecule (MP) on glass carbon electrode (GCE), would produce a significant amount of effective imprinted sites and enhance its conductivity. The nanocomposite film has a high stability because AuNP–MCNT succeeds in being incorporated into the latticework of the formation of FuAuNP–ATP film. Therefore, we developed a new electrochemical sensor, which is sensitive to detect MP.
Experimental
Materials and chemicals
Multi-walled carbon nanotubes (MCNT) with a diameter of 20–40 nm were obtained from Shenzhen Nanotech Port Co., Ltd. Hydrochloroauric acid (HAuCl4·4H2O) was obtained from Shanghai Chemical Factory. Nafion solution (perfluorinated ion-exchange powder 5 wt% solution in a mixture of lower aliphatic alcohols and water, DE520) was obtained from DuPont Co. Methyl-parathion (MP) and p-aminothiophenol (p-ATP) was obtained from Aladdin Chemistry Co. Ltd. 2-mercaptoethanesulfonic acid was purchased from TCI (Shanghai, China) development Co., Ltd. All other reagents were of at least analytical reagent grade. Phosphate buffer solution (PBS) was prepared by using disodium hydrogen phosphate (Na2HPO4) and sodium dihydrogen phosphate (NaH2PO4), and the buffer was adjusted to the appropriate pH with sodium hydroxide (NaOH) and phosphoric acid (H3PO4). The stock solution of MP was prepared with ethanol and kept in refrigerator at about 4 °C. Double distilled water was used in the preparation of all aqueous solution and for washings. High-purity N2 was used. All the experiments were carried out at ambient temperature. (Scheme 1)Apparatus
Electrochemical measurements were carried out on a CHI832 electrochemical workstation (ChenHua Instruments Co., Shanghai, China) with a conventional three electrode system comprising of platinum wire as auxiliary electrode, Ag/AgCl electrode as reference and the bare or modified glass carbon electrode (GCE) or MIP electrode as working electrode. Electrochemical impedance spectroscopy (EIS) experiments were performed on a VMP2 Multi-potentiostat (Princeton Applied Research, USA), which was controlled by EC-Lab (V9.24) software (Bio-Logic SA). UV-vis absorption spectra were taken in absorption mode with a UV-1102 UV-vis spectrophotometer (Shanghai, China). The surface morphologies and size distribution of the prepared electrodes were characterized using a Field-emission Scanning Electron Microscope (FESEM; JEOL JSM-6701F, operating at 5 keV). High-resolution transmission electron microscopy (HRTEM) was performed using a FEI Tecnai TF20 TEM operated at 200 kV. For the TEM measurements, the sample was suspended in double distilled water solution and was drop casted onto a carbon-coated copper grid followed by solvent evaporation in air at room temperature. X-ray powder diffraction (XRD) data was obtained by an X' Pert PRO Multi-purpose Diffractometer (PANalytical, Netherlands) using Cu Kα radiation (k = 0.15418 nm). The pH measurements were performed with a PB-10 pH meter (Sartorius, Germany).Preparation of MP MIP electrochemical sensor
Prior to modification, the GCE was polished with 0.3 and 0.05 μm alumina slurry and thoroughly rinsed with double distilled water between each polishing step. Then, it was successively washed with double distilled water and ethanol in an ultrasonic bath, and finally dried with high purity nitrogen steam at room temperature.Preparation of functionalized AuNP
Au nanoparticles functionalized with 2-mercaptoethane sulfonic acid and p-ATP (FuAuNP) were prepared by mixing a 10 mL solution containing 197 mg of HAuCl4 in ethanol and a 5 mL solution containing 42 mg of mercaptoethane sulfonate and 8 mg of p-ATP in methanol. The two solutions were stirred in the presence of 2.5 mL of glacial acetic acid in an ice bath for 1 h. Subsequently, 7.5 mL of aqueous solution of 1 M sodium borohydride, NaBH4, was added dropwise, resulting in a dark colored solution associated with the presence of the AuNP. The solution was additionally stirred for 1 h in an ice bath, and then for 14 h at room temperature. The particles were successively washed and centrifuged (twice in each solvent) with methanol, ethanol, and diethyl ether. The TEM image of the FuAuNP is shown in Fig. 1. The particles have sizes less than 5 nm and uniformly distribute with spherical morphologies, which may be related to the method of preparation used in this work. The FuAuNP shows a good mono disperse distribution, without obvious aggregation in the copper net of TEM, which suggests that the surface functionalization is effective in improving the dispensability of AuNP. The electron diffraction graph (See Fig. 1B) of FuAuNP is a typical diffraction pattern of metal particles, implying a polycrystalline characteristic.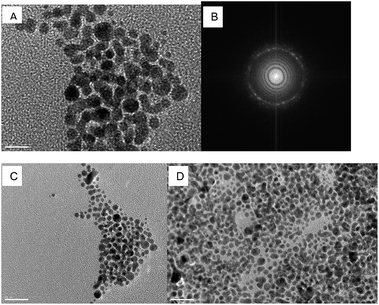 | ||
| Fig. 1 (A), (C) and (D): TEM images of FuAuNP in different resolution. (B): The electron diffraction graph of FuAuNP. | ||
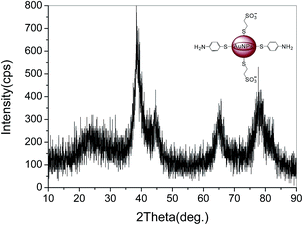
The XRD pattern of FuAuNP (See Fig. 2) shows five diffraction peaks at 2θ of 38.6°, 44.4°, 64.9°, 77.5° and 82.2°, which can be ascribed to the (1 1 1), (2 0 0), (2 2 0), (3 1 1) and (2 2 2) planes of the Au face-centered cubic crystallographic structure, respectively. According to the Scherrer equation,59,60 the average diameter of the FuAuNP was calculated to be 3.5 nm, which is consistent with the previous reports.61–65
Preparation of the molecularly imprinted electrochemical enzymeless sensor
The carboxylic acid-functionalized MCNT (MCNT–COOH) were synthesized according to the published method66 and the MCNT modified GCE (MCNT/GCE) were obtained according to our previous research.67 To electrodeposit AuNP on the surface of the MCNT/GCE, MCNT/GCE was immersed in 0.2 M Na2SO4 solution containing 1 mM HAuCl4. The modification of AuNP onto MCNT/GCE was conducted by CV scanning from −0.2 to 1.0 V with a scan rate of 50 mV s−1 for 6 cycles (Fig. 3A). The AuNP–MCNT hybrid modified GCE (AuNP–MCNT/GCE) was removed, rinsed with double distilled water, and finally blow-dried with nitrogen. To obtain MP–ATP–AuNP–MCNT/GCE, the AuNP–MCNT/GCE was immersed in 0.1 M phosphate buffer solution (PBS, pH 7.4), containing 1 mM p-ATP and 1 mM MP, for 2 h. Finally, the MP–ATP–AuNP–MCNT/GCE was immersed in PBS (pH 7.4), containing 1 mg mL−1 of FuAuNP and 0.2 mg mL−1 MP. The polymerization was performed by the application of 15 potential cycles between −0.35 and 0.5 V, with a potential scan rate of 50 mV s−1 (Fig. 3B).36,68,69 After electropolymerization, the composite membrane modified electrode (FuAuNP–ATP–MIP–AuNP–MCNT/GCE) was washed with the background electrolyte solution to remove any residual monomer in the electrode. Then, the imprinted electrode was rinsed with double distilled water and finally dried under nitrogen for further usage. Similarly, a non-MIP control electrode was prepared by following the same procedure but without the MP template molecule to ensure that the effects were observed only due to the imprinting features and not due to the subsequent treatments experienced by the electrode. The MP template molecule was removed from the MIP film by CV scanning three times in PBS (pH 7.0) solution at room temperature. The complete removal of MP from the electropolymerized film was electrochemically verified. Fig. 3C shows the process of template removal by CV between 0.3 and −0.85 V with the scan rate of 100 mV s−1 in PB7 containing 0.1 M KCl. It indicates that the template molecule was easily removed from the composite membrane. In contrast, for the Non-MIP-GCE (no shows), the redox current almost did not appear because the FuAuNP–ATP–AuNP–MCNT film covered the surface of the prepared GCE in the absence of MP, where no cavities with binding sites were obtained.Electrochemical Measurements
Cyclic voltammetry (CV) and linear sweep voltammetry (LSV) measurements were performed in the potential range from 0.3 to −0.8 V with a scan rate of 50 mV s−1. The electrochemical cell was connected to a VMP2 Multi-potentiostat interfaced to a PC. An electrochemical impedance software EC-Lab was used to carry out impedance measurements. EIS was scanned at a formal potential of 0.25 V in the frequency range from 100 kHz to 100 mHz, using an AC voltage of 5 mV amplitude. A simple equivalent circuit could be used to simulate the experimental EIS data gained from the modified GCE coated with a less conductive polymeric film. The impedance data (Rct), thus obtained were fitted to the R(Q(RW)) equivalent circuit using the ZsimpWin (Princeton Applied Research) program. All the measurements were performed at room temperature.Real sample preparation
Apple and cucumber samples were obtained from the supermarket (Lanzhou, China). The real samples were prepared by peeling and chopping the fruits into small pieces. Extraction of 10 g of the homogenized sample was performed with ethanol (30 mL). The extract was simply filtered through a membrane and evaporated to dryness, following which ethanol (2 mL) was added. After mixing, the solution was diluted to 100 mL with 0.1 M PBS (pH = 7.0) solution. Spiking of the sample was achieved by injecting MP stock solution into the sample and then homogenizing it.Results and discussion
Preparation of FuAuNP–ATP–MIP–AuNP–MCNT/GCE
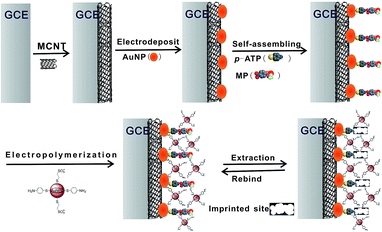
Scheme 2 illustrates the preparation procedures of FuAuNP-ATP–MIP–AuNP–MCNT/GCE. Prior to polymerization, AuNP–MCNT/GEC was immersed into p-ATP and MP solution for 2 h. A self-assembled monolayer of p-ATP molecules was formed on the AuNP surface by Au–S bonds between gold and the thiol groups (–SH) of p-ATP molecules. The p-ATP monolayer was chemisorbed on the AuNP, which exposed an array of amino groups towards the solution. Then, MP molecules in solution phase could be assembled on the surface of p-ATP–AuNP–MCNT/GCE by hydrogen bond interactions between the amino groups (–NH2) of p-ATP and nitro (–NO2) groups of MP. The intermolecular interactions among p-ATP, MP and FuAuNP could be confirmed by UV absorbance spectra. The maximum absorption wavelength of p-ATP showed a red shift in the presence of MP, and the maximum absorbance of p-ATP also increased with the addition of MP (See Fig. 4). This demonstrated that hydrogen bond interactions between the amino group (–NH2) of p-ATP and nitro (–NO2) groups of MP are formed in the system. Therefore, the strong hydrogen bond interactions drive the MP molecules to assemble on the surface of the p-ATP modified electrode. Then, the MP were embedded into the imprinted ATP-FuAuNP membranes on AuNP–MCNT/GCE to form surface imprinted sites, which increased the amount of imprinted sites on the electrode surface and enhanced the sensitivity and selectivity of the sensor.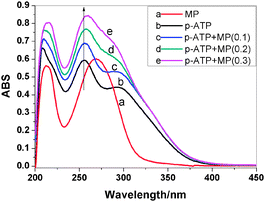 | ||
| Fig. 4 UV spectra of MP (a), p-ATP (b), different amounts of MP in 0.067 mg mL−1 ATP solution (c–e). | ||
Morphological characterization of the FuAuNP-ATP-MIP-AuNP- MCNT/GCE
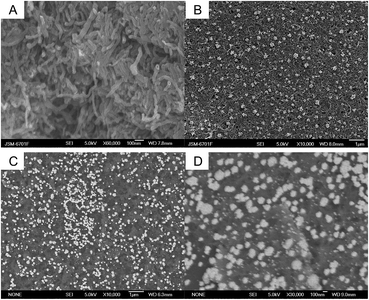
The surface morphologies of the different modified films were studied by means of SEM. Fig. 5 shows the SEM images of MCNT (Fig. 5A), AuNP–MCNT (Fig. 5B) and FuAuNP-ATP-MIP-AuNP–MCNT composites (Fig. 5C and D at different resolution). Homogeneous spaghetti-like tangled MCNT (Fig. 5A) decorated with a small amount of AuNP is observed in Fig. 5B. The diameter of the nanoparticles was between 20 and 50 nm. After self-assembling and electropolymerizing the FuAuNP, it was found that the FuAuNP nanoparticles uniformly distributed between MCNT and AuNP and the diameter of the FuAuNP was less than 10 nm (Fig. 5C and D). The 3-dimensional structure was formed after AuNP decorated MCNT were further modified with MIP-ATP-FuAuNP on the electrode surface. The recognition sites, conductivity and specific surface area of the electrode were effectively improved by the decoration nanocomposites.Electrochemical characterization of the FuAuNP–ATP–MIP–AuNP–MCNT/GCE
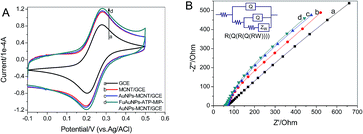
CV and EIS experiments were performed to characterize the different modified electrodes in 5 mM [Fe(CN)6]3−/[Fe(CN)6]4− containing 0.1 M KCl solution (see Fig. 6A). The reversible one-electron redox behavior of ferricyanide ions was observed on the bare GCE. After being modified with MCNT, the peak current of [Fe(CN)6]3−/[Fe(CN)6]4− was increased. Moreover, because of AuNP deposition on the MCNT/GCE, the peak current of [Fe(CN)6]3−/[Fe(CN)6]4− was increased again. Thus, the introduction of AuNP–MCNT hybrid played certain role in the increment of the electroactive surface area and provided a conducting bridge for the electron-transfer of [Fe(CN)6]3−/[Fe(CN)6]4−. The FuAuNP-ATP-MIP-AuNP–MCNT composite membrane was porous with efficient conductivity and large specific surface area, thus the peak current of [Fe(CN)6]3−/[Fe(CN)6]4− was further increased.EIS is an effective method for studying the interfacial properties of modified electrodes. Nyquist plots of GCE, MCNT/GCE, AuNP–MCNT/GCE, and FuAuNP–ATP–MIP–AuNP–MCNT/GCE are shown in Fig. 5B. The impedance data (Rct) are obtained by fitting to the R(Q(R(Q(RW)))) equivalent circuit model (inset of Fig. 6B) using the ZsimpWin program. The impedance data obtained contain the electron transfer process (modeled as a resistance to charge transfer, Rct) and the diffusion process (modeled as the Warburg-type impedance, W). Both Rct and W are in parallel with the constant phase angle element (Q).70 The angle of the line in semi-infinite region was observed to be less than 45°. This is a typical porous electrode surface character. The above EIS results reveal that AuNP–MCNT/GCE exhibits an improved charge transfer rate than that of bare GCE. The EIS of FuAuNP–ATP–MIP–AuNP–MCNT/GCE behaves similar to a porous electrode,67 which is consistent with the results of CV.
Effect of solution pH on the peak currents and peak potential
The effects of solution pH on peak currents and peak potentials were studied by linear stripping sweep voltammetry (LSSV) and the results are shown in Fig. 7. With the increase of pH value, the peak potentials shift negatively (shown in Fig. 7b). At the same time, the experimental results also show that pH has a significant influence on the cathodic peak current of MP on MIP–AuNP–MCNT–GCE (shown in Fig. 7a). It can be seen that the values of the peak current changes with the different pH in the range from 3.5 to 11. Obviously, the maximum response of peak current appears at pH 7.0. In this work, the optimum pH value of 7.0 was selected for the following experiments.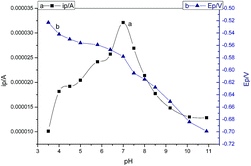 | ||
| Fig. 7 LSSV response of the MIP sensor in 1 μg mL−1 MP containing PBS at various pHs: 3.5, 4.0, 4.5, 5.0, 5.8, 6.4, 7.0, 7.5, 8.0, 8.5, 9.2, 10.1, and 10.9. | ||
Effects of scan rate and accumulation time on the electrochemical response of MP
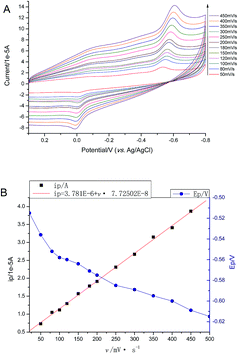
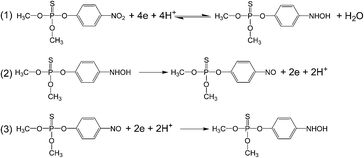
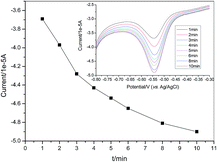
The CV curves of MP on the FuAuNP–ATP–MIP–AuNP–MCNT/GCE were investigated at different scan rates (see Fig. 8). The reduction peak currents for 5 ng mL−1 MP in 0.1 M PBS (pH 6.8) are linearly proportional to the scan rates from 50 to 450 mV s−1 with a linear regression equation of ip = 3.781 × 10⁻⁶ + v7.72502 × 10−8 (r = 0.9993), which indicates that the electron transfer processes are controlled by surface adsorption process. In addition, the reduction peak potentials shift with the increase of scan rate, which can be attributed to the catalytic effects of the surface of the imprinted composite on the template molecules. The proposed catalysis mechanism is shown in the following eqn (1)–(3).71–73 (Scheme 3)It has been previously reported that different incubation time may cause different responses. Therefore, the effect of incubation time on peak current was investigated by kinetic experiment in this work. The incubation step is usually a simple and effective way to enhance the sensitivity of the imprinted sensor. Fig. 9 shows the change of LSSV with different incubation times. The figure shows that the LSSV peak currents increase with the increase in incubation time. When the incubation time is less than 4 min, the peak current rapidly increases; however, it slowly increases after 4 min. Considering the efficiency and reproducibility of the experiment, the incubation time of 6 min was selected for the subsequent experiments.
Electrochemical detection of MP
In this study, LSSV was employed to evaluate the performance of the sensor for the detection of MP. After FuAuNP–ATP–MIP–AuNP–MCNT/GCE is immersed in different concentrations of MP solutions for 6 min, a significant increase in peak current is observed (Fig. 10). It can be that seen there are two linear relationships between current and MP concentration from 0.1 to 1.1 ng mL−1 (R = 0.9983) and 1.1 to 11 ng mL−1 (R = 0.9996). Therefore, two different slopes of linear curves are obtained, which are resulting from the different mechanisms of molecular recognition in the two different ranges of concentration. In the range of 0.1 to 1.1 ng mL−1, because of the low concentration levels of MP in solution, hydrogen bonding adsorption is the main mode of the action between the MP molecules and binding sites. As a result, the large slope of the linear relationship is obtained. However, when the concentration of MP is high in the solution, strong Van der Waals forces between MP molecules occurs, in addition to the hydrogen bonding adsorption. It has deleterious effects for template molecules to reach the imprinted sites, resulting in a low slope in the range of high concentration. Most importantly, it is noteworthy that the detection limit of 0.08 ng mL−1 can be achieved, which is the lowest value reported so far, indicating the high sensitivity of the sensor that is designed in this paper for the detection of MP.31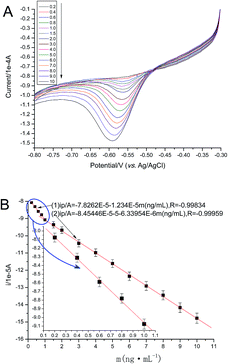 | ||
| Fig. 10 (A) LSSV responses of FuAuNP–ATP–MIP–AuNP–MCNT/GCE to the different concentrations of MP in 0.1 M PBS with a scan rate 50 mV s−1. (B) Calibration curves corresponding to the analysis of MP. | ||
Selectivity of the MIP enzymeless sensor
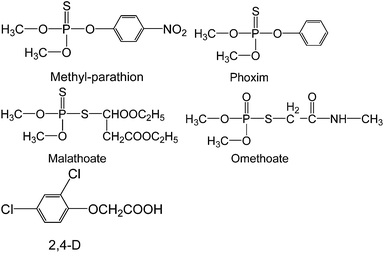
The anti-interference ability of the proposed sensor has also been studied. To detect the selectivity of the MIP sensor, four types of organophosphate pesticides (phoxim, malathoate, omethoate and (2,4-dichlorophenoxy) acetic acid (2,4-D)) which have a similar structure to MP were selected to conduct the control experiments.The experimental results show that the FuAuNP–ATP–MIP–AuNP–MCNT/GCE in 0.1 M PBS containing 5 ng mL−1 MP (pH 7.0) has no obvious interference from organophosphate pesticides such as phoxim, malathoate, omethoate and 2,4-D, and other inorganic ions (PO43−, SO42−, NO3−). These results clearly indicate that the MIPs sensor have a good recognition ability towards the target molecule. The high specificity is mainly attributed to the unique binding modes of the imprinted sites to the target molecule, eliminating the possibility to bind with other analogues.
Reproducibility and stability of the molecularly imprinted sensor
To characterize the reproducibility of the sensor, a series of repetitive measurements were carried out in 0.1 M PBS containing 5 ng mL−1 MP (pH 7.0) under identical experimental conditions. The electrode can be easily renewed by CV in PBS after each determination. For 5 ng mL−1 MP, relative peak current change is obtained by the use of each sensor. Relative standard deviation (RSD) of 4.2% (n = 5) was obtained, which indicated good reproducibility. The stability of the sensors is an important factor for practical applications. It was found that no obvious change in peak current was observed after the MIP sensor was stored at 4 °C for over 10 days. After one month, it decreased by approximately 43%. This result indicates that the MIP sensor possesses excellent stability.Sample analysis
The feasibility of the MIP sensor for practical applications was investigated by the determination of MP in distilled water, tap water, apple and cucumber samples according to the proposed method. None of these real samples had electrochemical responses when analyzed by using the MIP sensor. They were then spiked with different levels of MP and the results are presented in Table 1.| Sample | Spiked/ng mL−1 | Found/ng mL−1 | Recovery (%) | RSD (%) |
|---|---|---|---|---|
| Distilled water | ||||
| 1 | 0.50 | 0.493 | 98.6 | 1.8 |
| 2 | 1.00 | 1.012 | 101.2 | 2.0 |
![[thin space (1/6-em)]](https://www.rsc.org/images/entities/char_2009.gif) |
||||
| Tap water | ||||
| 1 | 0.50 | 4.856 | 97.12 | 2.3 |
| 2 | 1.00 | 1.046 | 104.6 | 2.6 |
![[thin space (1/6-em)]](https://www.rsc.org/images/entities/char_2009.gif) |
||||
| Apple | ||||
| 1 | 0.50 | 0.476 | 95.2 | 3.2 |
| 2 | 1.00 | 1.054 | 105.4 | 3.5 |
| 3 | 5.00 | 5.286 | 105.7 | 3.7 |
![[thin space (1/6-em)]](https://www.rsc.org/images/entities/char_2009.gif) |
||||
| Cucumber | ||||
| 1 | 0.50 | 0.483 | 96.6 | 2.8 |
| 2 | 1.00 | 1.052 | 105.2 | 3.3 |
| 3 | 5.00 | 4.795 | 95.9 | 3.8 |
As shown in Table 1, the sensor used to detect MP is not greatly affected by MP in different samples. The average recoveries range between 95.2% and 105.7%, with less than 3.8% RSD (n = 5). The presented results demonstrate that the proposed method can be a promising approach for MP determination in real samples.
As shown in Table 2, the proposed sensor was compared with other published methods. It can be seen that the sensor exhibits remarkable advantages, such as higher sensitivity, wider linear range and lower detection limit, which provide an attractive perspective for its wide-scale application.
| Methods | Linear range | LOD/M | Ref. |
|---|---|---|---|
| MWCNTs MIP/GCE | 2.0 × 10⁻⁷ to 1.0 × 10⁻⁵ M | 6.7 × 10⁻⁸ M | 39 |
| MWCNTs–PAAM/GCE | 5.0 × 10⁻⁹ to 1.0 × 10⁻⁵ M | 2.0 × 10⁻⁹ M | 74 |
| Surfactant–clay/GCE | 4.0 × 10⁻⁷ to 8.5 × 10⁻⁶ M | 7.0 × 10⁻⁸ M | 75 |
| ZrO2/CPE | 1.9 × 10⁻⁸ to 1.1 × 10⁻⁵ M | 7.6 × 10⁻⁹ M | 76 |
| Pd/MWCNTs/GCE | 3.8 × 10⁻⁷ to 5.3 × 10⁻⁵ M | 1.9 × 10⁻⁷ M | 77 |
| Au–nafion/GCE | 5.0 × 10⁻⁷ to 1.2 × 10⁻⁴ M | 1.0 × 10⁻⁷ M | 78 |
| pSC6–AgNPs/GCE | 1.0 × 10⁻⁸ to 8.0 × 10⁻⁵ M | 4.0 × 10⁻⁹ M | 79 |
| OMC/GCE | 9.0 × 10⁻⁸ to 6.1 × 10⁻⁵ M | 7.6 × 10⁻⁹ M | 80 |
| Silicate–CTAB/GCE | 1.0 × 10⁻⁷ to 1.0 × 10⁻⁴ M | 1.0 × 10⁻⁸ M | 81 |
| C/p–NiTSPc/CFME | 3.8 × 10⁻⁸ to 3.8 × 10⁻⁵ M | 1.5 × 10⁻⁷ M | 82 |
| MWCNTs–chitosan/GCE | 1.9 × 10⁻⁷ to 7.6 × 10⁻⁶ M | 1.9 × 10⁻⁸ M | 83 |
| Au/MWCNTs electrode | 1.9 × 10⁻⁶ to 6.1 × 10⁻⁵ M | 1.9 × 10⁻⁷ M | 84 |
| Imprinted PQu–PRe–AuNPs/GCE | 7 × 10⁻⁸ to 1 × 10⁻⁶ M | 3.4 × 10⁻¹⁰ M | 85 |
| GR–CS/GCE | 4.0–400 ng mL−1 | 0.8 ng mL−1 | 86 |
| AChE–SiSG–CPE | 0.1–1 ppb | 0.04 ppb | 87 |
| AChE–AuNPs–PPy/GCE | 0.019 × 10⁻⁶ to 0.45 × 10⁻⁶ M | 7.6 × 10⁻⁷ M | 88 |
| Optical microbial biosensor | 4–80 × 10−6 M | 3 × 10⁻⁷ M | 16 |
| MPH–Sp@AuNPs/MWNTs/GCE | 0.001–5 × 10⁻⁶ g mL−1 | 0.3 ng mL−1 | 89 |
| Matrix solid phase dispersion | — | 4 × 10⁻⁹ M | 90 |
| β-CD–graphene/GCE | 0.3–1.0 ppb, 1.0–500 ppb | 0.05 ppb | 12 |
| HNC–CNP–CPE | 1.55 × 10⁻⁹ to 3.67 × 10⁻⁶ M | 4.70 × 10⁻¹⁰ M | 91 |
| LDHs–GNs/GCE | 0.003–0.05 and 0.1–1.0 μg mL−1 | 0.6 ng mL−1 | 92 |
| Nano-Au/SDBS/GCE | 5.0 × 10⁻⁷ to 1.0 × 10⁻⁴ M | 8.6 × 10⁻⁸ M | 93 |
| FuAuNP–ATP–MIP–AuNP–MCNT/GCE | 0.1–1.1 and 1.1–11 ng mL−1 | 0.08 ng mL−1 | This work |
Conclusions
A novel electrochemical sensing strategy for sensitively detecting MP was developed. The proposed method relies on the hydrogen bond interactions between MP, p-ATP and FuAuNP. The tailor-made cavities formed in the imprinted film showed good selectivity toward MP. The reproducibility, repeatability and stability of the MIP sensor are satisfactory. The good sensitivity and selectivity of the sensor is attributed to following reasons: Firstly, the employment of MCNT in the Nafion film enlarges the electro-active surface area. Secondly, the nano-hybrid materials of AuNP–MCNT improve the conductivity of the assembled film and increase the quantity of template molecule in the unit area. Finally, the 3-dimensional structure is formed by the electro-polymerization and self-assembly of FuAuNP–ATP–MIP–AuNP–MCNT on the electrode surface. The network-like nanocomposite not only provided a microenvironment to increase the recognition sites, conductivity and specific surface area of electrode, but also exhibited a strong synergetic effect for improving the sensing properties of MP. Therefore, this novel, fast and facile strategy reported herein can be further expected to fabricate various electrochemical sensors for detecting pesticide residuals and other environmentally deleterious chemicals.Acknowledgements
This work was supported by the National Natural Science Foundation of China (no. 21175108, 20965007, 21265018), the Applied Chemistry Key Subject of Gansu Province (no. GSACKS20130113), the Science and Technology Support Projects of Gansu Province (no. 1011GKCA025), the Natural Science Foundation of Gansu Province (no. 1208RJZM289), the Science and Technology Projects of Qingyang (no. KH201302) and the Doctor Foundation of Longdong University (no. XYBY07).References
- J. Sherma, Anal. Chem., 1987, 59, 18R–31R CrossRef CAS.
- G. Gervais, S. Brosillon, A. Laplanche and C. Helen, J. Chromatogr. A, 2008, 1202, 163–172 CrossRef CAS PubMed.
- D. Du, J. Wang, J. N. Smith, C. Timchalk and Y. Lin, Anal. Chem., 2009, 81, 9314–9320 CrossRef CAS PubMed.
- G. Liu and Y. Lin, Anal. Chem., 2006, 78, 835–843 CrossRef CAS PubMed.
- E. Borrás, P. Sánchez, A. Muñoz and L. A. Tortajada-Genaro, Anal. Chim. Acta, 2011, 699, 57–65 CrossRef PubMed.
- M. R. Khalili-Zanjani, Y. Yamini, N. Yazdanfar and S. Shariati, Anal. Chim. Acta, 2008, 606, 202–208 CrossRef CAS PubMed.
- A. Garrido Frenich, J. L. Martínez Vidal, A. D. Cruz Sicilia, M. J. González Rodríguez and P. Plaza Bolaños, Anal. Chim. Acta, 2006, 558, 42–52 CrossRef CAS PubMed.
- M. J. Hengel and M. Miller, J. Agric. Food Chem., 2008, 56, 6851–6856 CrossRef CAS PubMed.
- O. Leoni, R. Iori and S. Palmieri, J. Agric. Food Chem., 1991, 39, 2322–2326 CrossRef CAS.
- H. Guan, W. E. Brewer and S. L. Morgan, J. Agric. Food Chem., 2009, 57, 10531–10538 CrossRef CAS PubMed.
- J. W. Wong, M. G. Webster, C. A. Halverson, M. J. Hengel, K. K. Ngim and S. E. Ebeler, J. Agric. Food Chem., 2003, 51, 1148–1161 CrossRef CAS PubMed.
- S. Wu, X. Lan, L. Cui, L. Zhang, S. Tao, H. Wang, M. Han, Z. Liu and C. Meng, Anal. Chim. Acta, 2011, 699, 170–176 CrossRef CAS PubMed.
- A. Crew, D. Lonsdale, N. Byrd, R. Pittson and J. P. Hart, Biosens. Bioelectron., 2011, 26, 2847–2851 CrossRef CAS PubMed.
- J. Kumar and S. F. D'Souza, Biosens. Bioelectron., 2010, 26, 1292–1296 CrossRef CAS PubMed.
- L. B. O. dos Santos and J. C. Masini, Anal. Chim. Acta, 2008, 606, 209–216 CrossRef CAS PubMed.
- J. Kumar, S. K. Jha and S. F. D'Souza, Biosens. Bioelectron., 2006, 21, 2100–2105 CrossRef CAS PubMed.
- C. Wang, X. Li, Y. Liu, Y. Guo, R. Xie, W. Gui and G. Zhu, J. Agric. Food Chem., 2010, 58, 5658–5663 CrossRef CAS PubMed.
- M. Mascini, M. Sergi, D. Monti, M. D. Carlo and D. Compagnone, Anal. Chem., 2008, 80, 9150–9156 CrossRef CAS PubMed.
- S. Guo, J. Li, W. Ren, D. Wen, S. Dong and E. Wang, Chem. Mater., 2009, 21, 2247–2257 CrossRef CAS.
- S. Xu, C. Guo, Y. Li, Z. Yu, C. Wei and Y. Tang, J. Hazard. Mater., 2014, 264, 34–41 CrossRef CAS PubMed.
- L. Zhao, F. Zhao and B. Zeng, Sens. Actuators, B, 2013, 176, 818–824 CrossRef CAS PubMed.
- G. Mustafa and P. A. Lieberzeit, RSC Adv., 2014, 4, 12723–12728 RSC.
- M. Andac and A. Denizli, RSC Adv., 2014, 4, 31130–31141 RSC.
- P. J. R. Roche, S. M. Ng, R. Narayanaswamy, N. Goddard and K. M. Page, Sens. Actuators, B, 2009, 139, 22–29 CrossRef CAS PubMed.
- K. Haupt and K. Mosbach, Chem. Rev., 2000, 100, 2495–2504 CrossRef CAS PubMed.
- M. T. Muldoon and L. H. Stanker, Anal. Chem., 1997, 69, 803–808 CrossRef CAS.
- L. Ye and K. Mosbach, Chem. Mater., 2008, 20, 859–868 CrossRef CAS.
- Z.-p. Yang and C.-j. Zhang, Sens. Actuators, B, 2009, 142, 210–215 CrossRef CAS PubMed.
- B. Wu, Z. Wang, Z. Xue, X. Zhou, J. Du, X. Liu and X. Lu, Analyst, 2012, 137, 3644–3652 RSC.
- B. Wu, Z. Wang, D. Zhao and X. Lu, Talanta, 2012, 101, 374–381 CrossRef CAS PubMed.
- H. Li, Z. Wang, B. Wu, X. Liu, Z. Xue and X. Lu, Electrochim. Acta, 2012, 62, 319–326 CrossRef CAS PubMed.
- W. Zhihua, L. Xiaole, Y. Jianming, Q. Yaxin and L. Xiaoquan, Electrochim. Acta, 2011, 58, 750–756 CrossRef PubMed.
- C. Algieri, E. Drioli, L. Guzzo and L. Donato, Sensors, 2014, 14, 13863–13912 CrossRef PubMed.
- J. Dai, X. Wei, Z. Cao, Z. Zhou, P. Yu, J. Pan, T. Zou, C. Li and Y. Yan, RSC Adv., 2014, 4, 7967–7978 RSC.
- F. Duan, C. Chen, G. Wang, Y. Yang, X. Liu and Y. Qin, RSC Adv., 2014, 4, 1469–1475 RSC.
- M. Riskin, R. Tel-Vered, T. Bourenko, E. Granot and I. Willner, J. Am. Chem. Soc., 2008, 130, 9726–9733 CrossRef CAS PubMed.
- B. M. Jung, M. S. Kim, W. J. Kim and J. Y. Chang, Chem. Commun., 2010, 46, 3699–3701 RSC.
- Y. Liang, L. Gu, X. Liu, Q. Yang, H. Kajiura, Y. Li, T. Zhou and G. Shi, Chem.–Eur. J., 2011, 17, 5989–5997 CrossRef CAS PubMed.
- D. Zhang, D. Yu, W. Zhao, Q. Yang, H. Kajiura, Y. Li, T. Zhou and G. Shi, Analyst, 2012, 137, 2629–2636 RSC.
- S. Iijima, Nature, 1991, 354, 56–58 CrossRef CAS.
- B. J. Privett, J. H. Shin and M. H. Schoenfisch, Anal. Chem., 2010, 82, 4723–4741 CrossRef CAS PubMed.
- C. B. Jacobs, M. J. Peairs and B. J. Venton, Anal. Chim. Acta, 2010, 662, 105–127 CrossRef CAS PubMed.
- F. C. Moraes, I. Cesarino, V. Cesarino, L. H. Mascaro and S. A. S. Machado, Electrochim. Acta, 2012, 85, 560–565 CrossRef CAS PubMed.
- B. B. Prasad and I. Pandey, Electrochim. Acta, 2013, 88, 24–34 CrossRef CAS PubMed.
- R. N. Goyal, V. K. Gupta, M. Oyama and N. Bachheti, Electrochem. Commun., 2005, 7, 803–807 CrossRef CAS PubMed.
- A. N. Shipway, E. Katz and I. Willner, ChemPhysChem, 2000, 1, 18–52 CrossRef CAS.
- Y. Guo, S. Guo, Y. Fang and S. Dong, Electrochim. Acta, 2010, 55, 3927–3931 CrossRef CAS PubMed.
- S. Guo and S. Dong, TrAC, Trends Anal. Chem., 2009, 28, 96–109 CrossRef CAS PubMed.
- Y. Lin, K. A. Watson, S. Ghose, J. G. Smith, T. V. Williams, R. E. Crooks, W. Cao and J. W. Connell, J. Phys. Chem. C, 2009, 113, 14858–14862 CAS.
- Y. Lin, K. A. Watson, M. J. Fallbach, S. Ghose, J. G. Smith, D. M. Delozier, W. Cao, R. E. Crooks and J. W. Connell, ACS Nano, 2009, 3, 871–884 CrossRef CAS PubMed.
- K. A. Mahmoud, S. Hrapovic and J. H. T. Luong, ACS Nano, 2008, 2, 1051–1057 CrossRef CAS PubMed.
- F. Valentini, A. Amine, S. Orlanducci, M. L. Terranova and G. Palleschi, Anal. Chem., 2003, 75, 5413–5421 CrossRef CAS.
- A. V. Ellis, K. Vijayamohanan, R. Goswami, N. Chakrapani, L. S. Ramanathan, P. M. Ajayan and G. Ramanath, Nano Lett., 2003, 3, 279–282 CrossRef CAS.
- T. Alizadeh, M. Zare, M. R. Ganjali, P. Norouzi and B. Tavana, Biosens. Bioelectron., 2010, 25, 1166–1172 CrossRef CAS PubMed.
- J. Li, F. Jiang, Y. Li and Z. Chen, Biosens. Bioelectron., 2011, 26, 2097–2101 CrossRef CAS PubMed.
- F. T. C. Moreira, A. H. Kamel, J. R. L. Guerreiro and M. G. F. Sales, Biosens. Bioelectron., 2010, 26, 566–574 CrossRef CAS PubMed.
- F. L. Dickert, M. Tortschanoff, W. E. Bulst and G. Fischerauer, Anal. Chem., 1999, 71, 4559–4563 CrossRef CAS.
- E. Pardieu, H. Cheap, C. Vedrine, M. Lazerges, Y. Lattach, F. Garnier, S. Remita and C. Pernelle, Anal. Chim. Acta, 2009, 649, 236–245 CrossRef CAS PubMed.
- A. L. Rogach, A. Kornowski, M. Gao, A. Eychmüller and H. Weller, J. Phys. Chem. B, 1999, 103, 3065–3069 CrossRef CAS.
- J. Luo, M. M. Maye, V. Petkov, N. N. Kariuki, L. Wang, P. Njoki, D. Mott, Y. Lin and C.-J. Zhong, Chem. Mater., 2005, 17, 3086–3091 CrossRef CAS.
- D. Balogh, R. Tel-Vered, R. Freeman and I. Willner, J. Am. Chem. Soc., 2011, 133, 6533–6536 CrossRef CAS PubMed.
- M. Frasconi, R. Tel-Vered, M. Riskin and I. Willner, J. Am. Chem. Soc., 2010, 132, 9373–9382 CrossRef CAS PubMed.
- M. Riskin, R. Tel-Vered, O. Lioubashevski and I. Willner, J. Am. Chem. Soc., 2009, 131, 7368–7378 CrossRef CAS PubMed.
- I. Willner, B. Willner and R. Tel-Vered, Electroanalysis, 2011, 23, 13–28 CrossRef CAS.
- J. Zhang, M. Riskin, R. Freeman, R. Tel-Vered, D. Balogh, H. Tian and I. Willner, ACS Nano, 2011, 5, 5936–5944 CrossRef CAS PubMed.
- M. Shen, S. H. Wang, X. Shi, X. Chen, Q. Huang, E. J. Petersen, R. A. Pinto, J. R. Baker and W. J. Weber, J. Phys. Chem. C, 2009, 113, 3150–3156 CAS.
- B. Wu, Z. Wang, z. Xue, X. Zhou, J. Du, X. Liu and X. Lu, Analyst, 2012, 137, 3644–3652 RSC.
- I. Rubinstein, J. Rishpon, E. Sabatani, A. Redondo and S. Gottesfeld, J. Am. Chem. Soc., 1990, 112, 6135–6136 CrossRef CAS.
- Z. Huang, F. Chen, P. A. Bennett and N. Tao, J. Am. Chem. Soc., 2007, 129, 13225–13231 CrossRef CAS PubMed.
- C.-N. Cao and J.-Q. Zhang, An Introduction to Electrochemical Impedance Spectroscopy, Sciences Press, Beijing, 2002 Search PubMed.
- X. Tan, B. Li, K. Liew and C. Li, Biosens. Bioelectron., 2010, 26, 868–871 CrossRef CAS PubMed.
- D. Du, X. Ye, J. Zhang, Y. Zeng, H. Tu, A. Zhang and D. Liu, Electrochem. Commun., 2008, 10, 686–690 CrossRef CAS PubMed.
- G. Liu and Y. Lin, Anal. Chem., 2005, 77, 5894–5901 CrossRef CAS PubMed.
- Y. Zeng, D. Yu, Y. Yu, T. Zhou and G. Shi, J. Hazard. Mater., 2012, 217–218, 315–322 CrossRef CAS PubMed.
- H. L. Tcheumi, I. K. Tonle, E. Ngameni and A. Walcarius, Talanta, 2010, 81, 972–979 CrossRef CAS PubMed.
- H. Parham and N. Rahbar, J. Hazard. Mater., 2010, 177, 1077–1084 CrossRef CAS PubMed.
- B. Huang, W.-D. Zhang, C.-H. Chen and Y.-X. Yu, Microchim. Acta, 2010, 171, 57–62 CrossRef CAS.
- T.-F. Kang, F. Wang, L.-P. Lu, Y. Zhang and T.-S. Liu, Sens. Actuators, B, 2010, 145, 104–109 CrossRef CAS PubMed.
- Y. Bian, C. Li and H. Li, Talanta, 2010, 81, 1028–1033 CrossRef CAS PubMed.
- D. Pan, S. Ma, X. Bo and L. Guo, Microchim. Acta, 2011, 173, 215–221 CrossRef CAS.
- S. Xia, J. Zhang and C. Li, Anal. Bioanal. Chem., 2010, 396, 697–705 CrossRef CAS PubMed.
- I. Tapsoba, S. Bourhis, T. Feng and M. Pontié, Electroanalysis, 2009, 21, 1167–1176 CrossRef CAS.
- D. Du, M. Wang, J. Zhang, J. Cai, H. Tu and A. Zhang, Electrochem. Commun., 2008, 10, 85–89 CrossRef CAS PubMed.
- J.-C. Ma and W.-D. Zhang, Microchim. Acta, 2011, 175, 309–314 CrossRef CAS.
- H. Li, Z. Wang, B. Wu, X. Liu, Z. Xue and X. Lu, Electrochim. Acta, 2012, 62, 319–326 CrossRef CAS PubMed.
- S. Yang, S. Luo, C. Liu and W. Wei, Colloids Surf., B, 2012, 96, 75–79 CrossRef CAS PubMed.
- P. Raghu, T. Madhusudana Reddy, B. E. Kumara Swamy, B. N. Chandrashekar, K. Reddaiah and M. Sreedhar, J. Electroanal. Chem., 2012, 665, 76–82 CrossRef CAS PubMed.
- J. Gong, L. Wang and L. Zhang, Biosens. Bioelectron., 2009, 24, 2285–2288 CrossRef CAS PubMed.
- S. Chen, J. Huang, D. Du, J. Li, H. Tu, D. Liu and A. Zhang, Biosens. Bioelectron., 2011, 26, 4320–4325 CrossRef CAS PubMed.
- B. Albero, C. Sánchez-Brunete and J. L. Tadeo, J. Agric. Food Chem., 2003, 51, 6915–6921 CrossRef CAS PubMed.
- B. J. Sanghavi, G. Hirsch, S. P. Karna and A. K. Srivastava, Anal. Chim. Acta, 2012, 735, 37–45 CrossRef CAS PubMed.
- H. Liang, X. Miao and J. Gong, Electrochem. Commun., 2012, 20, 149–152 CrossRef CAS PubMed.
- C. Li, Z. Wang and G. Zhan, Colloids Surf., B, 2011, 82, 40–45 CrossRef CAS PubMed.
| This journal is © The Royal Society of Chemistry 2014 |

