Carbon nanotube and graphene oxide directed electrochemical synthesis of silver dendrites

Li Fua, Guosong Laib, Peter J. Mahona, James Wangc, Deming Zhud, Baohua Jiae, François Malherbea and Aimin Yu*ab
aDepartment of Chemistry and Biotechnology, Faculty of Science, Engineering and Technology, Swinburne University of Technology, Hawthorn, VIC, Australia. E-mail: aiminyu@swin.edu.au
bCollege of Chemical and Environmental Engineering, Hubei Normal University, China
cDepartment of Mechanical and Product Design Engineering, Faculty of Science, Engineering and Technology, Swinburne University of Technology, Hawthorn, VIC, Australia
dFaculty of Science, Engineering and Technology, Swinburne University of Technology, Hawthorn, VIC, Australia
eCentre for Micro-Photonics and CUDOS, Faculty of Science, Engineering and Technology, Swinburne University of Technology, Hawthorn, VIC, Australia

Received 24th June 2014 , Accepted 12th August 2014

First published on 13th August 2014


Abstract

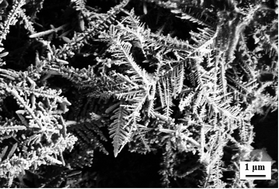
We report a simple one-step electro-deposition method for the synthesis of silver dendritic structures with the aid of graphene oxide (GO) modified multi-walled carbon nanotubes (MWCNTs) which are dispersed in an AgNO3 solution. Scanning electron microscopy indicated that the formed silver material had a well-defined dendritic structure and XRD confirmed that the silver was in a cubic phase. UV-vis spectroscopy indicated the presence of GO in the silver dendrites which was electrochemically reduced during the silver electro-deposition process. It was found that the presence of MWCNT is crucial for the formation of the dendrite structure of the deposited Ag. The concentration of AgNO3 and the electrochemical deposition cycles also had significant effects on the shape of the formed nanostructures. A possible growth mechanism for the Ag dendrites was proposed based on the experimental results. In addition, the electro-catalytic properties of the as-prepared silver dendrites towards the reduction of hydrogen peroxide were investigated by cyclic voltammetry. The results showed that Ag dendrites prepared in the presence of MWCNT and GO had a higher electro-catalytic activity than silver materials prepared with only either MWCNT or GO.


1. Introduction

Silver nanostructures have been the subject of intensive research due to their conspicuous catalytic, antibacterial and optical properties.1–3 Researchers have found that these properties are affected by the size and shape of the Ag nanoparticles. So far, various shapes of Ag such as cubes,4,5 wires,6 disks,7 triangles,8 rods,5 prisms,9 lumps10 and dendrites11,12 have been successfully synthesized. Among them, Ag dendrites are one of the supermolecular structures that have attracted much attention due to their fascinating hierarchical structures and intriguing applications, such as surface-enhanced Raman scattering,13 chemical detection12,14 and catalysis.15 The morphology of Ag crystals is mainly affected by the distance of the thermodynamic equilibrium during the crystal formation. The Ag dendrites, are usually formed under non-equilibrium growth conditions, such as increasing the driving force for crystallization. The template method is often used for better controlling the size and shape of the dendrites by adjusting the driving forces and confining the growth directions. For example, Wei and co-workers16 prepared Ag dendrites by reducing AgNO3 with ethylene glycol in the presence of silicon plate etched with HF. Xie et al.17 synthesized Ag dendrites using Raney nickel as the template. The formation of the interspaces in the skeleton of Raney nickel leads to the fractals of Ag. Alternatively, some template free methods have also been reported to be effective and the non-equilibrium regime was created by the balance of diffusion and reaction rates.14 For example, Yang et al. synthesized Ag dendrites using finely dispersed Zn microparticles as reducing agent without the use of any templates or surfactants.14 Naka et al. reported that Ag dendrites could be synthesized by reducing Ag ions using tetrathiafulvalene in acetonitrile.18

Other techniques such as electro-deposition,19 photochemistry20 and sonoelectrochemistry21 are also commonly used to produce silver dendrites. Among them, electro-deposition has the advantage of better controlling the reduction and growth kinetics. The method generally involves manipulating the electrode potential that allows the reduction of Ag under conditions far from thermodynamic equilibrium.22 The morphology of the Ag nanostructures can be tuned by varying the concentration of Ag+ ion, the reaction time, the applied potential and by the addition of a suitable surfactant.19,21,23 However, the electro-deposition parameters need to be carefully controlled to synthesize desired nanostructures. An attempt to combine electro-deposition with the template method is expected to generate well-defined Ag dendrites as electro-deposition could supply the non-equilibrium condition while the template could control the shape of hierarchical crystallization.

Ag nanostructures, in particular dendrites, exhibit excellent electro-catalytic behaviour towards the redox reaction of H2O2.12 In addition, the incorporation of carbon nanotubes (CNT) or reduced graphene oxides (rGO) to Ag nanostructures could further strengthen this property. For example, our recent work demonstrated that Ag nanoparticle (NP) and multi-walled carbon nanotube (MWCNT) nanocomposite films prepared using a layer-by-layer self-assembly technique could enhance the electro-chemical activity of H2O2.24 A highly sensitive H2O2 sensor was reported by Li and co-workers which was based on Ag/rGO nanocomposite modified glassy carbon electrodes.25 Qiu et al.26 reported a simple method to incorporate CNT with GO by dispersing CNT in a GO solution. GO attached to CNT through π → π* stacking interactions between the delocalised electrons in both aromatic regions of GO sheets and CNTs.

In this paper, we report the preparation of Ag dendrites using a simple one-step electro-deposition method from a mixed solution of AgNO3 and graphene oxide (GO) wrapped MWCNT. GO aids the aqueous dispersion of MWCNT and provides negative sites for the nucleation of Ag nanoparticles. The experimental conditions such as the composition of the solution and the electro-deposition parameters on the formation of Ag dendrites are thoroughly investigated and a probable mechanism is proposed on the basis of the results obtained. Finally, the electro-catalytic behaviour of Ag dendrites and their application as a non-enzymatic H2O2 sensor is also studied.

2. Experimental

2.1 Chemicals and materials

Graphene oxide powder was purchased from JCNANO, Inc. (China). Silver nitrate (AgNO3), poly(sodium 4-styrene-sulfonate) (PSS, Mw = 70[thin space (1/6-em)]000), uric acid (99%) (UA), L-ascorbic acid (99%) (AA) and 3-hydroxytyramine hydrochloride (DA) were purchased from Sigma-Aldrich. Multi-walled carbon nanotubes (purity ≥ 95%, diameters 40–60 nm, length 1–2 μm) were purchased from Shenzhen Nanotech Port Co. Ltd (China). All other chemicals were analytical grade reagents and were used without further purification. ITO coated glasses (Rest = 10 ± 2 Ω) were purchased from Delta Technologies (USA). Phosphate buffer solution (PBS) was prepared by mixing 0.2 M KH2PO4 and K2HPO4 solution to appropriate pH. Milli-Q water (18.2 MΩ cm) was used throughout the experiments.

2.2 Electrodeposition of silver nanostructures

Four milligrams of GO was ultrasonically dispersed into 10 mL water for 1 h. Then 2.5 mg MWCNT was added to the dispersion and sonicated for 3 h until a homogeneous black suspension was achieved. The resulting GO wrapped MWCNT (defined as MWCNT–GO) dispersion was found to be stable for several months without obvious precipitation. The electro-deposition solutions were prepared by mixing the MWCNT–GO dispersions with freshly prepared AgNO3 (50 mM) solutions at various ratios. Cyclic voltammetry (CHI430A, CH Instruments, Austin, TX, USA) was employed for the electrodeposition of Ag on ITO electrodes (geometric area: 1.6 cm2) using a three electrode system. A platinum wire was used as the auxiliary electrode and an Ag/AgCl (3 M KCl) as the reference electrode. The cyclic voltammetry scan was performed between 0 to −1.6 V at a scan rate of 20 mV s−1. After deposition, the ITO was washed twice with Milli-Q water. The resulting silver materials were denoted as MWCNT–GO/Ag-1, MWCNT–GO/Ag-2 and MWCNT–GO/Ag-3 when the MWCNT–GO-to-AgNO3 volume ratios of 12[thin space (1/6-em)]:[thin space (1/6-em)]1 (3.8 mM AgNO3), 8[thin space (1/6-em)]:[thin space (1/6-em)]1 (5.5 mM AgNO3) and 4[thin space (1/6-em)]:[thin space (1/6-em)]1 (10 mM AgNO3), respectively. For comparison, silver samples of GO/Ag and MWCNT/Ag were also prepared by the same procedures from mixed solutions of GO and AgNO3 (volume ratio of 12[thin space (1/6-em)]:[thin space (1/6-em)]1), as well as PSS modified MWCNT (defined as MWCNT–PSS) and AgNO3 (volume ratio of 12[thin space (1/6-em)]:[thin space (1/6-em)]1). The MWCNT–PSS was prepared as previously described.21

2.3 Characterization

The morphology and structure of the prepared samples were characterized using a field emission scanning electron microscope (FESEM, ZEISS SUPRA 40VP, Germany) and an X-ray diffractometer (D8–Advance XRD, Bruker, Germany) with Cu Kα radiation, respectively. The optical characterizations were obtained using UV-vis spectrophotometer (Halo RB-10, Dynamica Pty Ltd, AU) in the wavelength range from 190 to 800 nm. Raman spectroscopy was performed at room temperature using a Raman microprobe (Renishaw inVia, UK) with 514 nm laser light.

3. Results and discussion

3.1 Electrodeposition of Ag nanostructures on ITO electrodes

Cyclic voltammetry is a useful technique to establish the main features of an electro-deposition process. Fig. 1 illustrates the first cyclic voltammetric scan of ITO electrode in a solution containing dispersion of MWCNT–PSS/AgNO3 (curve (a)), GO/AgNO3 (curve (b)) or MWCNT–GO/AgNO3 (curve (c)). The CV profile in MWCNT–PSS/AgNO3 displays a small reduction peak at −0.40 V which is identified to be the reduction of Ag+ to form the metallic Ag.19 The CV profiles in GO/AgNO3 and MWCNT–GO/AgNO3 solutions are similar and display two main reduction peaks. Peak A at −0.75 V is the reduction peak of Ag which has a clear negative shift compared with the reduction peak at curve (a). This higher negative reduction potential is due to a lack of efficient electrolytes in the GO/AgNO3 and MWCNT–GO/AgNO3 solutions. The second peak B observed at curve (b and c) is likely due to the irreversible electrochemical reduction of carbonyl, carboxyl, and hydroxyl functional groups present on the surface of GO.27,28 The fact that this peak does not appear in curve (a) also provides evidence that this reduction process is related to the GO.
image file: c4ra06156j-f1.tif
Fig. 1 The cyclic voltammograms of ITO electrodes in a mixed solution of (a) MWCNT–PSS/AgNO3, (b) GO/AgNO3 and (c) MWCNT–GO/AgNO3.

The formed Ag dendritic structures were then removed from the electrode, dispersed in water and characterized by UV-vis spectroscopy. Curve (a) in Fig. 2 is the spectrum of the GO modified MWCNT dispersion where GO exhibits a peak at 231 nm which corresponds to the π → π* transition of aromatic C[double bond, length as m-dash]C bonds.29 While for the electro-synthesized MWCNT–GO/Ag-1, this peak becomes less obvious and shifts to 257 nm (see Fig. 2 inset for enlarged spectra). This red shift further confirms the formation of reduced GO in the nanocomposite.30 In addition, Ag formation could be evidenced by the single broad absorption peak with a maximum at 380 nm due to its surface plasmon resonance (SPR) absorption. The width and position of the silver SPR band are influenced by the shape and size of the nanocrystals, this highly asymmetric, long tailed peak would indicate the formation of a supermolecular structure.19 The reduction of GO was further confirmed by Raman spectroscopy. As shown in Fig. S1, the spectra of GO and GO/Ag both exhibit two bands at 1600 and 1350 cm−1, corresponding to the graphite (G) and diamondoid (D) bands, respectively. However, the intensity ratio of the D and G peaks (ID/IG) increases from 0.89 to 1.07 after forming GO/Ag composites, indicating the occurrence of the reduction process due to the formation of defect-rich graphite domains.31


image file: c4ra06156j-f2.tif
Fig. 2 UV-vis absorption spectra of aqueous dispersion of (a) MWCNT/GO and (b) MWCNT–GO/Ag-1 prepared by electrodeposition. Insert enlarges the peak shift from 231 nm to 257 nm.

XRD was performed to investigate the crystalline structure of MWCNT–GO/Ag prepared from different ratios of MWCNT–GO and AgNO3. As shown in Fig. 3a, the pristine GO powder has a typical characteristic peak at 11.1° which is assigned to the (001) inter-planar spacing of 0.82 nm.32 However, this peak is not observed for all prepared MWCNT–GO/Ag samples indicating that GO has been successfully reduced after the electro-deposition. This might also be due to the low content of GO in the final composite and the growth of silver dendrites on the reduced GO sheet could prevent the stacking of the graphene layers.28 Meanwhile, the XRD patterns of MWCNT–GO/Ag samples show the presence of cubic phase of Ag (JCPDS file no. 04-0783). The peak at 36.50° indexed as the (111) plane is present with a high intensity, indicating that Ag deposits preferably as the (111) plane under these conditions. With an increasing proportion of AgNO3, peak growths are noticed at 42.67°, 62.92°, 75.90° and 79.83°, which are attributable to (200), (220), (311) and (222) silver face-centered-cube (fcc) crystal diffractions, respectively.


image file: c4ra06156j-f3.tif
Fig. 3 XRD patterns of (a) GO powder, (b) MWCNT–GO/Ag-1, (c) MWCNT–GO/Ag-2, and (d) MWCNT–GO/Ag-3 deposited ITO.

To determine the effect of MWCNT–GO on the formation of Ag dendritic structures, electro-deposition was also carried out in silver solutions containing only GO or MWCNT. The SEM images of the products are shown in Fig. 4. As seen in Fig. 4a, the silver composite prepared in GO and AgNO3 solution has a spherical shape with an average diameter of 50 nm and there is no dendrite structure observed in this sample (inset of Fig. 4a). Some silver dendrite structures are observed in the sample that was prepared from the MWCNT–PSS/AgNO3 solution. However, the dendrites are in the early formation stage and are mixed with spherical Ag nanoparticles (Fig. 4b). Only the MWCNT–GO/Ag sample displays well-defined Ag dendritic structures with a central stem length of approximately 5 μm. According to the literature, dendritic fractals are generally formed under non-equilibrium growth conditions.33 In this case, the high negative potential applied compared with the actual reduction potential of Ag might be considered as a non-equilibrium condition. However, other factors apply too. The fact that the dendritic morphology did not form in the absence of MWCNT indicates that the introduction of MWCNT is a crucial factor for the formation of dendritic structure of Ag. MWCNT has a linear structure and negative surface charges due to the coating of negatively charged PSS or GO which could attract positively charged silver ions and become the nucleation sites for Ag nanoparticles. The electric field gradient near the Ag nanoparticles formed on the entangled MWCNT surface is much larger than that of the ITO surface. Hence, this electric field directs the movement of silver ions to generate the dendritic structure. After the appearance of Ag dendrites, the diffusion-limited-aggregation (DLA) model could well illustrate the fractal growth.34,35 The DLA regime involves cluster growth by the adhesion of a particle to a seed on contact and growing surface after the reduction. In the present study, after the initial reduction of Ag ions, the surface region of ITO is depleted of Ag ions, synchronously increasing the double layer. In addition, without a supporting electrolyte the potential should immediately drop. The Ag ions from the bulk solution migrate to the tip of preformed baby Ag dendrites due to the effect of higher electric field gradient.36 Therefore, the Ag ions continuously attach to the preformed Ag nanoparticles and become the stem part of the dendrites. In addition, the diffusion of Ag ions plays a dominant role in the formation of Ag branches and elongates the existing stems.13 It has been observed that MWCNT–rGO/Ag has much higher extension of Ag dendritic structures than MWCNT/Ag. This could be explained by the fact that the coating of non-conductive PSS on the MWCNT surface decreases the conductivity of MWCNT to some extent, which led to a slow formation of Ag dendrites. Additionally, a portion of the surface functional groups of GO can exist under electrochemical conditions and continually serve as nucleating sites throughout the reduction process. Furthermore, surface defects, such as the kinked structure of MWCNT, can also act as active sites for the nucleation of silver crystals. Therefore, the combination of GO and MWCNT could enhance the formation of Ag dendrites under the overpotential CV scans.


image file: c4ra06156j-f4.tif
Fig. 4 SEM images of the electrodeposited (a) GO/Ag (inset: high magnification image), (b) MWCNT–PSS/Ag, (c) MWCNT–GO/Ag-1, (d) MWCNT–GO/Ag-2, and (e) MWCNT–GO/Ag-3. (f) An EDS spectrum of MWCNT–GO/Ag-1.

Multi-branched structure formation has been reported as a concentration-dependent process.37 In order to investigate the relationship between the growth rate of the dendritic silver and source concentration, we examined the samples prepared from various MWCNT–GO[thin space (1/6-em)]:[thin space (1/6-em)]AgNO3 volume ratios. As observed from the SEM images of Fig. 4c and d, the surface coverage and dendrite density were clearly increased by the elevation of AgNO3 concentration 3.8 to 5.5 mM. In the case of MWCNT–GO/Ag-2, a number of Ag dendrites are seen on the ITO surface, but single Ag particles around the dendrites are still observed, indicating that the dendrites are still undergoing a growth stage. When the Ag concentration was further increased to 10 mM (Fig. 4e), well-defined Ag dendrites are formed and the electrode is fully covered with shapely stems, symmetrical branches and leaves. The dendrites form a complex network structure due to overlapping, which significantly increases the active surface area of the electrode. In addition, EDS results clearly displayed the dominant peaks of C and Ag, this further confirms that the products are mainly composed of metallic Ag, MWCNT and reduced GO, while other signals are contributed by the ITO substrate.

To further investigate the correlation between the reduction time and film morphology, Fig. 5 displays SEM images of the MWCNT–GO/Ag-3 formed by performing 1 to 4 cycles of CV scan. It is found that only a few Ag dendrites are formed during the first deposition cycle and the rest are clearly undergoing a growth stage (Fig. 5a). The dendrite coverage is estimated to be 25%, with most of the ITO surface still covered with clustered Ag. After 2 cycles, most of the rudimentary dendrites have evolved into a well-defined stem, branch and leaf structures as well as an increased surface coverage (Fig. 5b). In addition, Ag dendrites start to overlap with each other resulting in a complicated network structure. Increasing the deposition cycles further increases the surface coverage. Ag dendrites fully cover the ITO surface and form an intricate network structure after at least four deposition cycles.


image file: c4ra06156j-f5.tif
Fig. 5 SEM images of the electrodeposited MWCNT–GO/Ag-3 prepared by performing (a) 1 cycle, (b) 2 cycles, (c) 3 cycles and (d) 4 cycles of CV scan.

3.2 Electro-catalytic behaviour of Ag dendrites

The electrochemical properties of the prepared Ag dendrites were examined by monitoring their electro-catalytic behaviour in the decomposition of H2O2. The electrochemical tests were conducted in an oxygen free 1 mM H2O2 solution. Fig. 6b–d show the CV profiles of MWCNT–PSS/Ag, GO/Ag and MWCNT–GO/Ag-1 deposited electrodes in the H2O2 solution. All three silver composites give a distinguishing reduction peak for H2O2 compared with the bare ITO electrode (curve (a)). The catalytic current of the MWCNT–GO/Ag-1 is clearly larger than those of MWCNT–PSS/Ag and GO/Ag electrodes. This can be attributed to the higher specific surface area of MWCNT–GO/Ag electrode due to the formation of network structure of silver dendrites, as seen in the SEM images before. This increase in surface area provides more active sites for the proper contact with H2O2, which leads to a higher catalytic current. In contrast, the MWCNT–GO/Ag-1 exhibits little electrochemical response in the absence of H2O2 (inset, curve g). We further compare the catalytic activity of MWCNT–GO/Ag prepared with different ratios of AgNO3 and the results are shown in Fig. 6 curves d–f. As it can be observed, MWCNT–GO/Ag-3 exhibits the best catalytic performance which is evidenced by the maximum current response (curve f).
image file: c4ra06156j-f6.tif
Fig. 6 Cyclic voltammograms of different electrodes in pH 7 PBS containing 1.0 mM H2O2: (a) bare ITO, (b) MWCNT–PSS/Ag, (c) GO/Ag, (d) MWCNT–GO/Ag-1, (e) MWCNT–GO/Ag-2 and (f) MWCNT–GO/Ag-3. The inset compares the cyclic voltammograms of MWCNT–GO/Ag (g) before and (d) after addition of 1.0 mM H2O2.

Furthermore, the pH influence on the electro-catalysis of H2O2 was investigated. Fig. 7a shows the current response of MWCNT–GO/Ag-3 electrode to 1 mM H2O2 at different pH values. The electrode exhibits a maximum response at pH 7.0. Consequently, the PBS with pH value of 7.0 was chosen as the optimum value in this study. Additionally, the effects of scan rate on the sensor in the range from 30 to 170 mV s−1 were also examined. As shown in Fig. 7b, the reduction peak current exhibits a linear increase with the square root of the scan rate. This result indicates that the overall electrochemical process is diffusion-controlled.


image file: c4ra06156j-f7.tif
Fig. 7 (a) The effect of pH on the current response of MWCNT–GO/Ag-3 to 1 mM H2O2. (b) Cyclic voltammograms for MWCNT–GO/Ag-3 in the presence of 1 mM H2O2 at scan rates from 30 to 170 mV s−1.

In practical applications, the presence of electro-active species could potentially interrupt the sensor sensitivity and response. Fig. 8 shows the current responses of MWCNT–GO/Ag-3 upon the addition of UA, AA and DA. Negligible current response was observed, suggesting that the MWCNT–GO/Ag-3 exhibits a great selectivity for electrochemical measurement of H2O2.


image file: c4ra06156j-f8.tif
Fig. 8 The current response of the MWCNT–GO/Ag-3 electrode to the addition of 0.5 mM H2O2, 0.5 mM UA, 0.5 mM DA and 0.5 mM AA.

4. Conclusions

In summary, we have demonstrated a simple one-step electrochemical deposition method for the synthesis of Ag dendritic structures. Cyclic voltammetry was used to monitor the electro-deposition process from a GO modified MWCNT dispersion containing different concentrations of silver ions. A nanocomposite of silver, GO and MWCNT was deposited on the ITO electrode when a potential range between 0 and −1.6 V was scanned. It was found that GO was reduced during the electro-deposition process which was further evidenced by UV-vis spectroscopy. XRD confirmed that the formed silver structure was in a cubic phase while SEM analysis indicated the dendritic silver structures. The presence of MWCNT was found to be crucial in the formation of dendritic structure, which is probably due to its unique shape and negative surface charge. In addition, the dendrite formation was also concentration and reaction time dependent process, with the initially formed reduced GO facilitating the speed of silver formation. The MWCNT–GO/Ag dendrite modified electrode exhibited excellent catalytic performance towards the reduction of H2O2. This study essentially provides a simple, one step and eco-friendly approach for the fabrication of Ag dendrites, which could serve as a non-enzymatic H2O2 sensor.

Acknowledgements

This work was partially supported by the National Natural Science Foundation of China (Grant number: 21075030 and 21475033). L Fu acknowledges the Swinburne University Postgraduate Research Award (SUPRA) for supporting this work.

Notes and references

  1. J. Yong, Q. Wang, H. J. Ng, F. Malherbe and A. Yu, Nanosci. Nanotechnol. Lett., 2013, 5, 1293–1297 CrossRef CAS PubMed.
  2. M. Nasrollahzadeh, F. Babaei, S. Mohammad Sajadi and A. Ehsani, Spectrochim. Acta, Part A, 2014, 132, 423–429 CrossRef CAS PubMed.
  3. Y. Ma, H. Niu, X. Zhang and Y. Cai, Analyst, 2011, 136, 4192–4196 RSC.
  4. M. L. Personick, M. R. Langille, J. Zhang, J. Wu, S. Li and C. A. Mirkin, Small, 2013, 9, 1947–1953 CrossRef CAS PubMed.
  5. R. Varshney, S. Bhadauria and M. S. Gaur, Adv. Mater. Lett., 2010, 1, 232–237 CrossRef PubMed.
  6. S. Tang, S. Vongehr, N. Wan and X. Meng, Mater. Chem. Phys., 2013, 142, 17–26 CrossRef CAS.
  7. M. Maillard, P. Huang and L. Brus, Nano Lett., 2003, 3, 1611–1615 CrossRef CAS.
  8. S. Chen and D. L. Carroll, Nano Lett., 2002, 2, 1003–1007 CrossRef CAS.
  9. R. Jin, Y. Cao, C. A. Mirkin, K. L. Kelly, G. C. Schatz and J. G. Zheng, Science, 2001, 294, 1901–1903 CrossRef CAS PubMed.
  10. X. Chen, B. Jia, J. K. Saha, B. Cai, N. Stokes, Q. Qiao, Y. Wang, Z. Shi and M. Gu, Nano Lett., 2012, 12, 2187–2192 CrossRef CAS PubMed.
  11. T. Qiu, X. L. Wu, Y. F. Mei, P. K. Chu and G. G. Siu, Appl. Phys. A: Mater. Sci. Process., 2005, 81, 669–671 CrossRef CAS PubMed.
  12. X. Qin, H. Wang, X. Wang, Z. Miao, Y. Fang, Q. Chen and X. Shao, Electrochim. Acta, 2011, 56, 3170–3174 CrossRef CAS PubMed.
  13. H. Xun, G. Z. Wang, Y. Wang, W. Zhu and X. S. Shen, Chin. J. Chem. Phys., 2010, 23, 596–602 CrossRef.
  14. X. Wen, Y.-T. Xie, W. C. Mak, K. Y. Cheung, X.-Y. Li, R. Renneberg and S. Yang, Langmuir, 2006, 22, 4836–4842 CrossRef CAS PubMed.
  15. M. H. Rashid and T. K. Mandal, J. Phys. Chem. C, 2007, 111, 16750–16760 CAS.
  16. Y. Wei, Y. Chen, L. Ye and P. Chang, Mater. Res. Bull., 2011, 46, 929–936 CrossRef CAS PubMed.
  17. J. P. Xiao, Y. Xie, R. Tang, M. Chen and X. B. Tian, Adv. Mater., 2001, 13, 1887–1891 CrossRef CAS.
  18. X. Wang, K. Naka, H. Itoh, S. Park and Y. Chujo, Chem. Commun., 2002, 1300–1301 RSC.
  19. S. Kaniyankandy, J. Nuwad, C. Thinaharan, G. K. Dey and C. G. S. Pillai, Nanotechnology, 2007, 18, 125610 CrossRef.
  20. Y. Zhou, S. H. Yu, C. Y. Wang, X. G. Li, Y. R. Zhu and Z. Y. Chen, Adv. Mater., 1999, 11, 850–852 CrossRef CAS.
  21. S. Tang, X. Meng, H. Lu and S. Zhu, Mater. Chem. Phys., 2009, 116, 464–468 CrossRef CAS PubMed.
  22. G. M. Oliveira and I. A. Carlos, J. Appl. Electrochem., 2009, 39, 1217–1227 CrossRef CAS PubMed.
  23. A. Moradi Golsheikh, N. M. Huang, H. N. Lim, R. Zakaria and C.-Y. Yin, Carbon, 2013, 62, 405–412 CrossRef CAS PubMed.
  24. A. Yu, Q. Wang, J. Yong, P. J. Mahon, F. Malherbe, F. Wang, H. Zhang and J. Wang, Electrochim. Acta, 2012, 74, 111–116 CrossRef CAS PubMed.
  25. Q. Li, X. Qin, Y. Luo, W. Lu, G. Chang, A. M. Asiri, A. O. Al-Youbi and X. Sun, Electrochim. Acta, 2012, 83, 283–287 CrossRef CAS PubMed.
  26. L. Qiu, X. Yang, X. Gou, W. Yang, Z. F. Ma, G. G. Wallace and D. Li, Chem.–Eur. J., 2010, 16, 10653–10658 CrossRef CAS PubMed.
  27. M. A. Raj and S. A. John, J. Phys. Chem. C, 2013, 117, 4326–4335 CAS.
  28. Y. Shao, J. Wang, M. Engelhard, C. Wang and Y. Lin, J. Mater. Chem., 2010, 20, 743 RSC.
  29. J. I. Paredes, S. Villar-Rodil, A. Martínez-Alonso and J. M. D. Tascón, Langmuir, 2008, 24, 10560–10564 CrossRef CAS PubMed.
  30. Y. Zhou, Q. Bao, L. A. L. Tang, Y. Zhong and K. P. Loh, Chem. Mater., 2009, 21, 2950–2956 CrossRef CAS.
  31. J. H. Yang, J. H. Zheng, H. J. Zhai and L. L. Yang, Cryst. Res. Technol., 2009, 44, 87–91 CrossRef CAS PubMed.
  32. T. Nakajima, A. Mabuchi and R. Hagiwara, Carbon, 1988, 26, 357–361 CrossRef.
  33. X. K. Meng, S. C. Tang and S. Vongehr, J. Mater. Sci. Technol., 2010, 26, 487–522 CAS.
  34. T. A. Witten Jr and L. M. Sander, Phys. Rev. Lett., 1981, 47, 1400–1403 CrossRef.
  35. E. Ben-Jacob and P. Garik, Nature, 1990, 343, 523–530 CrossRef.
  36. N. Abbasi, P. Shahbazi and A. Kiani, J. Mater. Chem. A, 2013, 1, 9966 CAS.
  37. P. Zhou, Z. Dai, M. Fang, X. Huang, J. Bao and J. Gong, J. Phys. Chem. C, 2007, 111, 12609–12616 CAS.

Footnote

Electronic supplementary information (ESI) available. See DOI: 10.1039/c4ra06156j

This journal is © The Royal Society of Chemistry 2014