Ferromagnetism in cubic InN:Mn nanocrystals induced by surface Mn atoms

Xiuqing Meng*a, Zhanghui Chenb, Qinglin Xiac, Zhuo Chend, Fengmin Wua and Jingbo Liab
aResearch Center for Light Emitting Diodes (LED), Zhejiang Normal University, Jinhua, Zhejiang Province 321004, China. E-mail: xqmeng@semi.ac.cn; Fax: +86-579-82297913; Tel: +86-579-82297911
bState Key Laboratory for Superlattices and Microstructures, Institute of Semiconductors, Chinese Academy of Sciences, Beijing 100083, China
cDepartment of Physics, Central South Universit, Changsha 410083, China
dDepartment of Physics, Beijing Institute of Technology, Beijing 100081, China

Received 23rd June 2014 , Accepted 8th September 2014

First published on 8th September 2014


Abstract

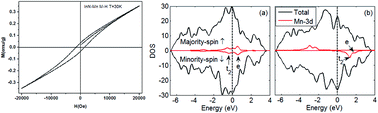
Cubic Mn-doped InN magnetic nanocrystals are prepared by nitriding In2O3:Mn nanocrystals. Structural and elemental analyses indicate that Mn is successfully incorporated into InN nanocrystals with no secondary phase or clusters. Ferromagnetism (FM) is observed in the InN:Mn nanocrystals at Tc = 50 K. Results reveal that FM in the nanocrystals originates from surface Mn atoms instead of core counterparts that substitute In atoms. The experimental observations are consistent with theoretical calculations.


1. Introduction

Diluted magnetic semiconductors have elicited great interest since the first theoretical prediction of room-temperature ferromagnetism (FM) in magnetically doped III–V nitrides.1 Several groups have reported FM above room temperature in GaN films doped with various magnetic ions from transition metals prepared using metal–organic vapor-phase epitaxy and plasma-assisted molecular beam epitaxy.2–4 InN possesses a high hall mobility5 and high carrier drift velocity6 in contrast to other III–V compounds besides the smallest effective mass and the least temperature dependent band gap energy.7 The low spin-orbit coupling strength of InN (0.003 eV compared with 0.34 eV for GaAs) indicates its long duration and electron spin diffusion length, which can be potentially applied in spintronics.8 Room temperature ferromagnetism InN can theoretically be obtained by techniques such as doping.9 Several studies have used Cr doping to yield FM in InN,10–12 however Mn-doped InN only exhibits magnetic ordering.12 To the best of our knowledge, FM in Mn-doped InN has not been observed. In this report, we produced cubic Mn-doped InN nanocrystals by nitriding In2O3:Mn and gained FM properties up to 50 K. The results revealed that FM is induced by holes in surface Mn atoms in cubic InN:Mn.

2. Experimental details

Mn-doped InN was synthesized by nitridizing In2O3:Mn (Mn molar ratio, 8%) nanocrystals obtained with a sol–gel method similar to that reported by Chen et al.13 During the preparation of In2O3:Mn nanocrystals, 0.01 mol In3+–Mn2+ was dissolved in 30 ml sodium oleate under vigorous stirring at 70 °C for 4 h to form In–Mn–oleate complex; then 0.5 mmol above gained In–Mn–oleate complex was taken out and added to a mixture of myristic acid (1.5 mmol) and 1-octadecene (3 ml). The resultant solution was kept at 290 °C for 30 min after injecting addition of decyl alcohol solution upon reaching the reaction temperature. The as-synthesized In2O3:Mn nanocrystals were subsequently nitrided under NH3 flow at 600 °C for 5 h to form InN:Mn.

Structural and morphological analyses were performed by X-ray diffractometry (XRD) using Cu Kα irradiation on an 800 W Philips 1830 powder diffractometer. High-resolution transmission electron microscopy (HRTEM) measurements were performed on a Hitachi S-4800 microscope at an accelerating voltage of 15 kV. To verify the Mn elements in the products, X-ray photoelectron spectroscopy (XPS) was carried out on a VGESCALAB MK II instrument, in which Mg KR X-ray ( = 1253.6 eV) was used as the emission source. The energy scale of the spectrometer was calibrated with pure C (Eb = 284.6 eV) samples; the pressure in the XPS analysis chamber was 6.2 × 10⁻⁷ Pa. Magnetization measurements were performed using a superconducting quantum interference device (SQUID) system (Quantum Design).

3. Results and discussions

Fig. 1 shows the XRD patterns of the Mn-doped samples before and after nitridation. The observed diffraction peaks of the sample prior to nitridation can be indexed based on the XRD patterns of unit cell of a cubic In2O3 (JCPDS no. 71-2195)14,15 with no secondary phases obtained [Fig. 1(a)], the lattice parameter a = 10.2 Å is nearly similar to that for In2O3 (a = 10.118 Å).16 No obvious change in the peak position is observed when In3+ is replaced by Mn2+ because the ionic radius of Mn2+ (0.80 Å) is similar to that of In3+ (0.80 or 0.81 Å).17,18 After nitridation, Mn-doped samples can be indexed as cubic InN:Mn [JCPDS no. 88-2365; Fig. 1(b)], we still do not observe secondary phases related to In or In2O3 in the InN:Mn patterns, we speculate that all the In2O3:Mn nanocrystals are converted into InN:Mn. To further confirm this point, HRTEM technique is used to analyze the morphological and structural of the samples. TEM images reveal that In2O3:Mn comprises nanocrystals with size ranging from 10 nm to 20 nm. After nitridation, the samples retained their size throughout the conversion and changed into InN:Mn crystals. The inter-plane distance of 2.5 and 3.5 Å for In2O3:Mn and InN:Mn, respectively, is consistent with the cubic ZB structure of In2O3:Mn and InN:Mn, respectively, corresponding to the (200) (JCPDS no. 71-2195) and (220) (JCPDS no. 88-2365) plane of ZB structured In2O3 and InN. The clear inter-plane distance is indicative of high-quality nanocrystals, as shown in Fig. 2 (a) and (b) and their corresponding inserts, respectively.
image file: c4ra06106c-f1.tif
Fig. 1 XRD patterns of (a) as-synthesized In2O3:Mn and (b) InN:Mn after nitridation.

image file: c4ra06106c-f2.tif
Fig. 2 TEM image of (a) In2O3:Mn and (b) InN:Mn, respectively, the inserts are their respect HRTEM images, which indicate a nanocrystal is single crystal.

As substitution could not be resolved by XRD measurements, incorporation of Mn was further verified by XPS analysis. Fig. 3 reveals that the XPS peaks of the In2O3:Mn, from the figure we can find the spectra of In 3d5/2, O 1s, and Mn 2p3/2 are located at 444.8, 530.5, and 641.9 eV, respectively. The binding energy of In 3d5/2 is nearly identical to that of bulk In2O3 (444.5, 444.6, and 444.7 eV),19–21 which suggests that substitution of Mn for In in In2O3 retains the valence change of In in In2O3. Our analysis suggests that the atomic concentration of Mn is about 5% and remains unchanged after nitridation.


image file: c4ra06106c-f3.tif
Fig. 3 XPS spectra of Mn doped In2O3 nanocrystals. Panels (a)–(c) are the XPS spectra of In, O and Mn, respectively.

Fig. 4 shows the magnetization results of the nanocrystals. The typical magnetization versus temperature (MT) curve of InN:Mn is presented in Fig. 4(a). Field-cooled (FC) and zero-field-cooled (ZFC) magnetization measurements were performed from 5 K to 100 K. FC results were obtained by measuring the magnetic moment of the samples in a magnetic field of 1000 Oe during cooling, while ZFC results were obtained by cooling the sample to 5 K in the zero field and warming it in the same field as that used for FC measurements. The results reveal that FC magnetization exhibits stronger temperature dependence than ZFC magnetization below 40 K. The divergence between the FC and ZFC curves indicates that Mn-doped InN nanocrystals are ferromagnetic in the whole temperature range studied and exhibit a Curie temperature (Tc) of about 50 K, which demonstrates the presence of ferromagnetic ordering. For comparison, we also measure the magnetic properties of In2O3:Mn, the FC and ZFC curves show almost no divergence, indicating no magnetic properties appear in In2O3:Mn, as shown in Fig. 4(b). In the following, we make further examination with the magnetic properties of InN:Mn nanocrystals. Fig. 4(c) shows the magnetization versus applied magnetic field (MH) curve of InN:Mn obtained at 30 K after subtracting the diamagnetic background. The well-defined hysteresis loops suggest that the nanocrystals are ferromagnetic at room temperature. The saturation magnetization (Ms), coercive field (Hc), and remanent magnetization of the nanocrystals are 0.00116 emu, 1360 Oe, and 4.49 × 10⁻⁴ emu, respectively. The absence of secondary phases or clusters in the XRD and HRTEM results confirm that the ferromagnetic signals in the sample are not produced by these phases. Contamination during sample preparation or annealing can also be ruled out because the experimental conditions were precisely controlled. Ohno et al.22 reported that local FM in Mn-doped InAs and GaAs samples originates from holes; that is, holes couple with 3d-state Mn. We used spin-polarized density functional theory (DFT) to investigate the origin of magnetism and small Mn-doped InN QDs. Calculations of the total energy and electronic structure were performed using projector augmented wave formalism and a plane wave basis set of DFT via the Vienna ab initio simulation package. Our calculations are based on the supercells containing 31 In atoms, 32 N atoms and one Mn atoms. It is a 2 × 2 × 2 supercell of 8-atoms InN cube, placed on the center of vacuum. The thickness of surrounded vacuum layers is 15 Ang. Exchange and correlation potentials were treated in the framework of generalized Perdew–Burke–Ernzerbof gradient approximation. The wave functions were expanded in plane waves up to a cutoff of 400 eV, and the convergence precision of the total energy was set to <1 meV. A Gamma point mesh was adopted to calculate the total energy and density of states as well as the sum of charge densities over a Brillouin zone.


image file: c4ra06106c-f4.tif
Fig. 4 Typical magnetization versus temperature (MT) curve of (a) InN:Mn and (b) In2O3:Mn, and (c) the magnetization versus applied magnetic field (MH) curve of InN:Mn measured at 30 K after subtracting the diamagnetic background.

We consider two types of doping configurations: (a) a Mn atom substitutes an In atom at the core of QD and (b) a Mn atom substitutes an In atom at the surface of QD. Fig. 5 shows the total density of states (DOS) and local DOS of Mn 3d electrons. No spin is polarized near the Fermi level, and a minor splitting exists at about −3.5 eV, which is lower than the Fermi level; hence, an additional magnetic moment of 0.08 u is obtained [Fig. 5(a)]. By contrast, Mn 3d exhibits strong splitting [Fig. 5(b)] with an additional magnetic moment of 2.56 u. This result indicates that the magnetism observed originates from surface Mn atoms rather than core counterparts.


image file: c4ra06106c-f5.tif
Fig. 5 Total density of states (DOS) and local DOS of Mn 3d electrons for Mn doping in the InN QD. (a) A Mn atom substitutes an In atom at the core of QD and (b) a Mn atom substitutes an In atom at the surface of QD. The Fermi level is set to zero.

4. Conclusions

In conclusion, marked FM behavior was observed in cubic InN:Mn nanocrystals; this FM originates from surface Mn atoms doped in the InN nanocrystals. Contributions from other impurity-related phases may be excluded because no secondary phases or clusters were detected during structural examination. The results obtained in the present work present potential applications for InN-based spin-electronic devices and help determine new mechanisms for elucidating the origins of FM in InN nanostructures.

Acknowledgements

This work is supported by the National Natural Science Foundation of China (Grant no. 11104250, 61274099, 61204107), the Science Technology Department of Zhejiang Province (Grant no. 2012C21007), Zhejiang Provincial Science and Technology Key Innovation Team (2011R50012) and Zhejiang Provincial Key Laboratory (No. 2013E10022).

References

  1. T. Dietl, H. Ohno, F. Matsukura, J. Cibert and D. Ferrand, Science, 2000, 287, 1019–1022 CrossRef CAS.
  2. M. L. Reed, N. A. El-Masry, H. H. Stadelmaier, M. K. Ritums, M. J. Reed, C. A. Parker, J. C. Roberts and S. M. Bedair, Appl. Phys. Lett., 2001, 79, 3473–3475 CrossRef CAS PubMed.
  3. S. Dhar, O. Brandt, A. Trampert, L. Däweritz, K. J. Friedland, K. H. Ploog, J. Keller, B. Beschoten and G. Güntherodt, Appl. Phys. Lett., 2003, 82, 2077–2079 CrossRef CAS PubMed.
  4. G. T. Thaler, M. E. Overberg, B. Gila, R. Frazier, C. R. Abernathy, S. J. Pearton, J. S. Lee, S. Y. Lee, Y. D. Park, Z. G. Khim, J. Kim and F. Ren, Appl. Phys. Lett., 2002, 80, 3964–3966 CrossRef CAS PubMed.
  5. Q. X. Guo, N. Nisho, H. Ogawa and A. Yoshida, Jpn. J. Appl. Phys., Part 2, 1999, 38, L490–L492 CAS.
  6. B. E. Foutz, S. K. O'Leary, M. S. Shur and L. F. Eastman, J. Appl. Phys., 1999, 85, 7727–7734 CrossRef CAS PubMed.
  7. Q. Y. Xie, M. Q. Gu, L. Huang, F. M. Zhang and X. S. Wu, AIP Adv., 2012, 2, 012185(1–6) Search PubMed.
  8. G. A. Prinz, Science, 1998, 282, 1660–1661 CrossRef CAS.
  9. R. Rajaram, A. Ney, G. Solomon and J. S. Harris, Appl. Phys. Lett., 2005, 87, 172511–172513 CrossRef PubMed.
  10. A. Belabbes, A. Zaoui and M. Ferhat, Appl. Phys. Lett., 2010, 97, 242509–242511 CrossRef PubMed.
  11. A. Ney, R. Rajaram, E. Arenholz, J. S. Harris Jr, M. Samant, R. F. C. Farrow and S. S. P. Parkin, J. Magn. Magn. Mater., 2006, 300, 7–11 CrossRef CAS PubMed.
  12. A. Ney, R. Rajaram, R. F. C. Farrow, J. S. Harris, Jr and S. S. P. Parkin, J. Supercond. Novel Magn., 2005, 18, 41–46 CrossRef CAS PubMed.
  13. Z. Chen, Y. N. Li, C. B. Cao, S. R. Zhao, S. Fathololoumi, Z. T. Mi and X. Y. Xu, J. Am. Chem. Soc., 2012, 134, 780–783 CrossRef CAS PubMed.
  14. N. Nadaud, N. Lequeux, M. Nanot, J. Jove and T. Roisnel, J. Solid State Chem., 1998, 135, 140–148 CrossRef CAS.
  15. G. Peleckis, X. L. Wang and S. X. Dou, Appl. Phys. Lett., 2006, 88, 132507–132509 CrossRef PubMed.
  16. H. E. Swanson and E. Tatge, Natl. Bur. Stand. Circ., 1955, 539, 26 Search PubMed.
  17. A. Punnoose, J. Hays, V. Gopal and V. Shutthanandah, Appl. Phys. Lett., 2004, 85, 1559–1561 CrossRef CAS PubMed.
  18. J. Hays, A. Punnoose, R. Baldner, M. H. Engelhard, J. Peloquin and K. M. Reddy, Phys. Rev. B: Condens. Matter Mater. Phys., 2003, 72, 075203(1–9) Search PubMed.
  19. P. A. Bertrand, J. Vac. Sci. Technol., 1981, 18, 28–33 CrossRef CAS.
  20. L. L. Kazmerski, O. Jamjoum, P. J. Ireland, S. K. Deb, R. A. Mickelsen and W. Chen, J. Vac. Sci. Technol., 1981, 19, 467–471 CrossRef CAS.
  21. P. Sen, M. S. Hegde and C. N. Rao, Appl. Surf. Sci., 1982, 10, 63–74 CrossRef CAS.
  22. H. Ohno, Phys. Rev. Lett., 1992, 68, 2664–2667 CrossRef CAS; H. Ohno, Appl. Phys. Lett., 1996, 69, 363–365 CrossRef PubMed.

This journal is © The Royal Society of Chemistry 2014
Click here to see how this site uses Cookies. View our privacy policy here.