Arabinda Mallick*a,
Tapas Majumdarb,
Basudeb Haldar*c and
Ujjal Kanti Royd
aDepartment of Chemistry, Kashipur Michael Madhusudan Mahavidyalaya, Purulia, West Bengal -723132, India. E-mail: ampcju@yahoo.co.in
bDepartment of Chemistry, University of Kalyani, Nadia, West Bengal -741235, India
cDepartment of Chemistry, Vivekananda Mahavidyalaya, Sripally, Burdwan, West Bengal -713103, India. E-mail: pcbhaldar@yahoo.co.in
dDepartment of Chemistry, Desh Bandhu Mahavidyalaya, Chittaranjan, West Bengal -713331, India
First published on 7th August 2014
Binding interactions of a newly developed drug molecule namely 3,3′-bis(indolyl)-4-chlorophenylmethane (BICPM) with α-cyclodextrin have been studied using steady state and picosecond time resolved fluorometric techniques. A significant increase both in steady state anisotropy (r) and in the average rotational correlation time in the CD environments compared with that in a pure aqueous phase indicates that the rotational dynamics of BICPM are substantially slowed down upon binding with the α-cyclodextrin. Critical spectral analysis reveals the formation of two types of inclusion complex between the fluorophore and α-cyclodextrin (α-CD) depending on the relative population of the two. The stoichiometries and association constants of these complexes have been determined by monitoring the fluorescence data. Hydrodynamic radii of the formed 1:
2 probe-α-cyclodextrin supramolecular complex have also been determined. From the determined hydrodynamic radii and from molecular docking analysis it is argued that probably two CD cavity shields the indole moiety in a face-to-face manner.
Numerous bis(indolyl) methanes and their derivates, a new kind of aza-heterocycles, have been isolated from various terrestrial and marine natural sources. These natural products have novel structures and exhibit important biological activities.23–25 Therefore, there is a great interest in the synthesis of the bisindole compounds, occurring naturally or not. It has also been exploited as an efficient fluorosensor for sensing essential trace metals. The fluorophore, BICPM, used in the present experiment belongs to the group of such bioactive bisindole family and serving as a proper model drug. The indole nucleus seems to be a promising basis for design and synthesis of new derivatives able to fight against many health disorders including the nervous system. Very recently Yan et al. reported the potent activity of indoloquinones against the human pancreatic cancer.25 Since most of the drug molecules are hydrophobic in character, they always look for a hydrophobic shelter. α-Cyclodextrin (α-CD) bears the responsibility in the present case. Complexation of such biologically potent molecules with different biomimetic environments attracts interest of the researchers because of the molecule's ability to achieve specific chemical efficiency as a result of organization in the reaction media. An important parameter for the understanding of such a complexation process is the determination of the stoichiometry and the binding constant. Particular attention has been given on the probe-CD stoichiometries and the binding constants.
Shimadzu U3500 absorption spectrophotometer was used for the absorption spectral studies. Fluorescence lifetimes were determined from time resolved intensity decay by the method of time correlated single-photon counting (TCSPC).27 The pulse duration of the excitation source response is 40 ps. The decay curves were analyzed using IBH decay analysis software. Goodness of fits was judged by the visual inspection of the residuals of the fitted function to the data. The lifetimes were measured in degassed solution of the probe at ambient temperature. The steady state fluorescence anisotropy was performed with a Hitachi spectrofluorimeter F-4010 model. Excitation and emission bandwidths were 5 nm. Steady state anisotropy, r, was defined by:
r = (IVV − GIVH)/(IVV + 2GIVH) | (1) |
G = IHV/IHH | (2) |
The terms I refer to parameters similar to those mentioned above for the horizontal position of the excitation polarizer where G is the correction factor for the detector sensitivity to the polarization detection of the emission.27 Average florescence lifetimes 〈τ〉 for bi-exponential iterative fitting were calculated from the decay times and the pre-exponential factors using the following relation.
〈τ〉 = a1τ1 + a2τ2 | (3) |
The ground state structure of the BICPM molecule has been optimized utilizing density functional theory (DFT) combining hybrid B3LYP functional and 6-311+G basis set in acetonitrile as solvent using the Gaussian 09 programme suite.28 Conductor polarizable continuum model (CPCM) has been used to incorporate the solvent effect in ground state geometry optimization.
The crystal structures of α-CD has been obtained from protein complexes (pdb id: 2ZYM) available in Protein Data Bank (PDB). The α-CD has been then extracted and added all the hydrogens and Gasteiger charges to prepare it for docking. The PDB structure of BICPM has been derived from the optimized structure. BICPM has been considered as a ligand and α-CD as a receptor for docking studies. The molecular docking has been carried out applying the Lamarckian Genetic Algorithm (LGA), inculcated in the docking program Auto Dock 4.2.29 The CD has been laid over a three dimensional grid box (60 × 54 × 48) Å3 with 0.375 Å spacing. The output from Auto Dock has been analyzed using PyMOL software.30
![]() | ||
Fig. 1 (a) Emission spectra of BICPM as a function of α-cyclodextrin concentration (λexc = 295 nm) (b) variation of fluorescence intensity with α-cyclodextrin concentration. [BICPM] = 5.65 × 10⁻⁶ M. |
Gradual addition of α-cyclodextrin to the aqueous solution of BICPM leads to the significant decrease in emission intensity along with the bathochromic shift in the emission maxima. Similar type of observation was also noticed by Kondo et al.31
At a particular concentration of CD, the probe exists in two forms (free and bound), and the emission maximum is, though presumably, an average of the band maxima for the probe in water and in the completely bound state. The emission maxima of the fluorophore bound to different CD were obtained from the plateaus in the plot of the emission maximum versus concentration of the CD (Fig. 2). A critical look at Fig. 2 envisages two plateaus are observed. The intermediate plateau in the lower concentration range is assigned to correspond to the 1:
1 while the final one corresponds to the 1
:
2 probe-CD complex. The forthcoming sections, while dealing with different aspects of the probe-CD binding interactions, will confirm this proposition of formation of both 1
:
1 and 1
:
2 inclusion complexes with α-CD, in contrast with the formation of only a 1
:
1 complex.
In order to determine the stoichiometries of the inclusion complexes, the dependence of the BICPM fluorescence on α-cyclodextrin concentration was analyzed with added α-CD, using Benesi–Hildebrand equations32 for 1:
1 and 1
:
2 complexes (eqn (4) and (5) respectively).
![]() | (4) |
![]() | (5) |
![]() | ||
Fig. 3 Double reciprocal plots for the 1![]() ![]() ![]() ![]() |
This rules out the formation of a single type of BICPM–α-cyclodextrin complex and indicates that the BICPM–α-CD stoichiometry in the lower CD concentration range is different from that at a higher α-cyclodextrin concentration range. From the analysis of the fluorescence data, we found that at lower α-CD concentration plot of 1/ΔF against 1/[CD] and at higher α-CD concentration plot of 1/ΔF against 1/[CD]2 are linear justifying the validity of eqn (4) in the lower concentration range and eqn (5) in the higher concentration range of α-CD. Thus, we conclude that a 1:
1 BICPM–α-CD complex is formed at lower α-cyclodextrin concentration while a 1
:
2 BICPM–α-CD complex is formed at higher α-CD concentration. A similar type of observation was noticed in our previous works for the probe norharmane6,18 and also by Kim et al.33 for the probe 4-biphenylcarboxylic acid.
Fig. 4 represents the respective plots in the segmented α-cyclodextrin concentration ranges. Once the stoichiometry is established, the association constants (K) are determined from the individual plots. The extracted values are obtained as 61.46 mol−1 and 24.52 × 10³ mol−2 for 1:
1 and 1
:
2 complexes respectively with α-CD. The determined values (15%) fall within the normal range of values reported earlier for such type of complexations.6,18 A remarkably high association constant value for the 1
:
2 BICPM–α-CD complexation signifies a compact packing of the probe within the cavity space of the two α-CD coming from the opposite sides.6
To investigate these CD binding events further time resolved fluorescence studies have been performed in the presence and absence of CD. Excited-state lifetime measurements provide sensitive parameters for exploring the existence of single or multiple species.28 For the same reason that the emission spectra of the fluorophores are sensitive to the local environment, their fluorescence lifetimes reflect intermolecular interactions. BICPM encapsulation within CD cavity can be looked into through time-resolved measurements.18,31 It allows one to see how the rotational time constant affected upon encapsulation of the probe within the CD cavities.31,34 It is seen that the fluorescence decays of BICPM in water and CDs are far from single exponential. In water, and in the CD environments the fluorescence decays of BICPM are biexponential. Extraction of meaningful rate constants in such heterogeneous systems is really difficult. In order to realize the effect of the encapsulation of the fluorophore on the rotational correlation time, we preferred to use the mean fluorescence lifetime defined by eqn (3) instead of placing too much emphasis on the magnitude of individual components of the multiexponential decays. A complete treatment of the complex and multiexponential fluorescence decays of BICPM in α-CD is, by itself, rigorous and will be addressed at a later time. The calculated average lifetime values of BICPM in water and in CD environments are tabulated in Table 1. Analysis of each individual decay function was judged from the reduced χ2 values.
[α-CD] mM | a1 | τ1 (ps) | a2 | τ2 (ps) | 〈τ〉 (ps) | 〈τc〉 (ps) | χ2 |
---|---|---|---|---|---|---|---|
a Where a1 and a2 are the decay constants, τ1 and τ2 are the lifetimes, 〈τ〉 is the average lifetime in picosecond, 〈τc〉 is the average rotational correlation time in picoseconds. | |||||||
0.0 | 52.30 | 181 | 47.70 | 432 | 3.01 | 43.00 | 1.09 |
50.0 | 70.80 | 225 | 29.20 | 527 | 3.13 | 283.00 | 1.10 |
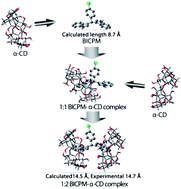
For host–guest interaction it is very crucial to know the binding mode and to get this picture it is very important to have a clear idea about the shape, size and length around different dimensions of the probe molecule. For this purpose the ground state geometry of BICPM molecule has been optimized theoretically (Scheme 2) using density functional theory with the hybrid functional B3LYP and 6-311+G basis set with solvent effect of acetonitrile in CPCM model. On the basis of that calculated end-to-end lengths of 12 Å and 8.9 Å. It is apparent that BICPM is too bulky to fit entirely in the α-CD cavity (internal diameter 5.7 Å and depth ∼6.0 Å). But the two fluorescing indole rings hanging from the cholorobenzene unit each having calculated length 6.5 Å and transverse cross-section 5.4 Å may get shelter partially inside the CD cage.
Comparing the α-CD cavity dimension with the molecular size of the probe molecule one can argue that only a part of BICPM; actually one hanging arm enters within the α-CD cavity as shown in Scheme 3. Hence in case of 1:
1 complexation a part of the probe; second hanging arm remains exposed to the bulk aqueous phase. This open part is also amenable to complex formation with another α-CD leading to the formation of a 1
:
2 inclusion complex between BICPM and α-CD (Scheme 3). This type of complexation basically encapsulates the fluorescing moiety of the probe molecule from all around removing the solvent water molecules, which is essential for the fluorescence properties. Hence significant decrease in the fluorescence intensity is observed.
It is important to consider the possibility of face to tail or tail to tail encapsulation mode also. The following section has been devoted in this connection. The optimized ground state structure of the BICPM probe molecule provides the width of the single indole part 5 Å as can be easily observed from the Scheme 2. On the other hand, the face opening of α-CD is ∼5.3 Å and the tail opening is ∼4.5 Å. So it is quite rational that the formation of inclusion complex (IC) between BICPM and α-CD is only possible through the face if is either 1:
1 or 1
:
2. Hence the possibility of face to tail and tail to tail ICs may be discarded from the theoretical point of view. Additional supports in this direction can be produced from the docking model, which clearly shows a face-to-face insertion of the indole moiety (Fig. 5).
Fluorescence anisotropy is a property that is dependent upon rotational diffusion of the fluorophore as well as the fluorescence lifetime and reflects the extent of restriction imposed on the dynamic properties of the probe by the microenvironment.12 Thus, an increase in the rigidity of the surrounding environment of the fluorophore results in an increase in the fluorescence anisotropy. Fig. 6 presents the variation of fluorescence anisotropy (r) of BICPM in α-CD environments.
In the presence of lower concentrations of α-CD (for the 1:
1 complexation), small changes in the fluorescence anisotropy values are observed. This indicates that the probe experiences only a bit of restriction imposed by the α-CD environments. This is rationalized considering that a part of the fluorophore molecule remains exposed to the bulk aqueous phase. Interestingly, in the presence of higher concentrations of α-CD, there is a large enhancement in the fluorescence anisotropy reflecting a greater degree of motional restriction in this environment. This situation is well-explainable from the model of the 1
:
2 probe–α-CD inclusion complex. To ensure that the observed change in the steady-state anisotropy of BICPM in the α-CD environments is not due to any change in the lifetime, the apparent (average) rotational correlation times (τc) were calculated using Perrin's equation12 for BICPM in the α-CD environments at their saturation level where r0, r, and τf are the limiting anisotropy for the complexed molecule, steady-state anisotropy, and mean fluorescence lifetime of the fluorophore, respectively.
![]() | (6) |
Although ideally Perrin's equation is not applicable in a microheterogeneous environment, one can use it, to a good degree of accuracy, considering the mean fluorescence lifetime of the system. Using eqn (6), we have determined the τc values in water as well as in α-CD environments, taking r0 = 0.4, τc increases appreciably with the addition of the CD. A significant increase in τc in α-CD environments (Table 1) establishes that the observed change in the anisotropy values (Fig. 5) were not due to lifetime-induced phenomena and reinforces our earlier prediction that there is an increase in rotational restriction experienced by the probe molecule.35,36 As a matter of fact, confinement of a probe in α-CD cavity increases the hydrodynamic diameter of the system (the sum of the lengths of the host, i.e., the CD, and the guest), and this causes enhancement of the rotational correlation time. Since measurements of the rotational correlation time can provide valuable information regarding the effective volume and dimension of the inclusion complexes (considering the measured, very small difference in the lifetime and assuming that the macroscopic viscosity is the same in all of the solutions containing CDs) as compared with the free probe or CD molecule, this parameter has been employed to gather additional evidence in support of the stoichiometry of the inclusion complexes formed between the BICPM and CD. In the presence of high concentrations of α-CD (50.0 mM), the determined rotational correlation times 2.83 ns is much larger than the corresponding values in the bulk water 0.83 ns. This observation indicates the change in hydrodynamic dimension of the probe due to formation of supramolecules. To get an idea about the approximate size of the inclusion complexes formed between BICPM and CD, we can take the help of the Stokes-Einstein-Debye equation.37,38
![]() | (7) |
This journal is © The Royal Society of Chemistry 2014 |