
Metal (metal = Fe, Co), N codoped nanoporous carbon for efficient electrochemical oxygen reduction†
Xiaojuan Wang,
He Fu,
Wei Li,
Jie Zheng* and
Xingguo Li*
Beijing National Laboratory for Molecular Sciences (BNLMS), (The State Key Laboratory of Rare Earth Materials Chemistry and Applications), College of Chemistry and Molecular Engineering, Peking University, Beijing 100871, China. E-mail: xgli@pku.edu.cn; zhengjie@pku.edu.cn
First published on 13th August 2014
Abstract
Metal, N codoped nanoporous carbon (N–M–nC, M = Fe, Co) is prepared by in situ incorporation of the metal during the formation of the nanoporous carbon skeleton followed by NH3 treatment. The samples exhibit superior catalytic performance for the oxygen reduction reaction (ORR) in alkaline electrolytes. M, N codoping shows a synergic effect with improved ORR performance compared to the sample with only nitrogen dopant (N–nC), in the order of N–Fe–nC > N–Co–nC > N–nC, indicating that the M–N synergic effect is critical for high ORR performance in alkaline electrolyte. A detailed structural characterization of the catalysts is carried out, which suggests that the improved ORR performance should be attributed to the formation of active sites with M–N bonding. Other structural differences, including surface area, porosity and carbon structure, play a minor role. The performance of the N–Fe–nC sample is comparable to that of commercial Pt/C, including more positive onset and halfwave potential, comparable saturation current density and a dominant four-electron pathway, which suggests that nanoporous carbon can serve as an ideal platform for developing high performance ORR catalysts via proper doping.
Introduction
The electrochemical reduction of oxygen (known as the oxygen reduction reaction, ORR) is the cathode reaction in fuel cells (FCs). In the most widely used low temperature FCs with aqueous electrolytes such as polymer electrolyte membrane FCs and alkaline FCs, the ORR is six or more orders slower than the hydrogen oxidation reaction on the anode1 and thus requires substantially higher loading of Pt catalysts. Even with the state of the art technology, the Pt loading for the cathode is still 5–10 times higher than that in the anode.2 Therefore, developing cheap yet equally efficient ORR catalysts is of critical importance to reduce the cost of FCs. Replacing Pt with cheap, abundant elements is the ultimate but extremely challenging solution, which has inspired considerably enthusiasm in recent years.To develop noble metal free ORR catalysts, an important strategy is to modify carbon materials with proper dopants to create the ORR active sites. The metal–N–C (M–N–C) catalysts by codoping of N and transition metals such as Fe (ref. 3–5) and Co (ref. 4, 6 and 7) have been extensively studied. It has been demonstrated that by properly designed structure and well controlled processing, the M–N–C based catalysts may exhibit comparable performance to that of Pt. The active sites for this type of catalysts are proposed to be N-coordinated metal centers MNx.2,8 In acidic electrolyte, most high performance noble metal free catalysts reported are based on this type, in which the M–N synergy is essential.2,9,10 In alkaline electrolyte, the role of transition metals seems to be less critical. N-doped carbon without metal dopants is also found to show promising performance. Superior ORR performance has been reported for N doped carbon nanotubes and graphene sheets.11,12 It is proposed that the incorporated N atom will modulate the local electron density of carbon atoms, which will facilitate the O2 adsorption and dissociation.11,13,14
Although the term “metal free” is frequently adopted, the existence of transition metals in these N-doped carbon materials cannot be completely excluded in most cases. For instance, growth of carbon nanotubes (CNT) or graphene is usually catalyzed by transition metals such as Mn, Fe, Co or Ni.15–17 It is argued that the trace amount of transition metals may either serve as a component for the ORR active sites or assist the formation of the active sites.18–21 Wang et al.22 demonstrated that manganese oxide in graphene prepared by the Hummer's method was responsible for the high-performance ORR catalysts reported based on this type of graphene materials. N-doped carbon prepared from N containing organic molecules or polymers, such as polypyridine,23 polyacrylonitrile,24 melamine,19 polyaniline,25 polypyrrole26 etc. may exclude the transition metals. However, the ORR performance is typically inferior compared to those derived from CNT or graphene.18,19,27–30 There have been several recent efforts trying to elucidate the role of transition metals in the ORR performance based on these carbon materials which are more confidently to be regarded as metal free.31–33 Masa et al.18 and Liu et al.19 reported that trace metal residues significantly promote the ORR performance in alkaline electrolyte of the N-doped commercial carbon blacks (Vulcan-72 and Black Pearl). However, the key structural changes caused by metal doping that lead to the enhanced ORR performance remain unclear.
Here we report highly efficient M–N–C (M = Fe and Co) ORR catalysts in alkaline electrolyte based on nanoporous carbon materials and study the role of transition metals in detail. A direct advantage of the nanoporous structure in catalysis is the high surface area which can enhance the density of active sites. ORR catalysts based on nanoporous carbon are gaining increasing interest in recent years.27,34,35 We prepare the nanoporous carbon based ORR catalysts using the well-known block copolymer soft template method,36 which is versatile in porosity control and also allows us to obtain a truly metal free carbon materials as the basis to study the effect of the metals. Metal incorporation is achieved during the formation of the carbon skeleton with intentional metal doping while N doping is realized by annealing in NH3 atmosphere. By controlling the metal doping and the annealing atmosphere, metal free nanoporous carbon (nC), metal doped nC (M–nC), nitrogen doped nC (N–nC) and metal, nitrogen codoped nC (N–M–nC) can be obtained, which allows us to study the M–N synergic effect on a more accurate basis. We demonstrate that for the nanoporous carbon system in alkaline electrolyte, M, N codoping shows improved ORR performance compared to single doping of N, in the order of N–Fe–nC > N–Co–nC > N–nC. The results suggest that the M–N synergic effect is also critical for high ORR performance in alkaline electrolyte. The performance of N–Fe–nC is comparable to that of the commercial Pt/C catalyst.
Experimental section
Materials and chemicals
1,3-Diphenol (C6H6O2, 99%), ferrous sulphate (FeSO4·7H2O, 99%), cobalt sulphate (CoSO4·6H2O, 99%) were purchased from XILONG Chemical. HCl (37.0–40.0 wt%) was purchased from Beijing Yili Fine Chemicals Corporation. Tri-block copolymer F127 (MW = 12![[thin space (1/6-em)]](https://www.rsc.org/images/entities/char_2009.gif) 600, EO106PO70EO106) was purchased from Sigma Chemicals. Carbon supported platinum catalysts (Pt/C, nominally 10% on carbon black) and nafion (5 wt% solution in ethanol and water) were purchased from Alfa Aesar.
600, EO106PO70EO106) was purchased from Sigma Chemicals. Carbon supported platinum catalysts (Pt/C, nominally 10% on carbon black) and nafion (5 wt% solution in ethanol and water) were purchased from Alfa Aesar.
Synthesis of the catalysts
The preparation procedure of N–M–nC is illustrated in Fig. 1, which is adapted from the method in ref. 37 and 38. Tri-block copolymer F127 and 1,3-diphenol are dissolved in deionized water and ethanol to give the soft template. The solution pH is adjusted to 1 by adjusting hydrochloride acid. Then the corresponding divalent metal sulphates are added to the solution. After continuous stirring for 2 h, formaldehyde is added to initiate the polymerization. Metal is incorporated into the polymeric precursor through the interaction with the functional groups on the template, likely the hydroxyl group in the 1,3-diphenol. The hybrid precursor is subjected to a delicate heating program to remove the template. The resulted nanoporous carbon is heated again in NH3 stream for N doping. The nanoporous carbon without metal doping is prepared by the same protocol except that the metal sulphate is not added. The samples are denoted as nC, N–nC, M–nC and N–M–nC for undoped, N-doped, M-doped, and N, M codoped nanoporous carbon, respectively, where M = Fe or Co. | ||
| Fig. 1 A schematic illustration of the synthetic procedure of Fe, N codoped nanoporous carbon. | ||
Materials characterization
The structure and morphology of products are characterized by X-ray diffraction (XRD, Rigaku D/max 200 diffractometer, Cu Kα), and high-resolution transmission electron microscopy (HRTEM, JEM 2100, 200 kV). Thermogravimetric analysis (TGA) is carried out on a Q600 SDT thermoanalyzer (Thermal Analysis Corporation, USA). Nitrogen adsorption–desorption isotherms are measured on an Autosorb IQ gas sorption analyzer (Quantachrome) at 77 K. Before testing, samples are degassed at 200 °C for 2 h. The surface area and pore size distribution is determined by the Brunauer–Emmett–Teller (BET) and Quenched Solid Density Functional Theory (QSDFT) methods assuming a slit/cylinder pores model, respectively. The detailed QSDFT method is seen in ESI.† The X-ray photoelectron spectroscopy (XPS) analysis is performed on an AXIS-Ultra spectrometer (Kratos Analytical) using monochromatic Al Kα radiation (225 W, 15 mA, 15 kV). Eighty sweeps are carried out for Co 2p and Fe 2p, five sweeps for N 1s. The content of C, H and N was determined by the combustion method on an elemental analyser (Vario EL). The content of metal is estimated by TGA in air, assuming the residue are the pure Fe3O4 or Co3O4 phases.Electrochemical preparation and characterization
To prepare the working electrode, 2 mg of samples are ultrasonically dispersed in a mixed solution of 100 μL isopropanol and 100 μL Nafion (0.5 wt%) for about 1 h. Then 7 μL of suspension is dropped onto a glassy carbon rotating ring disk (RDE, 5 mm, Pine Research Instrumentation, USA) surface and dried for 5 min under infrared light and 2 h at room temperature.All electrochemical measurements of the samples, including cyclic voltammograms (CVs) and linear scan polarization curves are performed at room temperature in 0.1 M KOH solutions. The electrolyte is purged with oxygen for at least 30 min prior to each measurement. The data is recorded using a CHI 760D bipotentiostat (CHI Instruments, Inc., USA). The reference electrode is a Ag/AgCl (3.5 M KCl-filled) electrode in 0.1 M KOH solution. The counter electrode was a platinum foil.
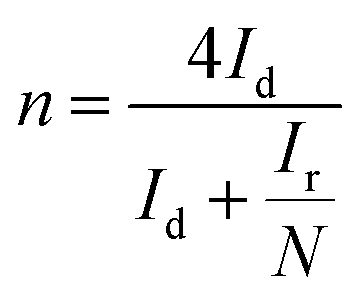
The number of electron transferred during the ORR is calculated based on measurements on a rotating ring-disk electrode (RRDE, 5.61 mm of disk outer diameter, Pine Research Instrumentation, USA). The electrode preparation and measurement conditions follow the same way as the RDE measurement. Before experiments, the Pt ring was activated by potential cycling from 0 to 1.4 V (vs. RHE) at a scan rate of 50 mV s−1 for at least 10 minutes. The number of electron transferred (n) is calculated using the following equation.39
 | (1) |
Results and discussion
Structural characterization of the catalysts
Fig. 2 shows the transmission electron microscopy (TEM) images of nC, Fe–nC, N–nC and N–Fe–nC. The nC sample has a nanoporous structure with pore diameter of 5 nm separated by walls with thickness of 5 nm (Fig. 2a). The pores exhibit one-dimensional ordering (Fig. 2b), which is confirmed by the clear diffraction peak in the small angle X-ray diffraction (SA-XRD) pattern (Fig. S1†). The Fe–nC sample exhibits similar nanoporous structure (Fig. 2c). However, the long range ordering of the pore alignment is significantly weakened. The diffraction peak in the SA-XRD pattern becomes broader and less well-defined (Fig. S1†). Although the level of the doped Fe is only 1–2 wt% (Table S1†), it may interfere the formation of the long range ordering structure through the interaction with the template copolymer or the monomers. Doping of Co shows the similar effect, i.e., the nanoporous structure is largely unaffected (Fig. S4a and S4b†) while the long range order of the pores is lost (Fig. S1†). | ||
| Fig. 2 TEM images of modified nanoporous carbon (nC): (a and b) nC, (c) Fe–nC, (d) N–nC (e and f) N–Fe–nC. | ||
The nanoporous nature of these samples is further confirmed by nitrogen adsorption measurements (Fig. 3a). The nC and M–nC samples exhibit similar specific surface area around 700 m2 g−1 (Table S1†). A well-defined Type H2 hysteresis loop is observed in the isotherms of all these samples, which is originated from the capillary condensation effect in nanoscale pores.40 Correspondingly, there is a narrow peak at 5 nm in the pore size distribution patterns (Fig. 3b) of these samples. This result is in very good agreement with the near uniform pore size observed in TEM images. These samples also contain pores smaller than 1.5 nm in width, which is indicated by the rapid uptake in the low pressure region of the isotherms (Fig. 3a).
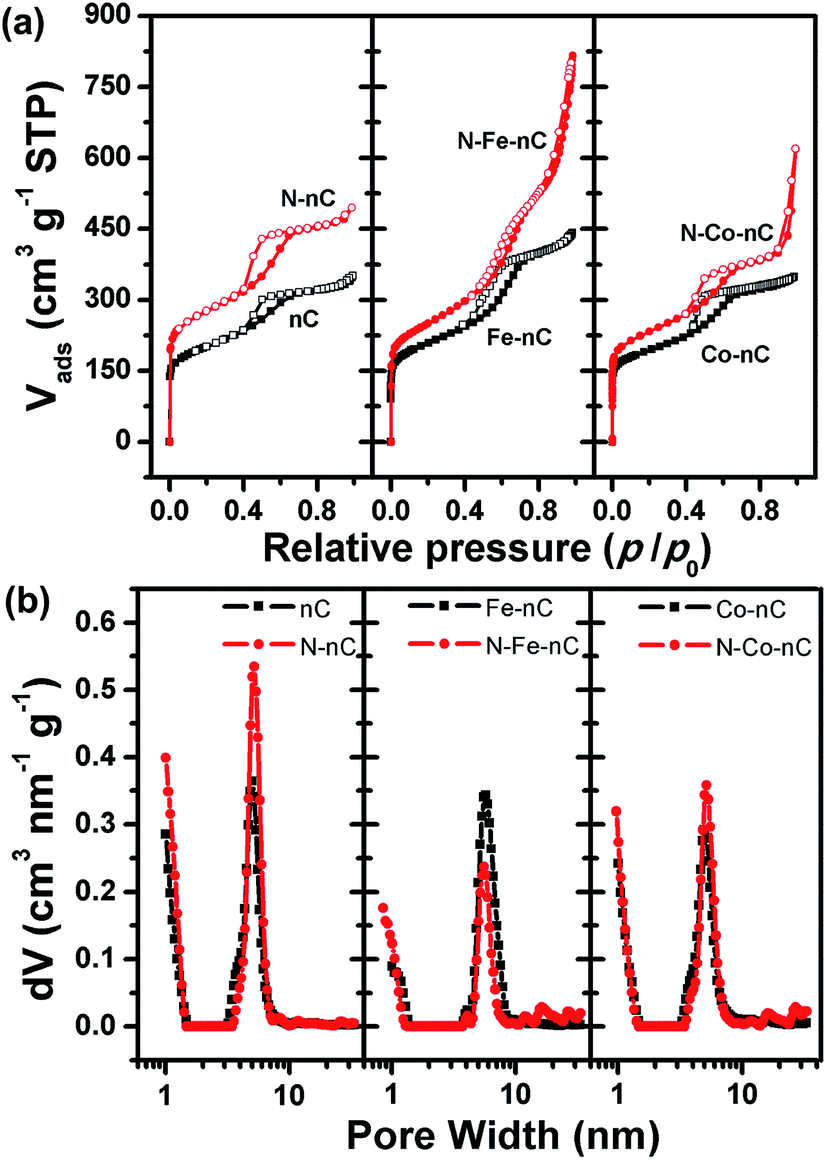 | ||
| Fig. 3 N2 adsorption–desorption isotherms (a) and pore size distributions (b) of modified nanoporous carbon. | ||
Thermal treatment in NH3 causes a notable N doping effect. The N content is 4.85 wt%, 2.47 wt% and 2.75 wt% for the N–nC, N–Fe–nC, N–Co–nC samples, respectively. For the nC sample, the nanoporous structure is well maintained after N doping, as shown in the TEM images (Fig. 2d and S2†). However, the long range order of the pores become poorer, as suggested by the poorly defined peak in the SA-XRD pattern (Fig. S1†). On the other hand, the M–nC samples experience a more notable change of the pore structure after thermal treatment in NH3. As shown in the TEM image, the pore arrangement of the N–Fe–nC sample is significantly disrupted (Fig. 2e and S3c†). Some pores are merged together, forming larger mesopores. This is in agreement with the SA-XRD results where no diffraction peaks are observed (Fig. S1†). Moreover, the carbon shell also becomes thinner and shows clear graphite layers (Fig. 2f). Similar phenomena are also observed in the N–Co–nC sample (Fig. S1 and S4†).
Fig. 3 summarizes the nitrogen sorption isotherms and the pore size distribution curves of the nC based samples, which clearly demonstrates that thermal treatment in NH3 enlargers the BET surface area and enhances the porosity of both nC and M–nC samples. The BET surface area is 1006, 871, 845 m2 g−1 for the N–nC, N–Fe–nC and N–Co samples, all of which are significantly promoted compared to the samples prior to thermal treatment in NH3. The shape of the isotherms and the pore size distribution curves is quite similar for N–nC and nC, indicating that the change of the pore structure is not significant during the N-doping process. On the other hand, the N–M–nC samples exhibit a very unique adsorption profile for nitrogen, i.e., the Type H3 hysteresis at the higher relative pressure,41 which is not observed for the M–nC samples (Fig. 3b). The pore structure analysis results derived from the nitrogen sorption isotherms are in very good agreement with the TEM results, both of which indicate that the incorporated metals amplify the change of pore structure during the thermal treatment in NH3, with additional mesopores created.
The structural change of the nC based samples resulted from thermal treatment in NH3 is further studied by Raman spectroscopy. The spectra in the 1000–2000 cm−1 region can be deconvoluted into four components following the approach by Sharifi et al.42 and Nitze et al.43: the I band at 1180–1190 cm−1, the D band at 1330 cm−1, the D′′ band at 1470–1520 cm−1 and the G band at 1590 cm−1 (Fig. S6†). The I band is impurity related. Both the D and D′′ bands are due to defect induced Raman active modes, where D is related to irregular lattice spacing and D′′ to disorder in graphene layer stacking.42 Some authors also attribute the D′′ band to the distortion of the hexagonal symmetry in graphene, such as five member rings.21 We use the integrated band ratios IG/ID and IG/ID′′ to characterize the ordering in the graphitic structure, as summarized in Fig. 4 for the nC based samples. Both the IG/ID and IG/ID′′ ratios are similar for N–nC and nC, indicating that the carbon structure is not significantly affected by N-doping. On the other hand, the N–M–nC samples exhibit much higher IG/ID′′ ratio compared to the M–nC samples, despite that the IG/ID ratio is almost similar. This indicates that the incorporated metal will improve the ordering of the graphitic structure during the thermal treatment in NH3, which is in agreement with the thin graphitic layer structure observed in TEM (Fig. 2, S3 and S4†).
 | ||
| Fig. 4 Summary of the IG/ID and IG/ID′′ ratios in the Raman spectra of the nanoporous carbon based samples. | ||
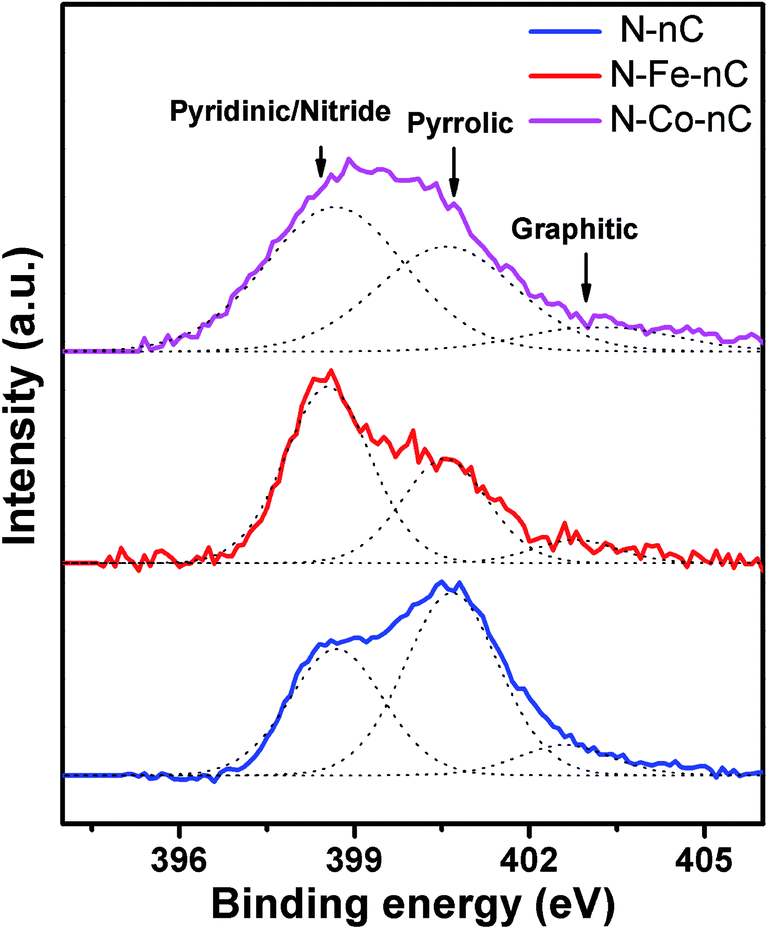
The incorporation of metal also affects the nitrogen doping mechanism during the NH3 treatment, as shown by the X-ray photoelectronic spectroscopy (XPS) (Fig. 5). The N 1s spectrum of N–nC can be deconvoluted into peaks corresponding to pyridinic (398.6 ± 0.3 eV), pyrrolic (400.3 ± 0.3 eV) and graphitic (402 eV) nitrogen, respectively, with pyrrolic N being the major component. Such N chemical bonding is commonly observed in N-doped carbon materials.6,44 For the N–M–nC samples, however, the peak at 398.6 eV becomes dominant. As nitrides also contribute to the 398.6 eV peak,21,34 this change in the XPS spectra can be attributed to the M–N bonding formation. Unfortunately, due to the low metal content, the Fe and Co spectra are too noisy to provide sufficient information on bonding (Fig. S5†).
 | ||
| Fig. 5 High resolution XPS spectrum of N 1s for N–nC and N–M–nC. | ||
The electrocatalytic performance of the catalysts
The ORR performance of the nanoporous carbon based catalysts in 0.1 M aqueous KOH solution is shown in Fig. 6, which is measured on a rotating ring-disk electrode (RRDE). The M–N synergy is first illustrated in Fig. 6a using Fe as the metal dopant. The samples without N doping (nC and Fe–nC) are rather poor ORR catalysts. Nitrogen doping significantly promote the ORR activity. The N–nC sample shows an onset (Eon) and half wave potential (E1/2) of −0.090 and −0.167 V (vs. Ag/AgCl), respectively and saturate current density (jsat) of 5.12 mA cm−2, which is already very close to that of the commercial Pt/C catalyst (Eon = −0.051 V, E1/2 = −0.132 V, jsat = 5.64 mA cm−2). The N–Fe–nC sample shows even more remarkable performance: Eon = −0.044 V, E1/2 = −0.125 V (vs. Ag/AgCl) and jsat = 5.62 mA cm−2. Notably, the onset and half wave potential are more positive than that of Pt/C, which means lower overpotential during fuel cell operations. The performance is in line with noble metal free ORR catalysts.7,27,30,45,46 A parallel study on the Co doped samples is also carried out. Fig. 6b summarized the linear scanning polarization curves of the three N doped sample. Both N–Fe–nC and N–Co–nC outperform nC in terms of the potential, while N–Co–nC is slightly less efficient compared to N–Fe–nC (E1/2 = −0.145 V (vs. Ag/AgCl), jsat = 4.82 mA cm−2). | ||
| Fig. 6 (a and b) Linear scanning polarization curves of the nanoporous carbon based ORR catalysts measured on a rotating ring and disk electrode in O2-saturated 0.1 M KOH at rotating rate of 1600 rpm. The ring potential is set to 0.5 V (vs. Ag/AgCl). The outer diameter of the RRDE disk is 5.61 mm. The catalysts loading is 0.28 mg cm−2 according to the electrode preparation process. (c) The electron transfer number (ne) and H2O2 yield (H2O2%) of the catalysts. | ||
To further assess the electrocatalytic mechanism, we calculate the number of electron transferred (n) and the yield of hydrogen peroxide on the basis of disk and ring current (eqn (1)). The n of the N–Fe–nC is 3.88–3.98 in the range of −0.8 V to −0.2 V (vs. Ag/AgCl), indicating a dominant four-electron process and low peroxide formation ratio (0.5–6%) (Fig. 6c). The selectivity is also very close to that of Pt/C. The N–Co–nC sample exhibits lower n value of 3.51–3.66 and higher peroxide yield around 15%. However, for the N–nC sample, n is only 3.41 at −0.8 V (vs. Ag/AgCl), corresponds to a relatively high peroxide formation ratio of 30%. The selectivity also improves in the order of N–nC < N–Co–nC < N–Fe–nC.
The N–Fe–nC sample is further characterized for the methanol tolerance and the stability. As shown in Fig. S7,† after introducing methanol into the alkaline medium, the peak corresponding to oxygen reduction at −0.18 V (vs. Ag/AgCl) of the N–Fe–nC remains unchanged. While for the Pt/C, the ORR peak in the CV curve disappears after methanol introduction. The long-term operation stability of the N–Fe–nC sample is assessed after 300 CV cycles between −1.0 and 0.2 V at 50 mV s−1 in oxygen saturated 0.1 M KOH. As shown in Fig. S8,† both E1/2 and jsat remain unchanged. The above results show the N–Fe–nC has very good methanol tolerance and long-term stability.
Discussions
The soft template method allows us to prepare metal-free nanoporous carbon and control the M and N doping. Thus, the effect of the M and N dopants on the ORR performance can be evaluated on a more accurate basis. Clearly, nitrogen is essential to achieve good ORR performance, as the two samples without N (nC and Fe–nC) are both rather inefficient catalysts. N doping on nC results in reasonably good ORR performance (only 35 mV more negative in E1/2 compared to Pt/C). In terms of the potential, this performance is in fact among the highest results for N-doped carbon derived from N containing organic molecules or polymers.18,47 The good activity may be attributed to the high surface area of the nanoporous carbon which can accommodate more surface active sites. However, the selectivity is poor with more than 20% peroxide formation. Several previous reports on N-doped carbon materials derived from organic precursors also suffered from the low selectivity.18,47–50 The overall performance of the N–nC sample, in terms of both the potential and the selectivity, is inferior compared to the N-doped carbon samples based on graphene or carbon nanotubes.11,12The ORR performance of the three N doped samples clearly suggests that there is a synergic effect of M and N on the ORR performance even in alkaline electrolyte. The improved ORR performance due to the M–N synergy can be correlated to the structural changes originated from the metal doping. We will focus on the difference between the N–M–nC and N–nC samples. A notable difference in N chemical bonding is suggested by the N1s XPS spectra (Fig. 5) where the N–M–nC samples exhibit a more dominant component at 398.6 eV compared to N–nC. This binding energy is usually attributed to nitrogen atoms with pyridinic structure, while N atoms in the nitride and MNx form also contribute to this component.17,21,51 Therefore, the higher 398.6 eV component for the N–M–nC samples can serve as an indication of M–N bond formation. Similar N 1s patterns with dominant 398.6 eV component have been previously observed in ORR catalysts derived from pyrolysis of N-chelated Fe complexes10,52 where Fe–N bonding is highly probable and has been confirmed by EXAFS. Previous studies by X-ray absorption techniques53,54 and Mossbauer spectroscopy55,56 also suggest that NH3 treatment of metal-loaded carbon will result in formation of the N-coordinated metal structure MNx. Therefore, the improved ORR performance of N–M–nC compared to N–nC in alkaline electrolyte can be attributed to the formation of the MNx structure which can serve as the ORR active centers.
The N–M–nC samples are also different to N–nC in surface area, pore structure and carbon structure. These structure difference may also contribute to the improved ORR performance. Therefore, for a fuller understanding on the M–N synergy, it is critical to evaluate the effect of these structure difference on the ORR performance. A comparison between the N–Fe–nC and N–Co–nC samples is particularly informative. These two samples have very similar pore structure. The N–Co–nC sample even shows more ordered graphitic structure. As shown In Fig. 4, we can see that the N–Co–nC sample exhibit much higher IG/ID′′ ratio compared to the N–Fe–nC sample. However, the oxygen reduction reaction performance of the N–Co–nC sample is inferior to that of the N–Fe–nC sample, which strengthens the conclusion that the MNx structure plays a more critical role in determining the ORR performance. This is in agreement with previous studies in acidic electrolyte, which suggests that the Co based ORR catalysts are slightly less efficient compared to their Fe counterpart.9,39 In addition, the specific surface area, which has been shown to positively correlated to ORR performance,34 is clearly not a determining factor in our case, as the less efficient N–nC sample in fact has the highest BET surface area. Therefore, the difference in surface area, pore structure and carbon structure are not the major reason for the improved ORR performance. The observed M–N synergy should be directly correlated to the formation of the MNx active sites, which are more active than that in metal-free N–nC samples.
Conclusions
In conclusion, we obtain high performance ORR catalysts by codoping of N and transition metals M (M = Fe or Co) into nanoporous carbon (N–M–nC). M, N codoping shows a synergic effect with improved ORR performance compared to single doping of nitrogen, in the order of N–Fe–nC > N–Co–nC > N–nC, indicating that the M–N synergic effect is critical for high ORR performance in alkaline electrolyte. The M–N synergic effect is attributed to the formation of active sites with M–N bonding (the MNx structure), while the change in surface area, porosity and carbon structure only plays a minor role. The N–Fe–nC catalyst outperforms the commercial Pt/C catalysts with 10 wt% Pt loading. Nanoporous carbon, though ORR inactive itself, may serve as an ideal platform to derive high performance ORR catalysts via proper doping.Acknowledgements
The authors acknowledge MOST of China (no. 2010CB631301) and NSFC (no. 21101007, U1201241 and 11375020, 21321001).Notes and references
- M. K. Debe, Nature, 2012, 486, 43–51 CrossRef CAS PubMed.
- F. Jaouen, E. Proietti, M. Lefevre, R. Chenitz, J. P. Dodelet, G. Wu, H. T. Chung, C. M. Johnston and P. Zelenay, Energy Environ. Sci., 2011, 4, 114–130 CAS.
- Z. S. Wu, S. B. Yang, Y. Sun, K. Parvez, X. L. Feng and K. Mullen, J. Am. Chem. Soc., 2012, 134, 9082–9085 CrossRef CAS PubMed.
- R. L. Liu, C. von Malotki, L. Arnold, N. Koshino, H. Higashimura, M. Baumgarten and K. Mullen, J. Am. Chem. Soc., 2011, 133, 10372–10375 CrossRef CAS PubMed.
- S. Yuan, J.-L. Shui, L. Grabstanowicz, C. Chen, S. Commet, B. Reprogle, T. Xu, L. Yu and D.-J. Liu, Angew. Chem., Int. Ed., 2013, 52, 8349–8353 CrossRef CAS PubMed.
- S. Q. Ma, G. A. Goenaga, A. V. Call and D. J. Liu, Chem.–Eur. J., 2011, 17, 2063–2067 CrossRef CAS PubMed.
- Y. Y. Liang, H. L. Wang, P. Diao, W. Chang, G. S. Hong, Y. G. Li, M. Gong, L. M. Xie, J. G. Zhou, J. Wang, T. Z. Regier, F. Wei and H. J. Dai, J. Am. Chem. Soc., 2012, 134, 15849–15857 CrossRef CAS PubMed.
- R. Bashyam and P. Zelenay, Nature, 2006, 443, 63–66 CrossRef CAS PubMed.
- G. Wu and P. Zelenay, Acc. Chem. Res., 2013, 46, 1878–1889 CrossRef CAS PubMed.
- J. Y. Choi, R. S. Hsu and Z. W. Chen, J. Phys. Chem. C, 2010, 114, 8048–8053 CAS.
- D. Wang and D. S. Su, Energy Environ. Sci., 2013, 7, 576–591 Search PubMed.
- C. Zhu and S. Dong, Nanoscale, 2013, 5, 1753–1767 RSC.
- K. P. Gong, F. Du, Z. H. Xia, M. Durstock and L. M. Dai, Science, 2009, 323, 760–764 CrossRef CAS PubMed.
- T. Sharifi, G. Hu, X. Jia and T. Wagberg, ACS Nano, 2012, 6, 8904–8912 CrossRef CAS PubMed.
- W. S. Hummers and R. E. Offeman, J. Am. Chem. Soc., 1958, 80, 1339 CrossRef CAS.
- Y. Zhu, S. Murali, W. Cai, X. Li, J. W. Suk, J. R. Potts and R. S. Ruoff, Adv. Mater., 2010, 22, 3906–3924 CrossRef CAS PubMed.
- W. Xiong, F. Du, Y. Liu, A. Perez, M. Supp, T. S. Ramakrishnan, L. M. Dai and L. Jiang, J. Am. Chem. Soc., 2010, 132, 15839–15841 CrossRef CAS PubMed.
- J. Masa, A. Zhao, W. Xia, Z. Sun, B. Mei, M. Muhler and W. Schuhmann, Electrochem. Commun., 2013, 34, 113–116 CrossRef CAS PubMed.
- J. Liu, X. Sun, P. Song, Y. Zhang, W. Xing and W. Xu, Adv. Mater., 2013, 25, 6879–6883 CrossRef CAS PubMed.
- D. Shin, B. Jeong, B. S. Mun, H. Jeon, H.-J. Shin, J. Baik and J. Lee, J. Phys. Chem. C, 2013, 117, 11619–11624 CAS.
- G. Wu, C. M. Johnston, N. H. Mack, K. Artyushkova, M. Ferrandon, M. Nelson, J. S. Lezama-Pacheco, S. D. Conradson, K. L. More, D. J. Myers and P. Zelenay, J. Mater. Chem., 2011, 21, 11392–11405 RSC.
- L. Wang, A. Ambrosi and M. Pumera, Angew. Chem., Int. Ed., 2013, 52, 13818–13821 CrossRef CAS PubMed.
- W. Xia, J. Masa, M. Bron, W. Schuhmann and M. Muhler, Electrochem. Commun., 2011, 13, 593–596 CrossRef CAS PubMed.
- C. You, S. Liao, H. Li, S. Hou, H. Peng, X. Zeng, F. Liu, R. Zheng, Z. Fu and Y. Li, Carbon, 2014, 69, 294–301 CrossRef CAS PubMed.
- R. Silva, D. Voiry, M. Chhowalla and T. Asefa, J. Am. Chem. Soc., 2013, 135, 7823–7826 CrossRef CAS PubMed.
- X. X. Yuan, X. L. Ding, C. Y. Wang and Z. F. Ma, Energy Environ. Sci., 2013, 6, 1105–1124 CAS.
- W. Wei, H. Liang, K. Parvez, X. Zhuang, X. Feng and K. Müllen, Angew. Chem., Int. Ed., 2014, 53, 1570–1574 CrossRef CAS PubMed.
- Y. Zheng, Y. Jiao, J. Chen, J. Liu, J. Liang, A. Du, W. Zhang, Z. Zhu, S. C. Smith, M. Jaroniec, G. Q. Lu and S. Z. Qiao, J. Am. Chem. Soc., 2011, 133, 20116–20119 CrossRef CAS.
- W. Yang, T.-P. Fellinger and M. Antonietti, J. Am. Chem. Soc., 2011, 133, 206–209 CrossRef CAS PubMed.
- Y. Li, W. Zhou, H. Wang, L. Xie, Y. Liang, F. Wei, J.-C. Idrobo, S. J. Pennycook and H. Dai, Nat. Nanotechnol., 2012, 7, 394–400 CrossRef CAS PubMed.
- X.-H. Yan and B.-Q. Xu, J. Mater. Chem. A, 2014, 2, 8617 CAS.
- U. Tylus, Q. Jia, K. Strickland, N. Ramaswamy, A. Serov, P. Atanassov and S. Mukerjee, J. Phys. Chem. C. Nanomater. Interfaces, 2014, 118, 8999–9008 CrossRef CAS PubMed.
- J. Masa, A. Zhao, W. Xia, M. Muhler and W. Schuhmann, Electrochim. Acta, 2014, 128, 271–278 CrossRef CAS PubMed.
- H.-W. Liang, W. Wei, Z.-S. Wu, X. Feng and K. Muellen, J. Am. Chem. Soc., 2013, 135, 16002–16005 CrossRef CAS PubMed.
- T. Palaniselvam, B. P. Biswal, R. Banerjee and S. Kurungot, Chem.–Eur. J., 2013, 19, 9335–9342 CrossRef CAS PubMed.
- Y. Meng, D. Gu, F. Q. Zhang, Y. F. Shi, L. Cheng, D. Feng, Z. X. Wu, Z. X. Chen, Y. Wan, A. Stein and D. Y. Zhao, Chem. Mater., 2006, 18, 4447–4464 CrossRef CAS.
- L. Zhi, S. Yan, Y. Yuan, M. Junhua and D. Liping, Mater. Res. Bull., 2012, 47, 274–278 CrossRef PubMed.
- J. S. Li, J. Gu, X. F. Ling, X. Y. Sun, J. Y. Shen, W. Q. Han and L. J. Wang, Acta Phys.-Chim. Sin., 2011, 27, 1772–1776 CAS.
- G. Wu, K. L. More, C. M. Johnston and P. Zelenay, Science, 2011, 332, 443–447 CrossRef CAS PubMed.
- S. Lowell, Characterization of porous solids and powders: surface area, pore size and density, Springer, 2004 Search PubMed.
- K. S. W. Sing, D. H. Everett, R. A. W. Haul, L. Moscou, R. A. Pierotti, J. Rouquerol and T. Siemieniewska, Pure Appl. Chem., 1985, 57, 603–619 CAS.
- T. Sharifi, F. Nitze, H. R. Barzegar, C.-W. Tai, M. Mazurkiewicz, A. Malolepszy, L. Stobinski and T. Wagberg, Carbon, 2012, 50, 3535–3541 CrossRef CAS PubMed.
- F. Nitze, B. M. Andersson and T. Wagberg, Phys. Status Solidi B, 2009, 246, 2440–2443 CrossRef CAS PubMed.
- G. Wu, N. H. Mack, W. Gao, S. Ma, R. Zhong, J. Han, J. K. Baldwin and P. Zelenay, ACS Nano, 2012, 6, 9764–9776 CrossRef CAS PubMed.
- H. T. Chung, J. H. Won and P. Zelenay, Nat. Commun., 2013, 4, 1922 CrossRef PubMed.
- J.-S. Lee, G. S. Park, S. T. Kim, M. Liu and J. Cho, Angew. Chem., Int. Ed., 2013, 52, 1026–1030 CrossRef CAS PubMed.
- C. Han, J. Wang, Y. Gong, X. Xu, H. Li and Y. Wang, J. Mater. Chem. A, 2014, 2, 605–609 CAS.
- J. Wu, D. Zhang, Y. Wang and B. Hou, J. Power Sources, 2013, 227, 185–190 CrossRef CAS PubMed.
- J. Kang, H. Wang, S. Ji, J. Key and R. Wang, J. Power Sources, 2014, 251, 363–369 CrossRef CAS PubMed.
- J. Liang, Y. Zheng, J. Chen, J. Liu, D. Hulicova-Jurcakova, M. Jaroniec and S. Z. Qiao, Angew. Chem., Int. Ed., 2012, 51, 3892–3896 CrossRef CAS PubMed.
- F. Jaouen, J. Herranz, M. Lefevre, J.-P. Dodelet, U. I. Kramm, I. Herrmann, P. Bogdanoff, J. Maruyama, T. Nagaoka, A. Garsuch, J. R. Dahn, T. Olson, S. Pylypenko, P. Atanassov and E. A. Ustinov, ACS Appl. Mater. Interfaces, 2009, 1, 1623–1639 CAS.
- M. Bron, J. Radnik, M. Fieber-Erdmann, P. Bogdanoff and S. Fiechter, J. Electroanal. Chem., 2002, 535, 113–119 CrossRef CAS.
- Y. Gorlin, B. Lassalle-Kaiser, J. D. Benck, S. Gul, S. M. Webb, V. K. Yachandra, J. Yano and T. F. Jaramillo, J. Am. Chem. Soc., 2013, 135, 8525–8534 CrossRef CAS PubMed.
- J. K. Dombrovskis, H. Y. Jeong, K. Fossum, O. Terasaki and A. E. C. Palmqvist, Chem. Mater., 2013, 25, 856–861 CrossRef CAS.
- A. H. Lu, J. J. Nitz, M. Comotti, C. Weidenthaler, K. Schlichte, C. W. Lehmann, O. Terasaki and F. Schuth, J. Am. Chem. Soc., 2010, 132, 14152–14162 CrossRef CAS.
- U. I. Kramm, J. Herranz, N. Larouche, T. M. Arruda, M. Lefevre, F. Jaouen, P. Bogdanoff, S. Fiechter, I. Abs-Wurmbach, S. Mukerjee and J.-P. Dodelet, Phys. Chem. Chem. Phys., 2012, 14, 11673–11688 RSC.
Footnote |
| † Electronic supplementary information available: Additional XPS spectra, XRD patterns, Raman spectra, electrochemical activity of the samples, additional TEM images of the catalysts. See DOI: 10.1039/c4ra05961a |
| This journal is © The Royal Society of Chemistry 2014 |