Integrated bioprinting and imaging for scalable, networkable desktop experimentation

Nathan D. Orloff, Cynthia Truong, Nathan Cira, Stephen Koo, Andrea Hamilton, Sean Choi, Victoria Wu and Ingmar H. Riedel-Kruse*
Department of Bioengineering, Stanford University, Stanford, 94305, California, USA. E-mail: ingmar@stanford.edu

Received 18th June 2014 , Accepted 7th July 2014

First published on 8th July 2014


Abstract

Adaptations of mass-market consumer electronics are increasingly used to aid experimentation in engineering, life sciences, and education. Inspired by recent bioprinting and imaging research, we have developed a low-cost, networkable, scalable bioprinter with integrated imaging that enables automated fluid deposition with monitoring biological materials over a large area that can interface with standard plasticware. We re-engineered a desktop printer and scanner with mechanical workarounds (rather than software) to leverage the unmodified software, creating a complete system for ∼$700. We found that the resulting print accuracy and precision of this system were close to those of the unmodified printer and scanner. We demonstrate the reach of this system by printing multiple strains of Escherichia coli, performing quantitative time-lapse recordings of bacterial growth, and then separating different fluorescent strains according to color. A fluid-deposition and imaging platform, like the one developed here, could be integrated for do-it-yourself research, remote experimentation, and (on-line) education.
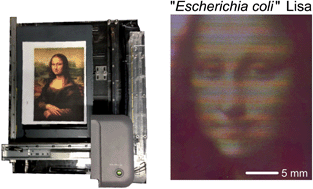

I. Introduction

Repurposing inkjet printers and flatbed scanners has led to widespread innovation across many fields, such as biofabrication,1–14 microfluidics,15–20 materials science engineering,21 chemistry education,22 and biological imaging.27–29 Much of these bioprinting approaches have focused on tissue engineering applications that used an unmodified x-axis of the printer (∼200 mm) and length of the print-head (∼20 mm).8,17,19 More recently, the components of a compact disk player and custom software14 were used. But in order to interface with conventional plastic-ware (e.g., multi-well plates, etc.), it is beneficial to significantly increase the printing and imaging area. By overcoming this challenge, we may enable future work on large-scale cell or organism migration assays,23,24 and time-dependent enzyme activity studies.26 Although bioprinting research has taken great strides, many efforts that use repurposed inkjet printers require custom software to expand the print area.27–29 On the other hand, commercial bioprinters exist;11,25,26 however the cost, limited flexibility of usable substrates, and print areas make scaling financially prohibitive for academic research.

Here, we report on an integrated platform that combines a consumer level printer and a flatbed scanner into a single unit (for the first time) to enable repeated deposition of biological materials and imaging over a large-area (∼700 cm2) at the same time (Fig. 1 and ESI Movie). Such a design closes the loop between the deposited materials and quantitative imaging feedback required for controlled experiments with repurposed hardware. We reconfigured the printer hardware such as to print over a stationary surface (rather than on a moving paper), and where we developed mechanical solutions to “trick” the sensors of the modified printer such that all the printer drivers remained functional. Hence, the system does not require special software, making it amenable for scalable, networkable desktop experimentation. The cost of this integrated bioprinting and imaging platform was approximately $700 (and could be decreased further).


image file: c4ra05932h-f1.tif
Fig. 1 We developed a low-cost, large-area bioprinter with integrated imaging by mechanically re-engineering a commercial printer and flatbed scanner. (a) Top and side views of the assembled bioprinter and imaging platform. Four multi-well microplates demonstrate one application (paper below is for contrast). (b) Corresponding schematic views with a color-coded of the components. The same color-coding is used throughout. The modified shaft (*) and mechanical switch (**) are essential components, described in Fig. 3. (b) Staged photographs illustrating a single print cycle: “stalled in clutch”, “rev to print”, and “reset to switch” are states of reconfigured printer (see Fig. 2).

In this paper, we first provide a broad overview of the hardware architecture and the bypassed printer components needed to implement our approach. We then quantify the mechanical performance of the investigated bioprinter relative to the unmodified printer. Finally, we demonstrate that this system can be used to dispense “bio-inks” composed of live Escherichia coli (E. coli), and then monitor the growth of these cells with the integrated scanner. Throughout the paper, we will use the same names and color-coding in the figures to identify the different components and states of the bioprinter. All of the image processing was carried out in MATLAB unless otherwise noted.

II. Bioprinter assembly

Our approach consists of three components: configuring the hardware to function as a flatbed bioprinter, bypassing the various steps and checks in the state diagram with mechanical components, and integrating functional imagining. To reduce design complexity and facilitate adoption by others,30 our simplified design employs a commercial printer and scanner, and a handful of parts and fasteners (five 3D acrylonitrile butadiene styrene (ABS) printed parts, and three 2D laser-cut parts made from acrylic. See ESI for more details). We chose the HP DeskJet J1000-J110a printer, which uses HP 61 thermal ink cartridges, and the HP G3110 flatbed scanner (Fig. 1a). A schematic of the bioprinter is shown in Fig. 1b. As in ref. 29, we also used the SANE application programming interface to operate the scanner. As the scanner did not require hardware modification beyond the plastic housing, we will focus on the steps and components needed to modify the unmodified state diagram to “trick” the printer into repeatedly printing onto a 2D stationary surface.

First, we disassembled the printer to understand the unmodified components and to identify components that could be modified to reconfigure printer architecture. In the process, we identified the optical slot encoder (a common design feature) as the key component in our design, because it effectively acts like a switch, turning printing on and off. By understanding how the optical slot encoder functioned, we were able to control the state diagram. For more details, see ESI Section I. From this, we designed a modified state diagram (Fig. 2b) that could be implemented by adding a custom mechanical switch and modified paper feed shaft with minimal changes to the hardware and state diagram, preserving the printer's ability to be controlled by conventional software. Our approach essentially utilizes the motor that normally drives the paper through the printer to advance the whole printer across a 2D stationary surface; it also bypasses the calibration step, because it rotates the paper feed shaft counterclockwise by more than one page length. If we did not modify this state diagram, then the modified printer would not reset to the same y-position after each print, and autonomous periodic printing onto the same 2D surface would not be possible.


image file: c4ra05932h-f2.tif
Fig. 2 We determined the state diagram of the unmodified printer and modified the state diagram with mechanical components to enable bioprinter to use the commercial printer drivers. Diagrams of the unmodified state diagram (a) and the modified state diagram (b). The modified state diagram removes two checks and their associated errors from the state diagram. There are also two new actions (stalled in clutch, transition (trans) to drive) and a new step (reverse (rev) to print). The modified state diagram enabled repeated printing over a single print area.

To work around the calibration cycle in the printer firmware, we devised a duel rack-and-pinion system with a mechanical clutch (Fig. 3a). The clutch consists of a spur gear mounted on a one-way bearing mated with a short clutch rack (Fig. 3b). The second spur gear is directly connected to the shaft, with a longer drive rack. This clutch is attached to the modified paper feed shaft such that the printer only translates in the intended directions during the print cycle. The three panels in Fig. 3b illustrate the states of the modified shaft during the print cycle. The 12.13 mm-diameter modified shaft consists of an ABS insert, a 120 mm 4–40 threaded rod, two 4–40 nuts, a one-way bearing (Boca Bearing #HF0812), two brass 31-tooth 64-pitch spur gears (Calandra Racing Concepts #64031), a radial bearing (Boca Bearing #SMR6701-UU), and an ABS bearing sleeve. The spur gear has a pitch diameter of 12.30 mm. The unmodified rotary encoder wheel and timing wheel assemblies are reused to preserve print dimensions. Additional details of bioprinter assembly are provided in ESI Section II.


image file: c4ra05932h-f3.tif
Fig. 3 We engineered a mechanical switch and modified the printer shaft to enable repeated printing onto a stationary surface executing the modified state diagram shown in Fig. 2b. (a) The assembled modified paper feed shaft with acrylonitrile butadiene styrene (ABS) plastic parts (see Fig. 1b*). (b) Schematics of the modified shaft during the three action states of the modified state diagram (see Fig. 2b). The circular arrows in the side view show the rotation of the shaft in the different states and the straight arrows show the resulting translation. (c) The ABS mechanical switch with the integrated paper feed slot sensor (see Fig. 1b**). (d) Schematics of the mechanical switch during the modified state diagram (see Fig. 2b).

Fig. 3c shows the mechanical switch with a flag that switches the paper feed optical sensor on and off. The slide with a flag moves along two 15 cm aluminum rails (3 mm in diameter) that are secured in a 3D-printed custom housing (Fig. 3c). It is perhaps easiest to think of this component in the context of the state diagram. When the printer is stalled in the clutch, the slot encoder is off (Fig. 3d). As the printer moves forward, a bumper (Fig. 1c) pushes the slide forward so that the flag blocks the slot encoder (Fig. 3d), switching the beginning of the print cycle. At the end of printing, another bumper pushes the slide back to the initial position (Fig. 3d), which effectively bypasses the out-of-paper error to enable automated and repeated fluid deposition over a single area. Another slot encoder is covered with tape to bypass the “output-tray-closed” error.

We completed the construction of our bioprinter by integrating a scanner. We found that the HP G3110 flatbed scanner was able to image objects that were up to 2 cm away from the glass with only minor distortion, which was desirable for imaging and printing on cell-culture plates. We modified the plastic housing of the scanner to maximize the overlap between the scan and print areas. Other than modifying the plastic housing and threading holes for mounting, the scanner itself was not modified. We also modularly integrated the scanner so that the bioprinter could function without the scanner, which was convenient for applications with a bench-top microscope. Fig. 1 depicts the completely assembled bioprinter with integrated imaging, which takes approximately two days to configure based on our instructions (see ESI Section III).

III. Print performance

Since we dramatically modified the hardware, it was necessary to test the mechanical reliability of this bioprinter. During these tests, we found that the printer was prone to gear-to-rack misalignment when it translated quickly over distances greater than 1 cm and after abruptly changing directions; motions that occur at the beginning and end of a print cycle and are a part of the firmware. We mitigated this problem by printing a light-gray 10 mm × 190 mm stripe at the top and bottom of the print area and a thin gray border around the print area (Fig. 4a). The rack-and-pinion drive was robust, but it showed increasing wear over many (∼1000) uses and required occasional realignment. When errors occasionally occurred due to alignment, the printer required a manual reset in order to clear the memory and restart printing. Hence, the moving components (gears and racks) may need to be replaced over the lifetime of the bioprinter or could be constructed from sturdier materials.
image file: c4ra05932h-f4.tif
Fig. 4 Print accuracy and precision of the modified printer are similar to those of the unmodified printer. (a) A 7 × 8 grid containing a box-in-a-box pattern was used to quantify the accuracy and precision of the printed image. (b) Data analysis procedure: top left, the binarized image of the box-in-a-box pattern. Top right, the corresponding edges images computed with a Sobel filter. Bottom, the sum of the edges along the y-axis as a function of the x-axis produced peaks where the edges of the boxes could be easily defined (black, red, and blue denote outside, middle, and center boxes, respectively). (c) and (d) The resulting change in the position of the box along a given axis versus the intended position of the box. N represents the number of box lengths used to obtain each point and the associated error bars are one standard deviation.

To characterize the accuracy and precision of the modified printer, we used the standard box-in-a-box alignment mark31,32 typically used in wafer fabrication. We drew a 7 × 8 grid of the box-in-a-box pattern (Fig. 4a). The box sizes were 25.206 mm, 12.603 mm, and 1.401 mm with line widths of 0.706 mm, 0.353 mm, and 0.176 mm, respectively. We printed the box-in-a-box image on five separate sheets of paper and scanned the image with a flatbed scanner at 600 dpi.

We analyzed these printed box-in-a-box patterns by converting the image to grayscale, cropping each box-in-a-box pattern to the same position, binarizing it, and summing it in the x- and y-directions separately to obtain distinct peaks (summing in the y-direction is shown in Fig. 4b). From these peaks, we obtained three independent measurements: the width of the box and both line widths at the far and near edges. This procedure was carried out for every box along each axis. For the 1.401 mm box, we only computed the width of the box to simplify the analysis. We also obtained the centroid of each box, which was ultimately sufficient to characterize the print performance. The orientation of the y-axis of the page relative to the printer and scanner was within 0.1° and we verified the alignment by tracking the edge of the page for the five prints. More details are provided in the ESI Section IV along with the analysis code (Supplemental Materials, bibanalysis.m).

Following the standard box-in-a-box approach,31,32 we were able to characterize the behavior of the modified bioprinter. Fig. 4c and d shows the difference between the intended position of the box and the actual position of the box as a function of intended position for each axis. A linear trend as a function of the y-position is observed, which resulted from a mismatch of the spur gear pitch diameter (12.30 mm) relative to the diameter of the paper feed shaft (12.13 mm). The cumulative offset was 2.8 mm for a 297 mm-long page. The average accuracy of the modified printer was 0.22 mm ± 0.02 mm (x-position) and 1.21 mm ± 0.10 mm (y-position), which was comparable to those of the unmodified printer. Note that the accuracy values are of primary relevance when it comes to repeated printing over the same area, but less so for a single print.

IV. Applications in bioprinting

Various bioprinting applications with modified ink-jet printers have been demonstrated in the literature, many of which can also be performed with our platform.1–14 Since the current investigation focused on the hardware aspects of the bioprinter, we only demonstrate three examples of applications that were specifically enabled by the larger print area and simultaneous imaging capability of this device. These example applications used various E. coli strains (TOP10) that had been transformed with plasmids expressing the fluorescent proteins Cerulean, mCherry, and Venus.33 Live cells were incubated overnight at 37 °C in lysogeny broth (LB) supplemented with chloramphenicol to select for cells carrying the vectors with the fluorescent proteins. The cell suspension was then loaded directly into cleaned ink cartridges.12 We were able to use both three-color (deposition of multiple strains) and black ink cartridges (deposition of a single strain). We found that we were able to print many water-based liquids without modification. In some cases, we also found that sucrose could be used to tune the viscosity and improve the print performance.26

For simultaneous printing of multiple strains, we loaded the fluorescent strains into the cyan (Cerulean), magenta (mCherry), and yellow (Venus) reservoirs of a three-color cartridge. Once this “bio-ink” was loaded into the cartridge, we printed various patterns of cells onto chloramphenicol-supplemented LB agar cast in Petri dishes (Fig. 5a, left). In this experiment, we inverted the image to achieve the correct colors in the printed composite. The printed plate was incubated at 37 °C for six hours to promote E. coli growth and then imaged with a conventional fluorescence microscope (Leica M205FA, DFC310FX, LAS AF). To create these images, we used a panoramic stitching program (Microsoft Image Composite Editor) to join 40 images; the total image size was limited by the fluorescence microscope. Once the panoramic stitching program assembled the Cerulean, mCherry, and Venus channels, we recombined the images to create the composite image by converting the channels to grayscale, tuning the contrast of each image separately to account for saturation. We then assigned the images to the cyan, magenta, and yellow channels to create a single image, which was inverted to obtain the composite image (Fig. 5b, right). We noticed that the image from the cyan channel had large streaks, likely due to partially clogged or damaged nozzles.9 Despite this imperfection, images of comparable print quality were typical for this bioprinter and were very accurate over a distance in comparison to the literature.6–14


image file: c4ra05932h-f5.tif
Fig. 5 The modified printer simultaneously deposits multiple fluorescently labeled E. coli strains onto an agar surface utilizing a three-color ink cartridge. (a) Bioprinter configured for two 150 mm Petri dishes with Physarum polycephalum cultures. A white paper sheet was added for contrast. (b) Left panels show the individual cyan, magenta, and yellow channels imaged over the same area. Each channel consists of an E. coli strain that had been transformed with custom-designed vectors to express a single fluorescent protein. The composite image is the inverted combination of each channel. Other than modifying the intensity of each channel for combination in composite, the images are unaltered.

Next, we assessed whether the imaging component of the system was capable of capturing quantitative bacterial growth data over time. In these experiments, we loaded the black cartridge with wild-type E. coli (i.e., a lab strain that did not express a fluorescent protein) and removed the color cartridge from the printer. We printed four grayscale values, nominally 100%, 50%, 25%, and 12.5%, demonstrating that we were able to tune the initial number of cells in the bacterial colony deposited on the plate. Each printed colony had an initial diameter of 5 mm. The colonies were imaged with the flatbed scanner every 30 min for a total of 60 hours at room temperature to quantify the growth of wild-type E. coli (Fig. 6a). To understand the growth of the E. coli, we performed a few image processing steps (see ESI Section V) to obtain the colony area fraction. After repeating the experiment five times, we obtained the mean and standard deviation of the colony area fraction, which we normalized by the mean colony area fraction of the 100% culture at 60 h.


image file: c4ra05932h-f6.tif
Fig. 6 The bioprinter-imaging platform enables quantitative measurement of bacterial growth and color-based separation of fluorescently labeled E. coli. (a) Growth curves for diluted cell suspensions were obtained via grayscale values acquired with the scanner at room temperature. The solid lines are fits to the data with the Baranyi model. Selected images from the scanner at 25 h, 35 h, and 45 h for the 100% grayscale print are shown. For these images, we modified the contrast for better visibility. Error bars: standard error of the mean for five replicates. (b) Truecolor image from the scanner after background subtraction, and the same image in the mCherry (m), Venus (V), and Cerulean (C) colormap spaces. WT, wild-type. (c) Three-color plots used to transform the RGB colormap into mCherry, Venus, and Cerulean colormaps. The gray circles are the background, which we set to zero.

To quantitatively compare our growth curves to other results in the literature, we fit each curve independently to the Baranyi model (solid lines in Fig. 6a).34 The Baranyi model is given as,

 
image file: c4ra05932h-t1.tif(1)
where μmax is related to the doubling time, λ is related to the lag time, yf is the natural logarithm of the final area, and yo is the natural logarithm of the initial area.34 From eqn (1), we obtained colony area doubling times (tarea = ln(μmax)/2) ranging from 4.06 h to 4.76 h. Since the conventional population doubling time is proportional to the volume of a colony, we expected our area doubling time to be related by tvol = tarea2/3. This calculation yielded doubling times from 38 min to 43 min for our cultures, which was reasonable given that these experiments were performed at room temperature and growth may have occurred in three dimensions. The remaining fit parameters are shown in Table 1.

Table 1 Fit parameters for Baranyi model
Dilution yf [au] μmax [1/h] λ [h] yo [au]
100% 8.60 0.15 5.00 2.83
50% 8.13 0.16 12.50 2.57
25% 7.85 0.17 12.50 1.68
12.5% 7.39 0.15 22.80 3.04


Next, we sought to demonstrate that the scanner could be used to distinguish fluorescent strains based on the visible color measured by the scanner. Given the ubiquitous usage of fluorescent probes, this feature would enable a much wider range of applications in the life sciences. To demonstrate this ability in an unmodified scanner, we manually plated the Cerulean, Venus, mCherry, and wild-type strains individually onto chloramphenicol-supplemented LB agar plates, incubating the plates at 37 °C for six hours, and then imaged the colonies with the scanner (Fig. 6b). The resulting image contains information in the standard red-green-blue (RGB) channels. We computed a linear regression from the mean color value to the origin of the plot for each of the strains in this RGB space. As an example, the red-green sub-space is shown in Fig. 6c. These regression lines were then used to create a color map transformation from the RGB space into the “mCherry, Venus, Cerulean” color space (Fig. 6b). This approach enabled us to use the scanner to differentiate between the mCherry- and Venus-labeled strains; however, the Cerulean-labeled strain was not easily distinguished from the wild-type. Higher expression levels or adapting the scanner for fluorescence imaging would yield additional color-separation capabilities.

V. Conclusions

Here we have re-engineered a commercial inkjet printer and flatbed scanner into an integrated fluid-deposition imaging platform by leveraging much of the unmodified architecture of hardware and software, rather than developing new software or custom microcontrollers. This design approach is therefore amenable for integration within a standard desktop and network environments, and the performance (speed, accuracy, precision) is close to that of the unmodified hardware. Some of the shortcomings that we discussed, which are intrinsic to reverse engineering, could be overcome in a commercial mass-market product. For example, adding optimized filters could enable fluorescent imaging and the calibration cycle could be omitted in the printer firmware. Although commercial instrumentation will not likely use our mechanical solutions, this work demonstrates that the existing infrastructure can be adapted to facilitate life-sciences experimentation over a network without extensive programming or custom software.

The presented platform can print a wide variety of “bio-inks” beyond the E. coli inks tested here, such as sugar water, salt water, and many of the nonconventional inks demonstrated in previous reports.4 To showcase these new capabilities, we used this bioprinter to create complex cell depositions over a large area with accuracies that were comparable to those of an unmodified printer. Furthermore, the distance between print head and the support surface (i.e., scanner) can be modified with rubber lifts to easily accommodate different substrates, materials, and plastic-ware. By integrating a scanner, we added another dimension to consumer-based bioprinting research, enabling real-time monitoring of deposited cells and fluids or automated feedback. Such capabilities could enable the deposition of complex chemical gradients, experiments to study the relationships between different cell cultures, studies on quorum sensing, and other applications including drug discovery.1–14,18

In summary, the large-area bioprinter with integrated imaging presented here could facilitate bioengineering research, and even empower science education, both locally and on-line.35–38

Acknowledgements

The BioX IIP Grant at Stanford University and the Stanford Dean's Postdoctoral Fellowship Program supported this research. Component fabrication was performed at the Product Realization Laboratory and the Department of Bioengineering at Stanford University. NDO and IHRK conceived and designed the hardware, and the experiments. CT and SK assisted with the experiments, hardware assembly, and design. NC, VW, and AH helped perform the experiments with E. coli. SC assisted with data analysis. We thank Peter Redl, Alice M. Chung, Zahid Hossain, David Glass, and Paulo Blikstein for their insightful discussions during the course of this research.

References

  1. T. Xu, J. Jin, C. Gregory, J. J. Hickman and T. Boland, Inkjet printing of viable mammalian cells, Biomaterials, 2005, 26(1), 93–99 CrossRef CAS PubMed.
  2. T. Boland, T. Xu, B. Damon and X. Cui, Application of inkjet printing to tissue engineering, Biotechnol. J., 2006, 1(9), 910–917 CrossRef CAS PubMed.
  3. V. Mironov, N. Reis and B. Derby, Bioprinting: A beginning, Tissue Eng., 2006, 12(4), 631–634 CrossRef PubMed.
  4. B. Derby, Bioprinting: inkjet printing proteins and hybrid cell-containing materials and structures, J. Mater. Chem., 2008, 18(47), 5717–5721 RSC.
  5. Y. Nishiyama, M. Nakamura, C. Henmi, K. Yamaguchi, S. Mochizuki, H. Nakagawa and K. Takiura, Development of a Three-Dimensional Bioprinter: Construction of Cell Supporting Structures Using Hydrogel and State-Of-The-Art Inkjet Technology, J. Biomech. Eng., 2009, 131(3) CrossRef PubMed , 035001.
  6. M. E. Pepper, C. A. Parzel, T. Burg, T. Boland, K. J. L. Burg and R. E. Groff, Design and implementation of a two-dimensional inkjet bioprinter, Conf. Proc. IEEE Eng. Med. Biol. Soc., 2009, 2009, 6001-5 Search PubMed.
  7. K. W. Binder, W. Zhao, T. Aboushwareb, D. Dice, A. Atala and J. J. Yoo, In situ bioprinting of the skin for burns, J. Am. Coll. Surg., 2010, 211(3), S76–S76 CrossRef PubMed.
  8. K. Jakab, C. Norotte, F. Marga, K. Murphy, G. Vunjak-Novakovic and G. Forgacs, Tissue engineering by self-assembly and bio-printing of living cells, Biofabrication, 2010, 2(2) CrossRef CAS PubMed , 022001.
  9. K. W. Binder, A. J. Allen, J. J. Yoo and A. Atala, DROP-ON-DEMAND INKJET BIOPRINTING: A PRIMER, Gene Ther. Regul., 2011, 06(01), 33–49 CrossRef CAS.
  10. B. Guillotin and F. Guillemot, Cell patterning technologies for organotypic tissue fabrication, Trends Biotechnol., 2011, 29(4), 183–190 CrossRef CAS PubMed.
  11. F. Marga, K. Jakab, C. Khatiwala, B. Shepherd, S. Dorfman, B. Hubbard, S. Colbert and F. Gabor, Toward engineering functional organ modules by additive manufacturing, Biofabrication, 2012, 4(2) CrossRef PubMed , 022001.
  12. A. B. Owczarczak, S. O. Shuford, S. T. Wood, S. Deitch and D. Dean, Creating transient cell membrane pores using a standard inkjet printer, J. Visualized Exp., 2012,(61), 3681-1 Search PubMed.
  13. M. E. Pepper, V. Seshadri, T. C. Burg, K. J. L. Burg and R. E. Groff, Characterizing the effects of cell settling on bioprinter output, Biofabrication, 2012, 4(1) CrossRef PubMed , 011001.
  14. P. D'haeseleer, DIY Bioprinter, Instructables.com, 2013. http://www.instructables.com/id/DIY-BioPrinter/. accessed: 04 July 2013.
  15. A. M. Tan, K. Rodgers, J. P. Murrihy, C. O'Mathuna and J. D. Glennon, Rapid fabrication of microfluidic devices in poly(dimethylsiloxane) by photocopying, Lab Chip, 2001, 1(1), 7–9 RSC.
  16. A. Yusof, H. Keegan, C. D. Spillane, O. M. Sheils, C. M. Martin, J. J. O'Leary, R. Zengerle and P. Koltay, Inkjet-like printing of single-cells, Lab Chip, 2011, 11(14), 2447–2454 RSC.
  17. W. Shen, M. Li, C. Ye, L. Jiang and Y. Song, Direct-writing colloidal photonic crystal microfluidic chips by inkjet printing for label-free protein detection, Lab Chip, 2012, 12(17), 3089–3095 RSC.
  18. G. Arrabito, C. Galati, S. Castellano and B. Pignataro, Luminometric sub-nanoliter droplet-to-droplet array (LUMDA) and its application to drug screening by phase I metabolism enzymes, Lab Chip, 2013, 13(1), 68–72 RSC.
  19. A. Apilux, Y. Ukita, M. Chikae, O. Chailapakul and Y. Takamura, Development of automated paper-based devices for sequential multistep sandwich enzyme-linked immunosorbent assays using inkjet printing, Lab Chip, 2013, 13(1), 126–135 RSC.
  20. S. Fujita, R. Onuki-Nagasaki, J. Fukuda, J. Enomoto, S. Yamaguchi and M. Miyake, Development of super-dense transfected cell microarrays generated by piezoelectric inkjet printing, Lab Chip, 2013, 13(1), 77–80 RSC.
  21. H. Minemawari, T. Yamada, H. Matsui, J. Tsutsumi, S. Haas, R. Chiba, R. Kumai and T. Hasegawa, Inkjet printing of single-crystal films, Nature, 2011, 475(7356), 364–367 CrossRef CAS PubMed.
  22. B. Parkinson, Distributed research: a new paradigm for undergraduate research and global problem solving, Energy Environ. Sci., 2010, 3(5), 509–511 CAS.
  23. P. L. Ryan, R. A. Foty, J. Kohn and M. S. Steinberg, Tissue spreading on implantable substrates is a competitive outcome of cell–cell vs. cell–substratum adhesivity, Proc. Natl. Acad. Sci., 2001, 98(8), 4323–4327 CrossRef CAS PubMed.
  24. F.-Q. Nie, M. Yamada, J. Kobayashi, M. Yamato, A. Kikuchi and T. Okano, On-chip cell migration assay using microfluidic channels, Biomaterials, 2007, 28(27), 4017–4022 CrossRef CAS PubMed.
  25. Y. Mei, C. Cannizzaro, H. Park, Q. Xu, S. R. Bogatyrev, K. Yi, N. Goldman, R. Langer and D. G. Anderson, Cell-Compatible, Multicomponent Protein Arrays with Subcellular Feature Resolution, Small, 2008, 4(10), 1600–1604 CrossRef CAS PubMed.
  26. R. E. Jones, W. Zheng, J. C. McKew and C. Z. Chen, An Alternative Direct Compound Dispensing Method Using the HP D300 Digital Dispenser, J. Lab. Autom., 2013, 367-74 Search PubMed.
  27. I. Levin-Reisman, O. Gefen, O. Fridman, I. Ronin, D. Shwa, H. Sheftel and N. Q. Balaban, Automated imaging with ScanLag reveals previously undetectable bacterial growth phenotypes, Nat. Methods, 2010, 7(9), 737–739 CrossRef CAS PubMed.
  28. M. D. Mathew, N. D. Mathew and P. R. Ebert, WormScan: A Technique for High-Throughput Phenotypic Analysis of Caenorhabditis elegans, PLoS ONE, 2012, 7(3), e33483 CAS.
  29. Z. Göröcs, Y. Ling, M. D. Yu, D. Karahalios, K. Mogharabi, K. Lu, Q. Wei and A. Ozcan, Giga-pixel fluorescent imaging over an ultra-large field-of-view using a flatbed scanner, Lab Chip, 2013, 13(22), 4460–4466 RSC.
  30. M. Gottfredson and K. Aspinall, Innovation versus complexity: What is too much of a good thing?, Harvard. Bus. Rev., 2005, 83(11), 62–71 Search PubMed.
  31. M. Adel, M. Ghinovker, J. Poplawski, E. Kassel, P. Izikson, I. Pollentier, P. Leray and D. Laidler, Characterization of overlay mark fidelity, in Metrology, Inspection, and Process Control for Microlithography Xvii, Pts 1 and 2, ed. D. J. Herr, Spie-Int Soc Optical Engineering, Bellingham, 2003, vol. 5038, pp. 437–444 Search PubMed.
  32. M. Adel, M. Ghinovker, B. Golovanevsky, P. Izikson, E. Kassel, D. Yaffe, A. M. Bruckstein, R. Goldenberg, Y. Rubner and M. Rudzsky, Optimized overlay metrology marks: theory and experiment, IEEE Trans. Semicond. Manuf., 2004, 17(2), 166–179 CrossRef.
  33. N. C. Shaner, P. A. Steinbach and R. Y. Tsien, A guide to choosing fluorescent proteins, Nat. Methods, 2005, 2(12), 905–909 CrossRef CAS PubMed.
  34. J. Baranyi and T. A. Roberts, A dynamic approach to predicting bacterial growth in food, Int. J. Food Microbiol., 1994, 23(3–4), 277–294 CrossRef CAS.
  35. M. Windschitl, J. Thompson and M. Braaten, Beyond the scientific method: Model-based inquiry as a new paradigm of preference for school science investigations, Sci. Educ., 2008, 92(5), 941–967 CrossRef PubMed.
  36. I. H. Riedel-Kruse, A. M. Chung, B. Dura, A. L. Hamilton and B. C. Lee, Design, engineering and utility of biotic games, Lab Chip, 2010, 11(1), 14–22 RSC.
  37. G. Olympiou and Z. C. Zacharia, Blending physical and virtual manipulatives: An effort to improve students' conceptual understanding through science laboratory experimentation, Sci. Educ., 2012, 96(1), 21–47 CrossRef PubMed.
  38. P. Blikstein, Bifocal modeling: a study on the learning outcomes of comparing physical and computational models linked in real time, 2012, p. 257–264 Search PubMed.

Footnote

Electronic supplementary information (ESI) available. See DOI: 10.1039/c4ra05932h

This journal is © The Royal Society of Chemistry 2014
Click here to see how this site uses Cookies. View our privacy policy here.