DOI:
10.1039/C4RA05872K
(Paper)
RSC Adv., 2014,
4, 33127-33133
Selectively self-assembling graphene nanoribbons with shaped iron oxide nanoparticles
Received
17th June 2014
, Accepted 14th July 2014
First published on 16th July 2014
Abstract
Nanoflower and nanoplate-shaped iron oxide nanoparticles (FeNPs) were attached onto graphene nanoribbons (GNRs). Raman spectra of FeNP–GNRs reveal red-shifted G-bands along with greatly reduced D-band intensity, indicating a surface-smooth and electron-doped assembly on GNR. Distinctive decorative patterns are associated with unique sizes, shapes, and crystallinities of FeNPs. FeNP-nanoflowers are predominately attached around the edges of the GNRs; whereas multilayer GNRs are sandwich-stacked with FeNP-nanoplates. With the attachment of IgG antibodies, FeNP–GNRs–IgG depict distinguishable aggregation features, which have potential advantages as biosensors to target tumor cells with over-expressed folic acid.
Introduction
Iron oxide nanoparticles (FeNPs) are candidates for biomedical applications such as imaging and therapy.1,2 FeNPs have been used for industrial separations and catalysis owing to their high magnetic suspensibility.3 In addition, the size, morphology and shapes of FeNPs impact on their magnetic properties and biocompatibility.4–6 Compared to nanospheres, non-spherical FeNPs have advantages in biomedical applications, particularly with improved circulation time of blood.7 Furthermore, FeNPs with tunable size, shape, and surface properties are desirable for biomedical application, because they have different spin–lattice (T1) and spin–spin (T2) relaxation time contrast, and thus, they are useful for magnetic resonance imaging (MRI) or hyperthermia cancer treatment.1,2,8,9 Recently, FeNPs of nanoplate and nanoflower were prepared for potential biomedical application through the decomposition of iron oleate complex via the ‘heat-up’ method.4–6
Modification of graphene nanoribbons (GNR) on the molecular level with metal nanoparticles is an example of a ‘bottom-up’ fabrication route toward nanoscale devices.10–13 One-atom thickness and planar graphene structure can be employed for effective donor/acceptor interfaces of charge transfer between metal nanoparticles and GNRs.10,11 Moreover, functionalized graphene has attractive physicochemical properties, for example, biocompatible for drug carrier, good physiological stability and low cytotoxicity. Disparate functional groups on graphene surfaces (such as carboxylic or hydroxyl) can be utilized for both covalent and noncovalent functionalization graphene with nanoparticles.14–16 Such functional groups can carry specific biomolecule moieties like protein and DNA, which helps make nanohybrid dispersible and biocompatible in a physiological environment.14,15
However, there are a paucity of reports regarding the decoration of FeNPs onto graphene nanoribbons.8,16–21 For instance, coating FeNPs with few-layer graphene ensures the long-term stability of the core of FeNPs under biological environments.8 Formation of composites of dextran-coated Fe3O4 nanoparticles and graphene oxide (Fe3O4–GO) leads to prospective application in magnetic resonance imaging (MRI) as T2-weighted contrast agent.16 The electrochemical performance of Fe3O4 nanoparticle–graphene oxide nanocomposites has been evaluated for lithium ion batteries and electrochemical capacitor.17–21 GNRs can be synthesized by longitudinal unzipping multi-walled carbon nanotubes (MWNT) by oxidation.22 The oxidation process inevitably results in hole-doped GNR, which is typically in a semiconducting state.21,22 Although efforts have been made toward reduction of oxygen on GNR surface by hydrazine chemical treatment, it remains a challenging task to effectively control oxidation process.
Experimental
Materials
The GNR was obtained by unzipping multiwall carbon nanotubes by oxidation22 (MWCNTs, Lot# MRCMW10, 60 nm diameter and 5–6 μM length, MER cooperation, Tucson AZ 85706 with purity >90%). The iron oxide nanoflowers (∼20 nm) and nanoplates (size ∼18 nm, 3 nm thick) in octadecene (Fig. 1) were obtained through the decomposition of iron oleate via the ‘heat-up’ method.6 The solvents used for experiments, such as chloroform and hexane were purchased with purity of 99.9% from Sigma-Aldrich Company. IgG antibody (P-17, SC-34665, 36 kDa) and anti-rabbit green florescence protein (GFP) was also purchased from Sigma-Aldrich Company.
Forming GNR–FeNPs nanocomposite
FeNPs solution (1 mL) of nanoflowers or nanoplates in octadecene (13 mg mL−1) (Fig. 1) were added with 10 mg graphene nanoribbon in 100 mL chloroform, which was previously sonicated for 5 min. The mixture of GNRs and FeNPs was then stirred vigorously for 1 hour and sonicated again for an extra 10 min. After sonication, the mixture was kept stirring for 2 days at the room temperature. To separate products from the mixture, the solution was filtered through 0.5 μm PTFE membrane by Millipore® filtering system to remove unattached FeNPs in the chloroform. The black filter cakes on the membrane were washed with 200 ml hexane and 200 mL chloroform to remove the residue of FeNPs on the surfaces of GNR. The PTFE membrane of filter cake was then sonicated in 50 mL hexane for 10 minutes again to form a black dispersion solution. The dispersed hexane solution contained the final nanocomposite products and GNRs that are not attached with FeNPs. Such mixture of hexane solution was then concentrated to 25 mL volume and transferred into a tall 25 mL glass cylinder. The bottom of cylinder was surrounded with a strong iron magnet. The solution was kept precipitated for 12 hours under magnetic field. The unattached GNRs of the upper-layer were decanted from the solution. The nanocomposite of FeNPs–GNR was left at the bottom of glass cylinder. After washing with hexane and decanting several times, the products were purified and dried under vacuum. GNR–FeNP-nanoflower (11.2 mg) or nanoplates (14.6 mg) were obtained.
Characterization
AFM was performed using a Veeco Thermo-microscope CP Research AFM instrument in non-contacted tapping mode with a silicon tip. The GNR–FeNP AFM image was obtained at room temperature in air on SiO2 plate surfaces. UV-vis spectra were recorded using a Beckman DU640 spectrophotometer with THF. Raman spectroscopy was performed on a Thermo Scientific Nicolet Almega XR Micro and Macro-Raman Analysis System. The laser source was a wavelength of 488 nm. IR studies were carried out on a Perkin Elmer FTIR Spectrum 65. The size and morphology of FeNPs were examined on a FEI Tecnai F-20 transmission electron microscope (TEM). High-resolution scanning electron microscopy (SEM) images were recorded using a Zeiss SEM Ultra 60 scanning electron microscope. Cyclic voltammogram (CV) was measured in chloroform on PARSTAT® 2263 made by Princeton Applied Research Inc with a working electrode of solid electrode (working electrode area is 1.000 cm2) and reference electrode of Ag, AgCl/NaCl (saturated) (0.194 V).
Anti-rabbit green florescence protein (GFP, 0.2 mg mL−1) was dropped onto and allowed to attach to the slides for 10 min, which have IgG antibody (2 × 10⁻⁶ μg mL−1) coated FeNP–graphene; and then washed with deionized water to remove unattached protein from the surface for fluorescence microscopic imaging. The fluorescence microscope of Zeiss axioimager Z1 attached with Apotome attachment was used for the acquisition of digital multi-channel fluorescence images using wide-field, structured illumination filter cubes for GFP.
First-principles calculations
Since the GNRs synthesized from unzipping MWNTs have width more than 200 nm, the edge effect of ribbons can be neglected. For this reason, we considered graphene instead of GNRs. Our first-principles calculations were based on general gradient approximation (GGA) with the exchange correlation of Perdew–Burke–Ernzerhof (PBE) parametrization.35 We employed the dispersion correction using the Tkatchenko–Scheffler (TS) scheme,36 which exploits the relationship between polarizability and volume. The TS dispersion correction takes into account the relative variation in dispersion coefficients of various atomic bonding. Weighting values are extracted from the high-quality ab initio database with atomic volumes derived from partitioning of the self-consistent electronic density. A 5 × 5 cell in the plane direction with a vacuum space of 17.6 Å normal to the graphene plane was used. A kinetic energy change of 3 × 10⁻⁴ eV in the double numerical orbital basis was sufficient to converge with the integration of the charge density. The optimization of the atomic positions proceeds until the change in energy is less than 1 × 10⁻⁵ eV per cell.
 |
| | Fig. 1 The scheme of iron oxide nanoparticles structure and TEM images of (a) FeNP-nanoplates; (b) HRTEM of FeNP-nanoplates; (c) FeNP-nanoflowers; and (d) HRTEM of FeNP-nanoflowers. | |
Results and discussion
We found that different crystalline nanostructures of iron oxide nanoparticles lead to distinctive self-assembling motifs onto GNRs. FeNP-nanoflowers are mainly attached around the fringes of GNRs, while FeNP-nanoplate have the tendency to aggregate on the surface of GNRs. As a result, by controlling the nanoshapes of FeNPs, we can select the decoration positions of GNR surfaces to form well-ordered FeNP–GNR nanohybrids. Such a position preference of decoration FeNPs onto GNRs is poised to find applications in cancer treatment8,9,16 and material application.37–39 In our study, position control of FeNPs on GNR surfaces will benefit the aggregation preference of IgE antibody with nanohybrid. It influences FeNP–GNR properties as IgG biosensor.
UV-vis spectra
Seen from Fig. 2, FeNP spectrum on itself demonstrated a shoulder peak at 358 nm of iron d–d transitions and the characteristic ligand-to-metal charge transfer (LMCT) below 300 nm.30 GNRs have a weak shoulder peak around 310 nm attributed to the π–π* transitions of the carbonyl group formed by oxidation.31 After graphene decoration with FeNP-nanoplate, a peak appeared at 272 nm, which was attributed to π–π* transition of graphene C![[double bond, length as m-dash]](https://www.rsc.org/images/entities/char_e001.gif) C double bond. FeNP-nanoplates attachment onto GNR surface was confirmed by the peak of GNR–FeNP-nanoplates at 357 nm that is attributed to FeNP d–d transition. The corresponding peaks of GNR–FeNPs-nanoflower are located at 264 and 353 nm, respectively. A shoulder peak at 561 nm is attributed to iron d–d transitions of pair excitations (6A1 → 4T1).23,24 As seen from UV-vis (Fig. 2) spectra, there exists a slight shift of both d–d and π–π* transition peaks, and intensity variation of characterized GNR absorbance peaks, implying interaction between GNR and FeNPs.32 Comparing UV-vis spectra of GNR–FeNP-nanoflowers with GNR–FeNP-nanoplates, there is little difference in the peak associated with the FeNPs' d–d transition, while there is evident blueshift of the graphene π–π* peaks for nanoflowers, indicating different assembly patterns.
C double bond. FeNP-nanoplates attachment onto GNR surface was confirmed by the peak of GNR–FeNP-nanoplates at 357 nm that is attributed to FeNP d–d transition. The corresponding peaks of GNR–FeNPs-nanoflower are located at 264 and 353 nm, respectively. A shoulder peak at 561 nm is attributed to iron d–d transitions of pair excitations (6A1 → 4T1).23,24 As seen from UV-vis (Fig. 2) spectra, there exists a slight shift of both d–d and π–π* transition peaks, and intensity variation of characterized GNR absorbance peaks, implying interaction between GNR and FeNPs.32 Comparing UV-vis spectra of GNR–FeNP-nanoflowers with GNR–FeNP-nanoplates, there is little difference in the peak associated with the FeNPs' d–d transition, while there is evident blueshift of the graphene π–π* peaks for nanoflowers, indicating different assembly patterns.
 |
| | Fig. 2 UV-vis spectra of GNRs decorated with FeNP-nanoflower and nanoplates. | |
FT-IR spectra
As seen from the FT-IR spectra (Fig. 3), different nano-shaped FeNPs show distinctive interaction patterns as in their observed spectra. GNR–FeNP-nanoflower shows a new narrow peak at 3802 cm−1 that is the hydroxyl stretching groups of oleic acid on the GNR plane. The typical vibration bands of C–H at 1559, 1430 and 1103 cm−1 belong to the aliphatic and hydrophobic chain of FeNP ligands. In addition, there is enhanced vibration intensity at 570 cm−1, consistent with Fe–O vibrations of the Fe3O4 structure. FT-IR spectra further confirmed the interaction between iron oxide nanoparticles and GNR surfaces (Fig. 3). The peaks at 3300, 1628, 1069, and 686 cm−1 in the GNR FT-IR spectrum are attributed to hydroxyl stretching groups on the plane, carboxyl groups located at the edges of sheets, the stretching vibration of alkoxy C–O, and aromatic ring out-plane vibration, respectively.24 The characteristic peaks of GNR (at 3300, 1628, and 1069 cm−1) are dormant in the spectra of FeNPs–GNR, which implies that carboxyl groups on the fringes and plane of GNR interact preferably with iron oxide nanoparticles.35 The much-weakened intensity of these peaks is reminiscent of the strong interaction between GNR and FeNPs (Fig. 3). With different shapes of iron oxide nanoparticles attaching to GNRs, there exist characteristic vibration peaks in the corresponding spectra. GNR–FeNP-nanoflower shows characteristic graphene peaks; whereas, the spectra of GNR–FeNP-nanoplate are so weak that vibration peaks virtually depict the baseline. It indicates the strong interaction between GNR and FeNP-nanoplate. The multilayer stacking of FeNP-nanoplates on graphene surfaces caused its FT-IR peak intensity weak.
 |
| | Fig. 3 FT-IR spectra of GNRs decorated with FeNP-nanoflowers or nanoplates and pristine GNR. | |
The decoration of FeNPs onto GNR surfaces37–39 influences characteristic modes of Raman vibrations of defects and the sp2 graphene network, corresponding to the D- and G-bands, respectively.21,22 Shown in Fig. 4 are the Raman spectra of GNR–FeNPs-nanoplate and nanoflower.18,19 Utilizing the unzipping method, oxygen has been introduced on the edges and cause point defects in the lattice structure, which is reminiscent of blue-shifts in Raman G- and D-bands.19 Due to the tight surface contact between FeNP and GNRs, intrinsic defects of GNRs were covered with FeNPs. Functional groups in GNR defects, such as carboxylic and hydroxyl groups, turn to bond with the iron(II/III) oxide core of nanoparticles; therefore, GNR surfaces become much smoother after decoration with nanoparticles.
 |
| | Fig. 4 Raman spectra of FeNP-nanoplate/nanoflower on GNRs with a laser wavelength excited at 488 nm. | |
Raman spectroscopy
The longitudinal unzipped GNRs have the characteristic Raman peaks of graphene oxide G-band at 1603 cm−1, D-band at 1354 cm−1, and overtone 2D-band in 2600–3000 cm−1, respectively.12,13 In the case of FeNPs–GNR composites (Fig. 4), the Raman shift of G-band is close to the value of pristine graphene at 1570 cm−1, which is about 30 cm−1 red-shift from the 1600 cm−1 G-band of oxidized GNR.22 This implies that the self-assembly of FeNPs onto oxidative GNRs is a selective decoration process. FeNPs tends to interact strongly with the oxygen function groups on GNRs. As a result, FeNP–GNR nanohybrids are converted to electron-doped graphene characteristics, which is a stark contrast to the blue-shift for oxidative GNRs.21 The red-shift of G-band also indicates a strong interaction of GNR and FeNPs. For GNR–FeNP-nanoplate, the splitting 2D overtone peaks are located at 2326 and 2698 cm−1. The peak at 2326 cm−1 is characteristic of multilayer graphite sheets.11,12 Thus, this is referred to as “multilayer peak”. The multilayer sandwich-stacking of GNRs with FeNP-nanoplates leads to the Raman peak at 2326 cm−1, which serves as the characteristic signal of assembly pattern.
The D-bands, on the other hand, entail the defects in the assembly. It is worth noting that the unzipped GNRs have nearly equal intensity for G and D bands. By contrast, the suppression of D-band intensities (Fig. 4) indicates smooth surfaces of FeNP–GNRs, since the D-band intensity is closely associated with defect vibrations. While the reduction of the D-band is typical for self assembly nanostructures, the substantial reduction of the D-band in FeNP–GNR is remarkable, which strongly implies a site-selective decoration of the FeNPs, particularly for nanoflower-shaped FeNPs. As such, the FeNP–GNRs serve as a desired defect-free substrate for nanoscale hybrids.
First-principles calculations
To facilitate an in-depth understanding of the electron doping behavior, we performed first-principles calculations of electronic characteristics for the iron oxide ligand on graphene. The characteristic band structure uncovers down-ware shift of the linear dispersed π and π* bands at the Dirac point, which is reminiscent of electron doping (Fig. 5). As is characteristic to noncovalent functionalized graphene, there exist two types of bands. One type of band refers to flat bands associated with the iron oxide ligand, and the other type of bands is dispersive originated from graphene. In the absence of graphene, electrons in the HOMO and LUMO levels are localized. However, the interaction with graphene yields profound level hybridization between the dispersed bands and the flat bands, which result in delocalization of the corresponding HOMO- and LUMO-derived bands. The calculated band structure reveals that the iron oxide acts as charge donor, which is manifested by about 0.4 eV downward shift of the Dirac level crossing highlighted by the red circles in Fig. 5.
 |
| | Fig. 5 Calculated band structure of FeNP–GNR with iron oxide ligand, along with isosurface plots of the valence band maximum (VBM) and conduction band minimum (CBM). | |
Atomic force spectroscopy
AFM images uncovered different assembling patterns based on the size and shape of the nanoparticles. The GNRs were unzipped using an oxidative chemistry technique.25 During the unzipping process, oxidative nucleation sites were created, leading to oxygen functional groups in the sp2 network, which were located predominantly on the edges of the ribbon. The assembly-induced interactions between GNR and FeNPs promote charge transfer from iron metal center to GNR. There exist electrostatic interaction between iron ions(II/III) and carboxylic groups at the surface defect sites and fringes of GNRs. The long chain ligands trioctylphosphine oxide (TOPO) of FeNPs have hydrophobic interaction with GNR surfaces, which stabilizes the structure of FeNP–GNR nanocomposites. The shape of the FeNP-nanoplate is regular and has a larger planar surface than that of FeNP-nanoflower. Therefore, the nanoplate tends to overlap and cover the GNR surface, resulting in multilayer nanocomposite GNR–FeNP-nanoplate. The 2D image of GNR–FeNP-nanoplate depicts that FeNP-nanoplates mainly aggregate onto surface of GNR with height of 24–32 nm (Fig. 6a). The typical height from peaks to valleys is around 30–40 nm (Fig. 6c). For the topography of GNR–FeNP-nanoflower, FeNP-nanoflowers are predominantly distributed around the GNR fringes with height of 8–16 nm (Fig. 6b). The 3D topography of GNR–FeNP-nanoflower closely resembles a down-warping basin. The typical depth of a basin is around 4–8 nm (Fig. 6d).
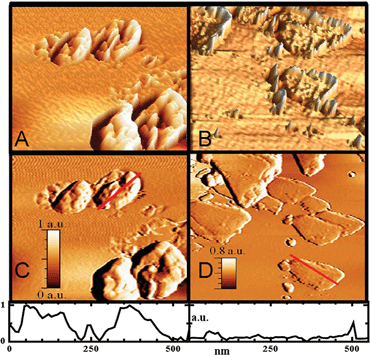 |
| | Fig. 6 (a) 3D AFM images of FeNP–GNR-nanoplates and (b) 3D AFM images of GNR–FeNP-nanoflower; (c) 2D AFM images and topologic line analysis of FeNP–GNR-nanoplates; and (d) 2D AFM images and topologic line analysis of GNR–FeNP-nanoflower (1 a.u. = 40 nm per div). | |
Scanning electronic spectroscopy
The MWNTs as received have a typical diameter of ∼60 nm before unzipping. The unzipped tubes have widths around 200 nm, based on high resolution SEM images (Fig. 7a), confirming that the tubes were fully unzipped into ribbons. The ribbons have a height of ∼0.50–0.75 nm indicating single layer ribbons. The stacking of GNRs can be seen in Fig. 7b and c. The height ranges from 2 to 8 nm, indicating multi-layer stacking of GNRs (AFM, Fig. 6d).26 The SEM image shown in Fig. 7b further confirms that FeNP-nanoflowers are attached to the surfaces and edges of GNRs; whereas Fig. 7c shows that there exists multiple aggregation of GNRs onto the surface of FeNP-nanoplates. The distinctive assembly patterns for nanoflowers and nanoplates suggest electronic and biosensor applications that take advantage of these features.
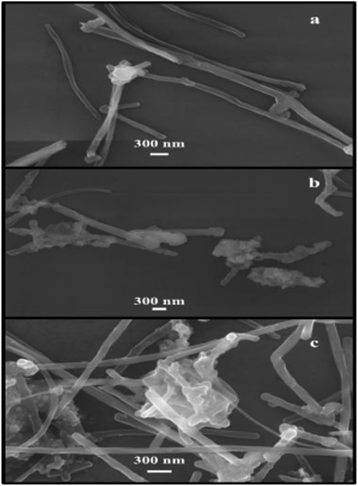 |
| | Fig. 7 The SEM image of GNRs and GNRs decoration with iron oxide nanoparticles: (a) GNRs (scale bar: 300 nm, 30 kX/10 kV); (b) FeNP-nanoflower on GNRs (scale bar: 300 nm, 30 kX/10 kV); and (c) FeNP-nanoflower on GNRs (scale bar: 300 nm, 40 kX/10 kV). | |
Cyclic voltammogram
The cyclic voltammogram behavior of FeNP-nanoflower in chloroform (1 mg mL−1) was studied (Fig. 8a). The redox couple in minus 2.0–1.0 V regions is Fe3+/Fe2+ of iron oxide, presumably the γ-Fe2O3/Fe3O4. When the sample of GNR–FeNP-nanoflower in chloroform (1 mg mL−1) was measured under the same experimental conditions, there is no such redox processing observed (Fig. 8b), and the electrochemical behavior was different from that of graphene.33,34 As an electronic scavenger, GNRs inhibit redox processing of FeNPs on their surface. FeNP-nanoplate showed the same electrochemical behavior as FeNP-nanoflower when decorated onto GNRs. Redox stability is crucial for GNR–FeNP biological applications as an effective biosensor.8 The oxidation process leads to dysfunction FeNP–GNR binding with proteins and antibody, along with oxidation Remarkably, it was found that the nanohybrid accomplishes redox stability, which is shown in cyclic voltammogram (CV) (Fig. 9). The redox stability of FeNP–GNR in chloroform has an advantage to prepare a stable biosensor.
 |
| | Fig. 8 Cyclic voltammetry of FeNP-nanoflower and its attachment onto GNRs. (a) FeNPs-nanoflower, (b) GNR–FeNP-nanoflower. Scanning rate is 25.00 mV s−1 working electrode is solid electrode with its area: 1.000 cm2. Reference electrode is the electrode is made of saturated Ag, AgCl/KCl (0.197 V). | |
 |
| | Fig. 9 Fluorescence microscopic images of GNRs–FeNP–IgG antibodies dyed with GFP protein illuminated by green fluorescent isothiocyanate (495 nm): (a) and (b) for GNR–FeNP-nanoflower–IgG antibodies dyed with GFP protein; (c) and (d) for GNR–FeNP-nanoplate–IgG antibodies dyed with GFP protein. | |
Fluorescence microscopy
To explore the feasibility of FeNP–GNRs as a biosensor, IgG antibodies were coated onto surfaces of nanocomposite. IgG antibodies have a high affinity for folic acid receptors.27 Folic acid receptors have elevated cell membrane expression in aggressively growing cancer cells.27 In fact, different types of cancer cells can be detected via folic acid receptor.28 Utilizing the FeNP–GNR nanocomposite with IgG antibody allows us to create an effective sensor for the detection of metastasized cancer cell in the blood.29 Fig. 9 shows the fluorescence microscope images of GNR–FeNP-nanoplate and nanoflower with IgG antibodies attached and stained with green fluorescent protein (GFP). GFP staining readily indicates the location of IgG antibodies illuminated by green light. It is worth pointing out that the assembly is pivotal to stable biosensing applications.
GNR–FeNP-nanoplate–IgG was tagged with anti-goat GFP and fixed onto a glass slide. Fig. 9a and c display microscope image with a compiled fluorescence illuminated by red, green, and blue light. Fluorescence image further confirms that IgG mainly aggregates to the edges of GNR because IgG prefers attaching to oxidative defects. The GNR–FeNP-nanoflowers have fewer IgG antibodies and form well-organized “fern-leafs” (Fig. 9b). The FeNP-nanoplate–GNR has abundant IgG antibodies on the edge (Fig. 9c) due to its larger surfaces. With profound attachment of IgG, the GNR–FeNP-nanoplate has promising applications in metastasized cancer cell detection with over-expressed folic acid receptors. Further studies are warranted to explore this hybrid nanomaterial as a cancer diagnostics tool.
Conclusions
Various sizes and shapes of FeNPs lead to different self-assembly motifs on the GNR surfaces, which is important for material application.37–39 Due to the irregular shape at nanoscale, FeNP-nanoflower distribute mainly on the edges of GNRs. In contrast, FeNP-nanoplates attach to the surface of the GNR. A ramification of the distinctive patterns is that the FeNP-nanoflower has weaker interaction with GNR than the FeNP-nanoplate counterpart. 2D-band splitting of Raman spectra in 2600–3000 cm−1 region demonstrates a multilayer sandwich nanostructure of GNR–FeNP-nanoplate. The extracted Raman spectra also show a red-shift in the G-band and apparent disappearance of the D-band, signifying that the resultant composite is electron doped, along with smooth composite surfaces. The self-assembly is particularly interesting in that GNR with a priori defects can retain the chemical properties of an oxidation-free ribbon. The redox stability shown in the cyclic voltammogram, (CV) permits the utilization of the nanohybrids for novel sensors. The present study also shows that IgG antibodies can be attached to GNR–FeNP nanocomposites, which can be tailored to detect cancer cells with over-expression of folic acids.
Acknowledgements
The authors wish to thank the National Science Foundation Grant no. HRD-11137751 and DMR-0934142. We also thank Dr G. Ananab in Biology Department of CAU and D. G. Reuven in Chemistry Department of CAU provide IgG antibody and GNR samples, respectively.
Notes and references
- M. Mahmoudi, S. Sant, B. Wang, S. Laurent and T. Sen, Adv. Drug Delivery Rev., 2011, 63, 24–46 CrossRef CAS PubMed.
- G. Vallejo-Fernandez, O. Whear, A. G. Roca, S. Hussain, J. Timmis, V. Patel and K. O'Grady, J. Phys. D: Appl. Phys., 2013, 46, 312001 CrossRef.
- A.-H. Lu, E. L. Salabas and F. Schueth, Angew. Chem., Int. Ed., 2007, 46, 1222–1244 CrossRef CAS PubMed.
- A. Shavel and L. M. Liz-Marzan, Shape, Phys. Chem. Chem. Phys., 2009, 11, 3762–3766 RSC.
- S. Palchoudhury, Y. Xu, A. Rushdi and Y. Bao, Chem. Commun., 2012, 48, 10499–10501 RSC.
- S. Palchoudhury, W. An, Y. Xu, Y. Qin, Z. Zhang, N. Chopra, R. A. Holler, C. H. Turner and Y. Bao, Nano Lett., 2011, 11, 1141–1146 CrossRef CAS PubMed.
- P. P. Karmali, Y. Chao, J.-H. Park, M. J. Sailor, E. Ruoslahti, S. C. Esener and D. Simberg, Mol. Pharmaceutics, 2012, 9, 539–545 CrossRef CAS PubMed.
- R. G. Mendes, A. Bachmatiuk, A. A. El-Gendy, S. Melkhanova, R. Klingeler, B. Buechner and M. H. Ruemmeli, J. Phys. Chem. C, 2012, 116, 23749–23756 CAS.
- H. Chen, X. Wu, H. Duan, A. Y. Wang, L. Wang, M. Zhang and H. Mao, ACS Appl. Mater. Interfaces, 2009, 1, 2134–2140 CAS.
- A. K. Geim, Science, 2009, 324, 1530–1534 CrossRef CAS PubMed.
- A. K. Geim and K. S. Novoselov, Nat. Mater., 2007, 6, 183–191 CrossRef CAS PubMed.
- Y. Wei, J. Wu, H. Yin, X. Shi, R. Yang and M. Dresselhaus, Nat. Mater., 2012, 11, 759–763 CrossRef CAS PubMed.
- J.-U. Park, S. W. Nam, M.-S. Lee and C. M. Lieber, Nat. Mater., 2012, 11, 120–125 CrossRef CAS PubMed.
- Z. Liu, J. T. Robinson, X. Sun and H. Dai, J. Am. Chem. Soc., 2008, 130, 10876–10877 CrossRef CAS PubMed.
- L. Zhang, J. Xia, Q. Zhao, L. Liu and Z. Zhang, Small, 2010, 6, 537–544 CrossRef CAS PubMed.
- W. Chen, P. Yi, Y. Zhang, L. Zhang, Z. Deng and Z. Zhang, ACS Appl. Mater. Interfaces, 2011, 3, 4085–4091 CAS.
- G.-W. Zhou, J. Wang, P. Gao, X. Yang, Y.-S. He, X.-Z. Liao, J. Yang and Z.-F. Ma, Ind. Eng. Chem. Res., 2013, 52, 1197–1204 CrossRef CAS.
- H. He and C. Gao, ACS Appl. Mater. Interfaces, 2010, 2, 3201–3210 CAS.
- L. Ji, Z. Tan, T. R. Kuykendall, S. Aloni, S. Xun, E. Lin, V. Battaglia and Y. Zhang, Phys. Chem. Chem. Phys., 2011, 13, 7170–7177 RSC.
- D. Chen, W. Wei, R. Wang, J. Zhu and L. Guo, New J. Chem., 2012, 36, 1589–1595 RSC.
- D. R. Reuven, H. Li, I. I. Harruna and X.-Q. Wang, J. Mater. Chem., 2012, 22, 15689–15694 RSC.
- D. V. Kosynkin, A. L. Higginbotham, A. Sinitskii, J. R. Lomeda, A. Dimiev, B. K. Price and J. M. Tour, Nature, 2009, 458, 872–876 CrossRef CAS PubMed.
- M.-Y. Liao, P.-S. Lai, H.-P. Yu, H.-P. Lin and C.-C. Huang, Chem. Commun., 2012, 48, 5319–5532 RSC.
- Y. Jin, S. Huang, M. Zhang, M. Jia and D. Hu, Appl. Surf. Sci., 2013, 268, 541–546 CrossRef CAS PubMed.
- A. G. Roca, J. F. Marco, M. D. P. Morales and C. J. Serna, J. Phys. Chem. C, 2007, 111, 18577–18584 CAS.
- I. Horcas, R. Fernández, J. M. Gómez-Rodríguez, J. Colchero, J. Gómez-Herrero and A. M. Baro, Rev. Sci. Instrum., 2007, 78, 013705–013708 CrossRef CAS PubMed.
- I. G. Campbell, T. A. Jones, W. D. Foulkes and J. Trowsdale, Cancer Res., 1991, 51, 5329–5338 CAS.
- M. Wu, W. Gunning and M. Ratnam, Cancer Epidemiol., Biomarkers Prev., 1999, 8, 775–783 CAS.
- S. Hashira, S. Okitsu-Negishi and K. Yoshino, Pediatr. Int., 2000, 42, 337–342 CrossRef CAS.
- C. Fang, N. Bhattarai, C. Sun and M. Zhang, Small, 2009, 5, 1637–1641 CrossRef CAS PubMed.
- L. M. Bronstein, X. Huang, J. Retrum, A. Schmucker, P. Maren, B. D. Stein and B. Dragnea, Chem. Mater., 2007, 19, 3624–3632 CrossRef CAS.
- M.-L. Chen, L.-M. Shen, S. Chen, H. Wang, X.-W. Chen and J.-H. Wang, J. Mater. Chem. B, 2013, 1, 2582–2589 RSC.
- M. Pumera, Chem. Soc. Rev., 2010, 39, 4146–4157 RSC.
- Y. Jin, S. Huang, M. Zhang, M. Jia and D. Hu, Appl. Surf. Sci., 2013, 268, 541–546 CrossRef CAS PubMed.
- J. Perdew, K. Burke and M. Ernzerhof, Phys. Rev. Lett., 1996, 77, 3865–3868 CrossRef CAS.
- A. Tkatchenko and M. Scheffler, Phys. Rev. Lett., 2009, 102, 073005 CrossRef.
- R. J. Fullerton, D. L. P. Cole, K. D. Behler, S. Das, F. Irin, D. Parviz, M. N. F. Hoque, Z. Fan and M. J. Green, Carbon, 2014, 72, 192–199 CrossRef CAS PubMed.
- T. Sharifi, E. Gracia-Espino, H. R. Barzegar, X. Jia, F. Nitze, G. Hu, P. Nordblad, C. W. Tai and T. Wågberg, Nat. Commun., 2013, 4, 2319 Search PubMed.
- H. He and C. Gao, ACS Appl. Mater. Interfaces, 2010, 2, 3201–3210 CAS.
|
| This journal is © The Royal Society of Chemistry 2014 |
Click here to see how this site uses Cookies. View our privacy policy here. 


