Electrochemical sensor based on overoxidized dopamine polymer and 3,4,9,10-perylenetetracarboxylic acid for simultaneous determination of ascorbic acid, dopamine, uric acid, xanthine and hypoxanthine

Xiaofang Liu, Xin Ou, Qiyi Lu, Juanjuan Zhang, Shihong Chen* and Shaping Wei*
Key Laboratory of Luminescent and Real-Time Analytical Chemistry, Ministry of Education, College of Chemistry and Chemical Engineering, Southwest University, Chongqing 400715, PR China. E-mail: cshong@swu.edu.cn; shapingw@swu.edu.cn; Fax: +86-23-68253172; Tel: +86-23-68253172

Received 17th June 2014 , Accepted 28th August 2014

First published on 28th August 2014


Abstract

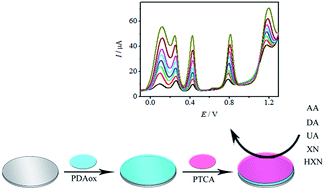
A novel electrode based on 3,4,9,10-perylenetetracarboxylic acid (PTCA) and overoxidized dopamine polymer (PDAox) was developed for the simultaneous determination of ascorbic acid (AA), dopamine (DA), uric acid (UA), xanthine (XN) and hypoxanthine (HXN). The developed sensors exhibited an excellent catalytic activity, high sensitivity and good selectivity toward the oxidation of AA, DA, UA, XN and HXN. Scanning electron microscopy (SEM), cyclic voltammetry (CV), different pulse voltammetry (DPV) and electrochemical impedance spectroscopy (EIS) were employed to characterize the sensor. The peak separations between AA–DA, DA–UA, UA–XN and XN–HXN were large, up to 0.15, 0.18, 0.37 and 0.4 V, respectively. The calibration curves for AA, DA, UA, XN and HXN were obtained in the ranges of 76 μM to 3.9 mM, 0.60 to 253 μM, 1.8 to 238 μM, 5.1 to 289 μM and 3.8 to 293 μM with detection limits (S/N = 3) of 25.3 μM, 0.20 μM, 0.60 μM, 1.7 μM and 1.3 μM, respectively. The integration of PDAox and PTCA in the sensor opens up a facile and promising method for the simultaneous determination of above five substances.

1. Introduction

Purines are involved in many metabolic processes as cofactors which play key roles in biological fundamental processes.1 Uric acid (UA), xanthine (XN) and hypoxanthine (HXN) are degradation products of purine metabolism in human beings. The levels of UA, XN and HXN may provide sensitive indicators for physiological diseases, including perinatal asphyxia, gout, xanthinuria and hyperuricemia.2–4 Ascorbic acid (AA) is popularly known for its antioxidant properties and present in the human diet as a vital vitamin. It is widely used for the prevention and treatment of scurvy, common cold, mental illness, cancer and AIDS.5,6 Dopamine (DA) is an important neuron transmitter compound widely distributed in the brain for message transfer in the mammalian central nervous system. Abnormal levels of DA will lead to neurological disorders such as Parkinsonism, schizophrenia and HIV infection.7,8 AA, DA, UA, XN and HXN usually coexist in physiological fluids. Therefore, it is necessary to develop a sensitive and selective method to simultaneously determining them for biomedical chemistry and diagnostic research. Unfortunately, previous reports available in the literature only focus on simultaneous determination of AA, DA and UA or UA, XN and HXN. For example, Zhang et al. reported poly(acid chrome blue K) modified glassy carbon electrode for simultaneous determination of ascorbic acid, dopamine and uric acid.9 Wang et al. utilized poly (bromocresol purple) modified electrode for simultaneous determination of uric acid, xanthine and hypoxanthine.10 To the best of our knowledge, no report is available in the literature for simultaneous determination of AA, DA, UA, XN and HXN.

In recent years, electrochemical method has attracted significant attention for the determination of biologically important compounds due to its simplicity, high sensitivity and relatively low cost.11 However, it is very difficult to simultaneously determine AA, DA, UA, XN and HXN at ordinary electrodes. On the one hand, the oxidation potentials of AA, DA and UA are too close to be separated.12 On the other hand, the oxidation products of these biomolecules would be absorbed or electropolymerized onto the electrode surface, thus contaminating the electrodes and leading to poor selectivity and reproducibility.13 To overcome above problems, various materials have been utilized to construct biosensors, such as self-assembled monolayers,14,15 nanoparticles,16,17 and polymers such as polypyrrole,18 polyaniline,19 poly(eriochrome black T)20 and poly(evans blue).21 Specifically, much attention has been paid to simultaneously detect small biomolecules using overoxidized polymer films modified electrodes.22–24 Dopamine (DA) can be polymerized on the surface of electrode to form chemically stable dopamine polymer film (PDA), which can be further overoxidized to produce overoxidized dopamine polymer (PDAox).25 During the overoxidation process, the hydroxyl groups are oxidized to carbonyl groups with rich electrons, which would be beneficial to improve permselective and antifouling properties of the sensor. Additionally, the aromatic compound 3,4,9,10-perylenetetracarboxylic acid (PTCA) has been used to modify electrodes owing to its large specific surface area, good membrane-forming property, desirable electrical conductivity and carboxylic-functionalized interface.26–29 These excellent characteristics of PTCA would be beneficial to improve the sensitivity and selectivity of the sensors.

Herein, considering the excellent characteristics of PDAox and PTCA, specially, rich oxygen containing groups, we integrated PDAox and PTCA to construct a sensor for simultaneously detecting AA, DA, UA, XN and HXN. This developed sensor not only exhibited excellent catalytic activity toward the oxidation of AA, DA, UA, XN and HXN but also separated their voltammetric responses into five well-defined peaks with large potential separations. The electrochemical behaviors of the sensor were investigated by cyclic voltammetry (CV) and differential pulse voltammetry (DPV).

2. Experimental

2.1. Reagents and materials

3,4,9,10-Perylenete-tracarboxylic dianhydride (C24H8O6, PTCDA) was obtained from Lian Gang Dyestuff Chemical Industry Co., Ltd. (Liaoning, China). Sodium dodecylsulfate (SDS), uric acid, ascorbic acid, dopamine, xanthine and hypoxanthine were purchased from Aladdin in Chemical Reagents Co. Ltd. (Chengdu, China). Phosphate-buffered saline (PBS) solutions (0.10 M) at various pH were prepared using 0.10 M K2HPO4 and 0.10 M KH2PO4. The supporting electrolyte was 0.10 M KCl.

2.2. Apparatus

The scanning electron micrographs were taken with a scanning electron microscope (SEM, S-4800, Hitachi, Tokyo, Japan). Cyclic voltammetry (CV), differential pulse voltammetry (DPV), and electrochemical impedance spectroscopy (EIS) measurements were performed using a CHI 660D electrochemical workstation (Shanghai Chenhua Instrument, Co., China). All measurements were carried out at room temperature.

2.3. Preparation of PTCA

The synthesis was performed in the following manner. Briefly, 10 mg PTCDA was dissolved in 2.0 mL of 0.05 M NaOH solution, and then 1.0 M HCl was dropped gradually into the mixture solution until complete precipitation. The prepared PTCA was centrifuged and washed with double-distilled water to remove excess reagents, then dispersed in double-distilled water and stored at 4 °C for further use.

2.4. Preparation of the sensor

A bare glassy carbon electrode (GCE, Φ = 4 mm) was polished to a mirror using 0.3 and 0.05 μm alumina slurry, and further sonicated in ethanol and double-distilled water, respectively. The pretreated GCE was dipped into 0.05 M DA solution containing 0.10 M SDS to perform the electropolymerization of DA through 6 successive potential sweeps between −0.60 and 0.80 V at 100 mV s−1, and then transferred to 0.10 M PBS (pH 3.0) for electrochemical oxidation at +1.8 V for 250 s. The electrode was carefully rinsed with double-distilled water and dried in air as PDAox/GCE. Subsequently, 10 μL PTCA suspension was dropped on the PDAox/GCE to obtain the PDAox–PTCA/GCE. For comparison, PDAox/GCE and PTCA/GCE were prepared using the similar procedure, respectively.

2.5. Experimental measurements

Electrochemical experiments were carried out using a conventional three-electrode system with a modified GCE as working electrode, a saturated calomel reference electrode (SCE), and a platinum wire auxiliary electrode. CV measurements were taken in the potential range of −0.2–1.4 V at a scan rate of 100 mV s−1 in 0.10 M PBS (pH 3.0). EIS measurements were performed in the presence of a 5.0 mM K3Fe(CN)6–K4Fe(CN)6 (1[thin space (1/6-em)]:[thin space (1/6-em)]1) mixture as a redox probe in 0.10 M PBS (pH 3.0) at a bias potential of 0.172 V. The alternative voltage was 5 mV and the frequency range was 0.1 Hz to 100 kHz. DPV measurements were performed in 0.10 M PBS in the voltage range of −0.2–1.4 V. Pulse amplitude, pulse width and pulse period were 50 mV, 50 ms and 0.2 s, respectively.

3. Results and discussion

3.1. The characterization of the modified electrode

The morphologies and microstructures of PDAox and PDAox–PTCA modified films were investigated by scanning electron microscope (SEM). Fig. 1A displays the SEM image of PDAox with uniform particle-shaped structure. As shown in Fig. 1B, the particle-shaped structure of PDAox also can be observed, and the irregularly quadrate-shaped structure was ascribed to PTCA. Obviously, particle-shaped structure of PDAox and quadrate-shaped structure of PTCA endow the electrode a large specific surface area.
image file: c4ra05853d-f1.tif
Fig. 1 SEM images of (A) PDAox and (B) PDAox–PTCA modified films.

As known, electrochemical impedance spectroscopy (EIS) is an effective tool for investigating the interface properties of modified electrodes. The impedance spectra consist of a semicircular portion at high frequencies and a linear part at low frequencies. The linear part relates to a diffusion-limited process, while the semicircle portion corresponds to an electron transfer-limited process and the diameter of the semicircle represents the electron transfer resistance (Ret). For giving more detailed information about the impedance of the modified electrode, the equivalent circuit model was used to analyse impedance characteristics (insert of Fig. S1). In EIS, the total impedance was determined by several parameters: (1) electrolyte resistance, Rs; (2) the lipid bilayer capacitance, Cdl; (3) charge transfer resistance, Ret; (4) Warburg element, Zw. The parameters obtained by fitting the equivalent circuit are tabulated in Table S1. The Rs and Zw, represent the bulk properties of the electrolyte solution and the diffusion features of the redox probe, respectively, Thus, they are not affected by chemical transformations occurring at the electrode interface. Cdl and Ret, depend on the dielectric and insulating features at the electrode/electrolyte interface. The Cdl depends on the dielectric permittivity introduced into the double-charged layer molecules. The Ret controls the electron transfer kinetics of the redox-probe at electrode interface. Its value varies when different substances are adsorbed onto the electrode surface. In order to clearly view the procedure of electrode modification, we only considered the value of Ret. Fig. S1 shows the nyquist plots of EIS for bare GCE (curve a), PDAox/GCE (curve b) and PDAox–PTCA/GCE (curve c). As seen from Fig. S1, curve a presented a small semicircle domain, implying a low Ret on the bare GCE. The modification of PDAox on the surface of GCE leaded to a large increase in Ret, and the Ret increased from 74.6 to 474.6 Ω, which was due to that the PDAox blocked the electron transfer of [Fe(CN)6]3−/4− probe. For the PTCA–PDAox/GCE, a decrease in Ret was observed because of the desirable electrical conductivity of PTCA.30 In order to better insight the electrochemical reactions on the sensor surface, EIS measurements were also performed in present of AA, DA, UA, XN and HXN. As seen from Fig. S1 (curve d–h), Ret decreased gradually with the successive addition of AA, DA, UA, XN and HXN, and reached the minimum when all of five substances are presented. The reason might be as follows. AA, DA, UA, XN and HXN in the solution can be adsorbed onto the electrode surface, and they exist as cationic form at pH 3.0. The positively charged surface on the sensor facilitated the diffusion of the negatively charges Fe(CN)63−/4− ions towards the sensor, thus leading to the decrease in Ret.

3.2. Optimization of detection conditions

The pH was optimized since it would effect the determination of AA, DA, UA, XN and HXN at PDAox–PTCA/GCE by differential pulse voltammetry (DPV). Fig. 2 shows the effect of pH on the peak current and peak potential for 340 μM AA, 50 μM DA, 40 μM UA, 30 μM XN and 120 μM HXN. As seen from Fig. 2A, the current responses of AA, DA, UA, XN and HXN reached the maximum at pH 3.0. Then it decreased from pH 3.0 to 7.0. The oxidation peaks of AA and DA tended to merge together at pH 7.0, and HXN exhibited an indistinguishable response at pH 2.0. Thus, the current values for AA and DA at pH 7.0, and for HXN at pH 2.0 were not included in Fig. 2A. In Fig. 2B, the oxidation potentials shift negatively with the increase of pH, indicating that protons participate in the electrode reaction process. In order to obtain a high sensitivity, pH 3.0 PBS was selected for further experiments.
image file: c4ra05853d-f2.tif
Fig. 2 Effect of pH on (A) DPV peak currents and (B) DPV peak potentials for the oxidation of 340 μM AA, 50 μM DA, 40 μM UA, 30 μM XN and 120 μM HXN in 0.10 M PBS.

The electropolymerization circles of PDA and the electrochemical oxidation time of PDAox were investigated. Fig. S2A displays the effect of electropolymerization circles of PDA on the DPV responses towards 750 μM AA, 40 μM DA, 65 μM UA, 30 μM XN and 110 μM HXN under the same electrochemical oxidation time of 250 s at PDAox–PTCA/GCE. As observed, the peak currents of five substances reached the maximum at 6 circles. Fig. S2B depicts the DPV response of PDAox–PTCA/GCE for 900 μM AA, 45 μM DA, 65 μM UA, 25 μM XN and 100 μM HXN with different electrochemical oxidation time of PDAox under the same electropolymerization circles of PDA (6 circles). Obviously, the maximum DPV response currents for five substances were obtained at electrochemical oxidation time of 250 s. Thus, electropolymerization of 6 circles and electrochemical oxidation of 250 s are adopted as the optimum in the following experiments.

3.3. Cyclic voltammetric behaviors of the modified electrode

Fig. 3 shows the cyclic voltammograms (CVs) of different modified electrodes in 0.10 M PBS (pH 3.0) containing the mixture of 1.6 mM AA, 60 μM DA, 270 μM UA, 130 μM XN and 340 μM HXN. As seen from curve a, a broad oxidation peak can be observed at 0.50 V, which was due to the fact that the oxidation peaks of AA, DA and UA overlapped together and came into a large peak. The inconspicuous oxidation peak observed at 1.0 V was attributed to the oxidation of XN. Furthermore, the anodic peak of HXN can not be observed. Obviously, it is infeasible to simultaneously detect above five small biomolecules at bare GCE (curve a). For the PDAox/GCE (curve b), oxidation peaks for UA, XN and HXN appeared at 0.48 V, 0.85 V and 1.25 V, respectively. The oxidation peaks of AA and DA merged together to generate a broader peak at 0.25 V, indicating the infeasibility of the simultaneous determination of AA, DA, UA, XN and HXN at PDAox/GCE. However, the PDAox–PTCA/GCE exhibited five well-separate and clear peaks for the simultaneous determination of five substances (curve c). The oxidation peak potentials for AA, DA, UA, XN and HXN were observed at 0.15 V, 0.30 V, 0.48 V, 0.85 V and 1.25 V, respectively. And each peak current remarkable increased when compared to PDAox/GCE. The reasons may be as follows. First, the PDAox film with negative charge could effectively collect AA, DA, UA, XN and HXN at the surface of electrode due to the electrostatic interaction, since AA (pKa = 4.10), DA (pKa = 8.87), UA (pKa = 5.7), XN (pKa = 7.4) and HXN (pKa = 8.9) exist as cationic form at pH 3.0 owing to the protonation. Second, during overoxidation process, the hydroxyl groups of DA are oxidized to the carbonyl groups. Furthermore, PTCA itself would provide a large amount of carboxylic functional groups. These oxygen containing groups could provide a selective interface via hydrogen bonds with the proton-donating group of AA, DA, UA, XN and HXN, such as –NH and –OH. Third, the porous structure provided by PTCA and PDAox particles modified films would be beneficial to facilitate the discrimination of AA, DA, UA, XN and HXN since the conducting porous layers on the surface of electrodes can facilitate the discrimination of many species which were oxidized at similar potentials.31 Based on the synergistic effects between PDAox and PTCA, the developed sensors displayed an excellent catalytic activity and selectivity toward the oxidation of AA, DA, UA, XN and HXN. Furthermore, in order to further study the response of PTCA–PDAox/GCE towards AA, DA, UA, XN and HXN, the total amount of charges has been calculated through the integration of CV peak in each oxidation potential for AA, DA, UA, XN and HXN. The total amount of charges were estimated to be 1.4 × 10⁻⁴, 4.7 × 10⁻⁵, 2.6 × 10⁻⁵, 3.3 × 10⁻⁵ and 3.9 × 10⁻⁵ C for AA (2 mM), DA (0.20 mM), UA (0.20 mM), XN (0.20 mM) and HXN (0.20 mM), respectively. As control experiments, the total amount of charges were estimated to be 6.7 × 10⁻⁵, 3.2 × 10⁻⁵, 1.6 × 10⁻⁵, 2.1 × 10⁻⁵ and 2.4 × 10⁻⁵ C in the case of the same oxidation potential without analyte molecules, respectively. The total amount of charges in the presence of analyte molecules obviously increased when compared to that without analyte molecules, implying that the PTCA–PDAox/GCE has a good response to detect the five substances.
image file: c4ra05853d-f3.tif
Fig. 3 CV responses of (a) bare GCE, (b) PDAox/GCE and (c) PDAox–PTCA/GCE in 0.10 M PBS (pH 3.0) containing 1.6 mM AA, 60 μM DA, 270 μM UA, 130 μM XN and 340 μM HXN at a scan rate of 100 mV s−1, respectively.

3.4. Simultaneous detection of AA, DA, UA, XN and HXN

The main aim of the present investigation is to simultaneously detect AA, DA, UA, XN and HXN. Fig. 4 reveals the DPV behaviors of the sensor towards the electrochemical oxidation of AA, DA, UA, XN and HXN mixture under the optimization conditions. As shown in Fig. 4A, five clear and well-separated peaks were observed, and the oxidation peak currents increased with the increase in concentration of AA, DA, UA, XN and HXN, indicating the feasibility of the simultaneous determination of AA, DA, UA, XN and HXN at PDAox–PTCA/GCE in the mixture solution.
image file: c4ra05853d-f4.tif
Fig. 4 DPV curves at PDAox–PTCA/GCE in 0.10 M PBS (pH 3.0) for (A) simultaneous response to AA (0.282, 0.564, 0.752, 0.987, 1.22, 1.50, 2.21, 3.10 mM), DA (8, 12, 20, 30, 45, 60, 105, 170 μM), UA (9.6, 22, 34, 58, 82, 130, 214, 334 μM), XN (13, 22, 31, 49, 67, 85, 121, 175 μM), and HXN (100, 120, 140, 165, 190, 230, 290, 410 μM); (B) containing 90 μM DA, 80 μM UA, 85 μM XN, 270 μM HXN and different concentrations of AA (from inner to outer): 0.076, 0.36, 0.65, 1.0, 1.4, 1.9, 2.5, 3.2, 3.9 mM; (C) containing 850 μM AA, 50 μM UA, 80 μM XN, 180 μM HXN and different concentrations of DA (from inner to outer): 0.6, 9.4, 17, 33, 53, 83, 113, 183, 253 μM; (D) containing 620 μM AA, 30 μM DA, 40 μM XN, 130 μM HXN and different concentrations of UA (from inner to outer): 1.8, 5.4, 12.6, 39.6, 66.6, 103, 148, 193, 238 μM; (E) containing 900 μM AA, 50 μM DA, 80 μM UA, 120 μM HXN and different concentrations of XN (from inner to outer): 5.1, 17, 34, 60, 94, 136, 187, 238, 289 μM; (F) containing 900 μM AA, 30 μM DA, 40 μM UA, 100 μM XN and different concentrations of HXN (from inner to outer): 3.8, 9.2, 20, 36.2, 56.6, 104, 158, 225, 293 μM.

Usually, AA, DA, UA, XN and HXN are coexisted in biological samples, and the oxidation potentials of five species are very close. Therefore, the interference from each other should be excluded. DPV has been adopted to investigate the electro-oxidation processes when the concentration of one species changed, whereas those of other four substances are kept constant. Fig. 4B depicts the DPV curves with varied concentration of AA and constant concentration of DA (90 μM), UA (80 μM), XN (85 μM) and HXN (270 μM). The peak current of AA increased linearly with an increase in AA concentration from 76 μM to 3.9 mM, with a detection limit of 25.3 μM, the linear function Ip,AA (μA) = 6.80 + 0.018CAA (μM) and a correlation coefficient of R = 0.9981. As shown in Fig. 4C, in the presence of AA (850 μM), UA (50 μM), XN (80 μM) and HXN (180 μM), the oxidation peak currents of DA increased linearly with an increase in DA concentration from 0.60 to 253 μM, with the linear function Ip,DA (μA) = 14.35 + 0.326CDA (μM) (R = 0.9925) and a detection limit of 0.20 μM. Fig. 4D shows that the peak current of UA increased linearly with the increase in UA concentration from 1.8 to 238 μM in the presence of AA (620 μM), DA (30 μM), XN (40 μM) and HXN (130 μM). The detection limit of 0.60 μM was obtained, and the linear regression equation was Ip,UA (μA) = 10.33 + 0.193CUA (μM) (R = 0.9936). Fig. 4E illustrates the DPV curves of XN in the presence AA (900 μM), DA (50 μM), UA (80 μM) and HXN (120 μM). The linear response range was 5.1 to 289 μM with the linear function Ip,XN (μA) = 16.91 + 0.307CXN (μM) (R = 0.9935) and a detection limit of 1.7 μM. Fig. 4F depicts the DPV curves of HXN containing AA (900 μM), DA (30 μM), UA (40 μM) and XN (100 μM). The linear response range was from 3.8 to 293 μM, with the linear function Ip,HXN (μA) = 28.29 + 0.137CHXN (μM) (R = 0.9927) and a detection limit of 1.3 μM. As seen from Table 1, the PDAox–PTCA/GCE showed a lower detection limit and wider linear range than other electrodes in the literature.

Table 1 Comparison of the response characteristics of different modified electrodes
Electrode Method Linear response range (μM) Limit of detection (μM) Reference
AA DA UA XN HXN AA DA UA XN HXN
P-4-ABA/GCE DPV 20–800 5.0–100 1–80 5.0 1.0 0.5 32
PEDOT-modified Ni/Si MCP electrode DPV 20–1400 12–48 36–216 10 1.5 2.7 5
HCNTs/GCE DPV 7.5–180 2.5–105 6.7–65 0.92 0.8 1.5 33
Poly(L-arginine)/grapheme/GCE DPV 0.1–10 0.1–10 0.2–20 0.05 0.05 0.1 2
p-ATD/GCE DPV 30–300 5–50 10–100 10–100 2.01 0.33 0.19 0.59 34
PDAox–PTCA/GCE DPV 76–3900 0.6–253 1.8–238 5.1–289 3.8–293 25.3 0.20 0.60 1.7 1.3 This work


3.5. Interferences, stability and reproducibility

The anti-interference ability of the sensor was investigated. When AA (1000 μM), DA (30 μM), UA (40 μM) XN and HXN (40 μM) were simultaneously detected, no significant interference was observed from the following compounds: NaCl, NaSO4, KCl, KNO3, MgSO4, glucose and lactose. The stability of PDAox–PTCA/GCE was tested. The modified electrode was stored at 4 °C in a refrigerator when not in use. The peak current intensity obtained at PDAox–PTCA/GCE only decreased 6.6%, 5.8%, 6.0%, 5.3% and 4.5% for AA, DA, UA, XN and HXN after 5 days, respectively. The reproducibility of the developed sensor was also tested by DPV measurement using six different electrodes. The relative standard deviations (RSD) of the DPV response currents for five species were less than 7.8%. These results indicated that the sensor showed a good anti-interference ability, an acceptable stability and reproducibility.

4. Conclusions

A strategy for the simultaneous determination of AA, DA, UA, XN and HXN was developed based on PDAox–PTCA modified electrode. Due to the synergic effect of PDAox and PTCA to facilitate the discrimination of AA, DA, UA, XN and HXN, the proposed sensor exhibited excellent electrocatalytic activity for the oxidation of AA, DA, UA, XN and HXN. Large peak separations between AA, DA, UA, XN and HXN allow this sensor to individually or simultaneously detect AA, DA, UA, XN and HXN by using DPV with good sensitivity, selectivity and stability. The combination of PDAox and PTCA would provide a facile and promising way for simultaneous determination of biologically important species.

Acknowledgements

This work was supported by the National Natural Science Foundation of China (21075100, 21275119), Ministry of Education of China (708073), Specialized Research Fund for the Doctoral Program of Higher Education (20100182110015), State Key Laboratory of Electroanalytical Chemistry (SKLEAC 2010009), Natural Science Foundation Project of Chongqing City (CSTC-2011BA7003), and Fundamental Research Funds for the Central Universities (XDJK2012A004).

References

  1. M. Amal Raj and S. Abraham John, Anal. Chim. Acta, 2013, 771, 14–20 CrossRef PubMed.
  2. K. Jindal, M. Tomar and V. Gupta, Analyst, 2013, 138, 4353–4362 RSC.
  3. Z. H. Wang, X. Y. Dong and J. Li, Sens. Actuators, B, 2008, 131, 411–416 CrossRef CAS PubMed.
  4. F. Y. Zhang, Z. H. Wang, Y. Z. Zhang, Z. X. Zheng, C. M. Wang, Y. L. Du and W. C. Ye, Talanta, 2012, 93, 320–325 CrossRef CAS PubMed.
  5. S. Yu, C. Luo, L. Wang, H. Peng and Z. Zhu, Analyst, 2013, 138, 1149–1155 RSC.
  6. P. Manivel, M. Dhakshnamoorthy, A. Balamurugan, N. Ponpandian, D. Mangalaraj and C. Viswanathan, RSC Adv., 2013, 3, 14428–14437 RSC.
  7. M. J. Lv, T. Mei, C. A. Zhang and X. B. Wang, RSC Adv., 2014, 4, 9261–9270 RSC.
  8. Q. Mu, H. Xu, Y. Li, S. Ma and X. Zhong, Analyst, 2014, 139, 93–98 RSC.
  9. R. Zhang, G. D. Jin, D. Chen and X. Y. Hu, Sens. Actuators, B, 2009, 138, 174–181 CrossRef CAS PubMed.
  10. Y. Wang and L. L. Tong, Sens. Actuators, B, 2010, 150, 43–49 CrossRef CAS PubMed.
  11. Y. Wang, Colloids Surf., B, 2011, 88, 614–621 CrossRef CAS PubMed.
  12. Z. H. Xue, Y. J. Feng, H. X. Guo, C. X. Hu, A. M. Mohmed, J. S. Li and X. Q. Lu, RSC Adv., 2014, 4, 5849–5852 RSC.
  13. C. H. Xiao, X. C. Chu, Y. Yang, X. Li, X. H. Zhang and J. H. Chen, Biosens. Bioelectron., 2011, 27, 2934–2939 CrossRef PubMed.
  14. R. K. Shervedani, M. Bagherzadeh and S. A. Mozaffari, Sens. Actuators, B, 2006, 115, 614–621 CrossRef CAS PubMed.
  15. C. R. Raj, K. Tokuda and T. Ohsaka, Bioelectrochemistry, 2001, 53, 183–191 CrossRef CAS.
  16. J. S. Huang, Y. Liu, H. Q. Hou and T. Y. You, Biosens. Bioelectron., 2008, 24, 632–637 CrossRef CAS PubMed.
  17. C. F. Tang, S. A. Kumar and S. M. Chen, Anal. Biochem., 2008, 380, 174–183 CrossRef CAS PubMed.
  18. S. Ulubay and Z. Dursun, Talanta, 2010, 80, 1461–1466 CrossRef CAS PubMed.
  19. X. M. Feng, C. J. Mao, G. Yang, W. H. Hou and J. J. Zhu, Langmuir, 2006, 22, 4384–4389 CrossRef CAS PubMed.
  20. H. Yao, Y. Sun, X. Lin, Y. Tang and L. Huang, Electrochim. Acta, 2007, 52, 6165–6171 CrossRef CAS PubMed.
  21. L. Q. Lin, J. H. Chen, H. Yao, Y. Z. Chen, Y. J. Zheng and X. H. Lin, Bioelectrochemistry, 2008, 73, 11–17 CrossRef CAS PubMed.
  22. J. Li and X. Q. Lin, Anal. Chim. Acta, 2007, 596, 222–230 CrossRef CAS PubMed.
  23. X. F. Liu, L. Zhang, S. P. Wei, S. H. Chen, X. Ou and Q. Y. Lu, Biosens. Bioelectron., 2014, 57, 232–238 CrossRef CAS PubMed.
  24. C. Wang, R. Yuan, Y. Q. Chai, Y. Zhang, F. X. Hu and M. H. Zhang, Biosens. Bioelectron., 2011, 30, 315–319 CrossRef CAS PubMed.
  25. T. Łuczak, Electrochim. Acta, 2008, 53, 5725–5731 CrossRef PubMed.
  26. Y. Yuan, X. Gou, R. Yuan, Y. Chai, Y. Zhuo, X. Ye and X. Gan, Biosens. Bioelectron., 2011, 30, 123–127 CrossRef CAS PubMed.
  27. W. Zhang, Y. Q. Chai, R. Yuan, J. Han and S. H. Chen, Sens. Actuators, B, 2013, 183, 157–162 CrossRef CAS PubMed.
  28. T. Kampen, A. Bekkali, I. Thurzo, D. R. T. Zahn, A. Bolognesi, T. Ziller, A. D. Carlo and P. Lugli, Appl. Surf. Sci., 2004, 234, 313–320 CrossRef CAS PubMed.
  29. H. B. Li, J. Li, Q. Xu, Z. J. Yang and X. Y. Hu, Anal. Chim. Acta, 2013, 766, 47–52 CrossRef CAS PubMed.
  30. W. Zhang, Y. Q. Chai, R. Yuan, J. Han and S. H. Chen, Sens. Actuators, B, 2013, 183, 157–162 CrossRef CAS PubMed.
  31. M. C. Henstridge, E. J. F. Dickinson, M. Aslanoglu, C. B. Mcauley and R. G. Compton, Sens. Actuators, B, 2010, 145, 417–427 CrossRef CAS PubMed.
  32. X. Y. Zheng, X. C. Zhou, X. Y. Ji, R. Y. Lin and W. X. Lin, Sens. Actuators, B, 2013, 178, 35–365 CrossRef PubMed.
  33. R. J. Cui, X. Y. Wang, G. H. Zhang and C. Wang, Sens. Actuators, B, 2012, 161, 1139–1143 CrossRef CAS PubMed.
  34. P. Kalimuthu and S. A. John, Talanta, 2010, 80, 1686–1691 CrossRef CAS PubMed.

Footnote

Electronic supplementary information (ESI) available. See DOI: 10.1039/c4ra05853d

This journal is © The Royal Society of Chemistry 2014