DOI:
10.1039/C4RA05791K
(Communication)
RSC Adv., 2014,
4, 55773-55780
Preparation of antifouling polyetherimide/hydrolysed PIAM blend nanofiltration membranes for salt rejection applications
Received
16th June 2014
, Accepted 3rd October 2014
First published on 3rd October 2014
Abstract
Nanofiltration (NF) membranes are continually sought for their unique physical and chemical properties, which allow filtration of electrolytes, dyes and other substances. In continuation of our efforts to prepare NF membranes, flat sheet polyetherimide/hydrolysed poly(isobutylene-alt-maleic anhydride) (PIAM) blend membranes have been prepared. The main aim was to explore the effect of addition of PIAM on morphological features and permeation properties of the membranes. The presence of dicarboxlic acid functionality leads to an enhancement in the hydrophilicity and antifouling properties. The results revealed that increasing the content of hydrolysed PIAM decreases the pore size of the membranes and subsequently increases the electrolyte rejection. The PEI/hydrolysed PIAM composition (80
:
20) showed reasonably good salt rejection (sodium sulphate of 1000 ppm) of up to 76% with a pure water flux of 11.8 L m−2 h−1 at 0.4 MPa transmembrane pressure. This study provides a simple and effective approach to produce a negatively charged NF membranes for water desalination applications with low energy consumption.
1. Introduction
Nanofiltration (NF) has attracted increasing attention because of its valuable application in water purification.1–4 It shows separation characteristics in the intermediate range of reverse osmosis (RO) and ultrafiltration (UF). NF membranes have created great interest worldwide because of several advantages such as low-operation pressure, high-permeation and high rejection of electrolytes.5–8 One of the most widely accepted models for transport of an electrolyte solution through a NF membrane is the Donnan effect, which explains the dependency of charge density on the membrane surface.9–11 The charged membranes can be obtained by incorporating suitable functional groups such as carboxylic acid (–COOH), sulfonic acid (–SO3H), amine (–NH2) etc.12 Hence, the type of charge and charge density are important parameters for these membranes.13,14 To prepare a high performance membrane, a suitable secondary polymer or additive is commonly used, as it extends an effective and convenient way to control the membrane properties.
Among high performance polymers, Poly(etherimide) (PEI) continues to attract attention as the material of choice for membrane preparation.15 The aromatic imide unit provides excellent mechanical and thermal properties. It has a good film forming capacity and chemical resistance over a wide range of pH, while the flexible ether linkages provide good process ability.16,17 Kim et al. reported the preparation of integrally skinned uncharged PEI asymmetric NF membranes using dry/wet phase inversion method. These NF membrane showed moderate pure water flux (1.27 ton per m2 per day) and high rejection rate (PEG 600, 83%).18 Nagendran et al. reported the preparation of PEI/Cellulose acetate blend membranes for ultrafiltration applications.19 From the previous reports, it has been observed that PEI membranes have been effectively used for pervaporation, oil–water separation, gas separation and other applications.20–22 Swier et al. studied the applicability of PEI blends in the preparation of proton-exchange membrane (PEM).23 This may be achieved by the modification of PEI membranes through blending. However, PEI has limitations such as strict membrane-casting conditions, reasonably lower rejection and lower gas permeability and so on. Moreover, the usage of PEI in aqueous phase is limited because of its hydrophobic nature. The hydrophobic membrane suffers from fouling which affect the membrane performance for a prolonged period of time. Thus, fouling control remains as one of the primary challenges while synthesizing new membrane. Making the membrane hydrophilic serves as one of the method to curb fouling. Imparting hydrophilicity to the membranes can be achieved by a number of techniques such as polymer grafting, tailor made polymers, blending, incorporation of inorganic oxides, etc. Amongst these, polymer blending is the simplest method to achieve enhanced membrane performance.
Polymer blending has been widely employed to achieve new types of materials with properties lying between those of pure components. These not only alter the properties of membrane prepared from a single polymer, but also have a significant effect on permeability and perm selectivity of the membrane.24 The desired properties and good hydrophilic–hydrophobic balance in a membrane can be achieved by membrane preparation by multicomponent polymer blend system.25 PEI with sulfonated poly(ether ether ketone), sulfonated polyphenylsulfone and cellulose acetate constitutes the miscible pairs and represents the blend membrane consisting of hydrophobic and hydrophilic polymers.26–28 Dense and asymmetric alloy membrane can be obtained from homogeneous blend of various polymers. However, properties of such a polymer blend depend on the miscibility and compatibility of the individual polymers as well as on the method of preparation.
The poly(isobutylene-alt-maleic anhydride) (PIAM) has been widely employed for the preparation of NF membranes.29 PIAM consists of aliphatic chain with a repeating anhydride group, which can be easily hydrolysed to give carboxylic functionality.30 It is well known that, incorporation of carboxylic acid groups not only results in the enhancement of the hydrophilic nature but also impart charge on the membrane surface.31
In the present protocol, the preparation of PEI/hydrolysed PIAM blends NF membranes with different composition via phase inversion method and its characterisation was carried out. The properties of the blend membrane were evaluated in terms of hydrophilicity, ion exchange capacity (IEC), pure water flux (PWF) and antifouling property. The salt rejection behaviour of the membrane was investigated by using electrolyte solutions of sodium chloride, sodium sulphate and magnesium sulphate.
2. Materials and methods
2.1. Materials
Polyetherimide (PEI) (Mw = 35
000 Da), poly (isobutylene-alt-maleic anhydride) (PIAM) (Mw = 3000 Da) were purchased from Sigma Aldrich (India). N-methyl-2-pyrrolidone (NMP) of analytical-grade purity was obtained from Merck, India. Bovine Serum Albumin (BSA) was purchased from Central Drug House (CDH), New Delhi, India. 1000 ppm solutions of Na2SO4, MgSO4, NaCl were used as feed solutions for rejection studies. The concentration of feed and permeate solutions were measured using EQ-660A conductivity meter (Equip-tronics, India).
2.2. Preparation of blend membranes
The PEI and hydrolysed PIAM blend membranes with different compositions were prepared by phase inversion method. Both PEI (Fig. 1) and PIAM were dried in vacuum over 10 h at 50 °C before use. The polymers with desired ratio were dissolved in NMP at 60 °C for 16 h on a hot plate to get a clear homogenous solution. The solution was kept at the same temperature for at least 6 h to remove any trapped air bubbles. The homogenous polymer solution was then casted over the glass plate using doctor's blade. The solvent was allowed to evaporate for 30 seconds before immersing the glass plate into the coagulation bath containing water as non-solvent. Thus, the obtained membrane was kept immersed in distilled water for 24 h to ensure complete phase inversion and then it was washed with distilled water for several times. Later, the membrane was dipped in 0.1% NaOH solution for 20 h at room temperature in order to hydrolyse the anhydride group of PIAM. After 20 h, the hydrolysed membranes were washed with distilled water several times to remove any left out traces of the sodium hydroxide solution, i.e. rinsing water turning to neutral pH. Further membranes were air dried before further analysis.
 |
| Fig. 1 Structure of Polyetherimide (PEI) polymer. | |
2.3. Membrane characterization
2.3.1. FT IR analysis. The hydrolysis of anhydride to acid group was determined by taking IR spectrum of PM1 membrane before and after hydrolysis. FT IR spectra were recorded using Avatar 360 IR spectrophotometer in the range of 4000–400 cm−1. The changes in the characteristic peaks of spectra were discussed in results and discussion.
2.3.2. Ion Exchange Capacity (IEC). The IEC of the membrane was measured by using conventional titration method. The membrane in H+ form was immersed in a 2 M NaCl solution for 24 h to replace H+ with Na+ completely. The remaining solution was then titrated against 0.01 M of NaOH, using phenolphthalein indicator.32 The IEC value was calculated using eqn (1) |
 | (1) |
where, V is the volume of NaOH solution consumed for titration (L) and Wd is the weight of the dry membrane sample (g).
2.3.3. Membrane morphology. The cross-section image of the membrane was taken with Jeol JSM-6380LA scanning electron microscope. Before commencing the analysis, the membrane samples were dried and then fractured cryogenically in liquid nitrogen. By using sputtering device, samples were smeared with gold in order to obtain conductance.
2.3.4. Water uptake and contact angle measurement. The water content of the membrane was determined by dipping the membranes (1 cm2) in water for 24 h and weighed after pressing with blotting paper. Then, the wet membranes were placed in a vacuum oven at 70 °C for 45 h and the dry weights were determined.33 The percentage water content was calculated using eqn (2) |
 | (2) |
where Ww and Wd are the sample weights after swelling for 24 h under wet and dry conditions respectively. For each membrane, five samples were examined and the average values were reported.The hydrophilic property of the membrane was analysed by the water contact angle (WCA) measurement. It was measured using FTA-200 Dynamic contact angle analyzer according to the sessile droplet method. In order to minimize the experimental errors, the WCA measurement of each sample was measured five times and the average value was reported.
2.3.5. Permeation properties. The performance of the membranes was analyzed using a self-constructed dead end filtration cell at room temperature. The membrane with an effective area of 5 cm2 was dipped in distilled water for 24 h before starting the permeation experiment. Initially, each membrane was compacted at 0.5 MPa for about 1 h and then it was reduced to 0.4 MPa to obtain the pure water flux (Jw1, L m−2 h−1). Then, the flux was measured for every 10 min interval. The pure water flux (PWF), Jw was calculated using eqn (3) |
 | (3) |
where Jw is expressed in L m−2 h−1 and Q is the amount of water collected for Δt (h) time duration using a membrane of area A (m2).
2.3.6. Porosity and pore size. The overall porosity (ε) was determined by gravimetric method,34 as defined in the eqn (4) |
 | (4) |
where W1 is the weight of the wet membrane,W2 is the weight of the dry membrane, A is the membrane effective area (m2), dw is the water density (0.998 g cm−3) and l is the membrane thickness (m).The pore radius (rm) was determined using Guerout–Elford–Ferry equation on the basis of water flux and porosity35
|
 | (5) |
where
η is the water viscosity (8.9 × 10
−4 Pa s),
Q is the volume of the permeate pure water per unit time (m
3 S
−1), Δ
P is the operating pressure (0.4 MPa),
ε is the porosity of the membrane,
A is the membrane effective area (m
2) and
l is the thickness of the membrane (m).
2.3.7. Antifouling properties. The antifouling property of the membranes was determined using reported procedure as in literature.36 Briefly, the PWF of the membrane was determined Jw1(L m−2 h−1) at 0.4 MPa TMP. The antifouling property of membrane was investigated by considering Bovine Serum Albumin (BSA) as a model protein. The BSA solution was prepared with concentration of 0.8 g L−1 and passed through the membrane for 80 minutes. After BSA filtration, membrane was thoroughly washed with pure water for 15 minutes and again PWF, Jw2(L m−2 h−1) was measured. Finally, the antifouling property of membrane was determined by flux recovery ratio (FRR) using the eqn (6) |
 | (6) |
BSA rejection percentage was obtained using the eqn (7). The BSA concentration in the feed and the permeate was measured using UV spectrometer at a wavelength of 280 nm. All the samples were first treated with Bradford reagent and left for 10 min before measuring the concentration
|
 | (7) |
where
Cp (mg L
−1) and
Cf (mg L
−1) are the BSA concentrations in permeate and feed respectively.
2.3.8. Salt rejection studies. The salt rejection performance of all membranes was carried out by using self-constructed dead end filtration cell. The feed solutions of NaCl, Na2SO4 and MgSO4 with concentration of 1000 ppm were used for the rejection study. The feed solution was filled into a feed tank and pressurized as required using a nitrogen cylinder. Then, the permeate was collected for a particular interval of time and the concentration of the solution was measured in terms of conductivity. Then percentage of salt rejection was determined by using eqn (8) |
 | (8) |
where Cp and Cf are concentrations of permeate and feed respectively. In order to minimize the experimental error, the salt rejection experiment was carried out three times for each membrane and the average value reported.
3. Results and discussion
3.1. ATR-IR analysis
The FTIR spectrum confirms the conversion of anhydride to acid groups after hydrolysis (Scheme 1). As shown in Fig. 2, (b) showed broad –OH stretching at 3481 cm−1 and carboxylic carbonyl stretching at 1724 cm−1. Whereas, before hydrolysis, PM1 membrane showed spectral peaks at 1855 cm−1 and 1772 cm−1 corresponds to anhydride carbonyl group stretching.
 |
| Scheme 1 Hydrolysis of PIAM polymer. | |
 |
| Fig. 2 FTIR spectra of (a) before hydrolysis of PIAM and (b) after hydrolysis of PIAM. | |
3.2. Ion Exchange Capacity (IEC)
The IEC value of membranes signifies the charge present on the membrane surface and thus confirms the presence of carboxylic acid. Since the percentage of hydrolysed PIAM was less than that of PEI, the IEC of all the membranes was low. The measured IEC values are given in Table 1. The membrane PM4 showed highest IEC value of 0.877 mmol g−1, whereas the membrane PM1 showed least IEC value of 0.519 mmol g−1. This is attributed to the content of hydrolysed PIAM in the membranes. As the content of hydrolysed PIAM in the membranes increases from PM1 to PM4, the carboxylic acid groups on the membrane surface available for ion exchange also increases, hence the IEC also increases.
Table 1 Composition and properties of the membranes
Membrane code |
Composition PEI : hydrolysed PIAM |
Water uptake (%) |
IEC (mmol g−1) |
PM1 |
95 : 5 |
59 |
0.519 |
PM2 |
90 : 10 |
62 |
0.649 |
PM3 |
85 : 15 |
69 |
0.784 |
PM4 |
80 : 20 |
78 |
0.877 |
3.3. Water swelling and contact angle measurement
The water uptake study and WCA are good criteria for the estimation of membrane hydrophilicity. The observed contact angle results are presented in Fig. 3. PM1 exhibits the highest contact angle of 56.39°, corresponding to the lowest hydrophilicity, whereas PM4 showed contact angle of 43.08°. This clearly indicated that, increased content of hydrolysed PIAM enhanced the hydrophilicity of the membrane. The water swelling behaviour of the membranes was displayed in Table 1. It can be noticed that, uppermost water uptake observed was 78.8% and the minimum was 59.1%. The membrane with highest percentage of hydrolysed PIAM exhibited maximum water uptake which provides an evidence for the fact that, the increase in the number of carboxylic group enhances the hydrophilic nature of the membrane.30
 |
| Fig. 3 Contact angle values of the membranes. | |
3.4. Morphology of the membrane
The surface and cross sectional images of the membranes have a significant part in recognizing the role of morphological feature in the mechanism of rejection and permeability. The anisotropic or asymmetric membrane can be obtained from nonsolvent induced phase separation method.37 In this method, a homogeneous polymer solution is initially demixed in to two liquid phases because of exchange between non-solvent and solvent. The polymer-rich-phase forms the membrane whereas polymer-poor-phase is attributed to the porous structure.38 The top skin layer of the membrane would provide higher resistance to the material support whereas the lower porous structure would provide lesser resistance to the material during operation, in addition to the mechanical strength it provides to the membrane.
Cross-sectional SEM images of the blend membranes are shown in Fig. 4. The morphology of blend membranes was found to be very similar to that of asymmetric membranes which consists of a top skin layer and a sublayer with finger like substructure. In the prepared blend membranes, one can observe that, as there is an increase in the concentration of hydrolysed PIAM, there was a considerable change in the morphology of the membranes. The PM1 showed larger finger-like projection extended from the active surface layer. Whereas in the PM2, PM3 and PM4 membranes, there was a gradual increasing in the porosity observed with average pore radius (rm) of 13 nm (Table 2). This may be due to the hydrogen bonding between dicarboxylic acid with nitrogen and carbonyl group of PEI. The complex formation thereby causes a decrease in polymer chain flexibility.39 This may be attributed to the change in the morphology as well as the membrane properties. Moreover, the stability of PEI and acid complex is stronger if the interaction between the acid and the water in the coagulation bath is lower i.e. when solubility of dicarboxylic acid in water is less.40 This was supported by the lower solubility of hydrolysed PIAM in water. This may lead to the delayed phase separation process, as a result polymer precipitates slowly and thus create spongy-like structure. These parameters may cause the visible changes in the morphological features of the blend membranes.
 |
| Fig. 4 The cross sectional SEM images of (a) PM1, (b) PM2, (c) PM3, (d) PM4 membranes. | |
Table 2 The thickness and pore characteristic of prepared membranes
Membrane |
Membrane thickness(μm) |
Porosity (%) |
Average pore radius (rm) (nm) |
PM1 |
112 |
73 |
13 |
PM2 |
107 |
77 |
12 |
PM3 |
109 |
83 |
11 |
PM4 |
110 |
85 |
10 |
3.5. Permeation and antifouling properties
The filtration experiments have been conducted to investigate the permeability and antifouling property of the membranes. The important parameters such as, hydrophilicity and hydrophobicity balance, along with the average pore size distribution decides the performance of the membranes. Fig. 5 represents the pure water flux of the blend membranes at 0.4 MPa pressure. The PM4 shows maximum PWF of 11.8 L m−2 h−1 compared to other membranes. This is due to the presence of more number of hydrophilic –COOH groups in the membrane which resulted in good interaction between the acid and water molecules.41
 |
| Fig. 5 The pure water flux of membranes at 0.4 MPa pressure. | |
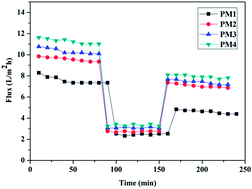
Membrane fouling deteriorates the membrane performance, resulting in flux decline, membrane degradation and also affects the membrane properties. Fouling occurs due to the adsorption and deposition of particulates on the membrane surface and also in the pores.42 In current study, BSA was used as a model protein to conduct the antifouling property study of the prepared membranes. Fig. 6 shows the flux of the prepared blend membranes performed at 0.4 MPa pressure at 28 °C in different environments i.e. before BSA filtration, during BSA filtration and after BSA filtration. The initial flux decline of all blend membranes is due to the mechanical deformation.43 During the BSA rejection study, there was flux decline due to adsorption or deposition of protein molecules on the membrane surface. It is well known that fouling increases with the hydrophobicity of the membranes, which is due to hydrophobic organic molecules, which are driven more towards the surface resulting in the enhancement of surface contamination.44 The prepared membranes are hydrophilic in nature so that they show less affinity towards protein binding. In addition to this, presence of hydrophilic-COOH functional groups impart the negative charge on the membrane which repeals negatively charged BSA molecules at neutral pH. The estimation of flux recovery ratio (FRR) is the best method for analyzing the antifouling properties of the membranes.45 FRR value was highest for PM4 membrane i.e. 73% indicating good reversible nature of membrane. The BSA rejection values of PM1, PM2, PM3, and PM4 membranes are 87%, 89%, 92% and 94.5% respectively.
 |
| Fig. 6 Time dependent flux of PEI/hydrolyzed PIAM membranes at 0.4 MPa TMP during three different conditions. PWF for 80 min, BSA flux (pH = 7 ± 0.2) 80 min and water flux for 80 min after 20 min washing with distilled water. | |
3.6. Salt rejection study
The NF is considered as pre-treatment to RO process due to relatively high flux and reasonable solute rejection obtained at low operating pressure.46 All the membranes were subjected to electrolyte rejection study at 0.4 MPa pressure (Fig. 7). The rejections of different membranes are in the order of Na2SO4 > MgSO4 >NaCl. The PM4 membrane showed maximum rejection of sodium sulphate up to 76% with higher content of hydrolyzed PIAM. Generally, this trend of rejection in NF membrane can be explained on the basis of Donnan effect and size exclusion mechanism. When a membrane comes in contact with an electrolytic solution, it acquires charge by certain phenomena like adsorption of ions from the solutions or dissociation of surface functional groups.48 The presence of –COOH groups on the membrane back bone makes it negatively charged. When such a membrane comes in contact with the electrolyte solution, the membrane will have a higher concentration of oppositely charged ions (counter-ions) on the surface than in the solution, whereas the concentration of co-ions (ions having same charge as that of the membrane) will be higher in the solution than on the membrane. This difference in concentration of the ions gives rise to the potential difference between the membrane and the solution at their interface. Thus, in order to maintain the electrochemical equilibrium between solution and membrane, equal number of counter ions are repelled by the membrane surface.49 Also, it was observed that, rejection of electrolyte decrease to 52%, 39%,10% of sodium sulphate, magnesium sulphate and sodium chloride respectively with increase in pressure up to 1.0 MPa (Fig. 8). With increase in TMP, convective transport of the electrolyte through the NF membrane dominates over diffusive and electrostatic repulsion resulting an enhanced permeate salt concentration and decline of rejection.47
 |
| Fig. 7 The electrolyte rejection study of membranes at 0.4 MPa pressure. | |
 |
| Fig. 8 The pressure dependent electrolyte rejection of PM4 membrane. | |
The higher rejection of the MgSO4 and Na2SO4 over NaCl can be explained on the basis of ionic size and charge density. The order of rejection, SO42− > Cl− is due to the higher anion charge density of SO42− in MgSO4 and Na2SO4 than that of Cl− in NaCl. As a result, the anion repulsion forces become progressively weaker. Also, the rejection of the membrane depends on the electrostatic interaction between ion and membrane surface. The higher rejection of Na2SO4 over MgSO4 was explained according to the literature.50 It is due to the increasing order of cation positive charge density Na+> Mg2+. Hence, the attraction forces acting on the cations Mg2+ and Na+ become progressively stronger and higher affinity of Na+ ions towards –COOH group of the membrane than Mg2+ contributes to the higher rejection.51
4. Conclusions
In the present work, PEI/hydrolyzed PIAM blend membranes were prepared by phase inversion method with different compositions. The presence of dicarboxylic acid due to hydrolysed PIAM in the membrane increased the hydrophilicity of the membranes and reduced the pore size of the membranes. PM4 membrane showed highest pure water flux of 11.8 L m−2 h−1 with lowest pressure and maximum FRR value up to 73%. Also, the membranes being negatively charged showed good rejection for electrolytes. Of all the membranes, membrane PM4 showed maximum rejection for electrolytes and exhibited rejection in the order was Na2SO4> MgSO4>NaCl at lowest pressure. Thus, the presence of dicarboxylic group greatly affected the morphology of the membranes enhancing hydrophilicity, flux, rejection and antifouling properties of the blend membranes. Hence, from the above observations one can conclude that PEI/hydrolyzed PIAM blend membranes are potential candidates for nanofiltration process.
List of abbreviations
PEI | Polyetherimide |
NMP | N-methyl-2-pyrrolidone |
FTIR | Fourier transform infrared spectroscopy |
IEC | Ion exchange capacity |
PIAM | Poly(isobutylene-alt-maleic anhydride) |
WCA | Water contact angle |
SEM | Scanning electron microscope |
PWF | Pure water flux |
BSA | Bovine serum albumin |
FRR | Flux recovery ratio |
PEM | Proton exchange membrane |
Mw | Molecular weight |
TMP | Trans membrane pressure |
Acknowledgements
AMI thank Prof. Swapan Bhattacharya, Director, National Institute of Technology Karnataka, Surathkal, India for providing the research facilities and encouragements. Authors also thank Prof K. Narayan Prabhu and Prof K. Rajendra Udupa of Metallurgical and Materials Engineering Department of NITK Surathkal, India for the contact angle measurements and SEM facility.
References
- G. M. Geise, H. S. Lee, D. J. Miller, B. D. Freeman, J. E. McGrath and D. R. Paul, J. Polym. Sci., Part B: Polym. Phys., 2010, 48, 1685–1718 CrossRef CAS.
- B. Van der Bruggen, C. Vandecasteele, T. Van Gestel, W. Doyen and R. Leysen, Environ. Prog., 2003, 22, 46–56 CrossRef CAS.
- B. Van der Bruggen and C. Vandecasteele, Environ. Pollut., 2003, 122, 435–445 CrossRef CAS.
- L. Setiawan, L. Shi and R. Wang, Polymer, 2013, 55, 1367–1374 CrossRef PubMed.
- I. J. Roh, A. R. Greenberg and V. P. Khare, Desalination, 2006, 191, 279–290 CrossRef CAS PubMed.
- J. Schaep and C. Vandecasteele, J. Membr. Sci., 2001, 188, 129–136 CrossRef CAS.
- K. Volchek, D. Velicogna, A. Obenauf, A. Somers, B. Wong and A. Tremblay, Desalination, 2002, 147, 123–126 CrossRef CAS.
- W. J. Lau and A. Ismail, Desalination, 2009, 245, 321–348 CrossRef CAS PubMed.
- K. Vanherck, P. Vandezande, S. O. Aldea and I. F. Vankelecom, J. Membr. Sci., 2008, 320, 468–476 CrossRef CAS PubMed.
- B. Van der Bruggen, J. Schaep, D. Wilms and C. Vandecasteele, J. Membr. Sci., 1999, 156, 29–41 CrossRef CAS.
- M. R. Teixeira, M. J. Rosa and M. Nyström, J. Membr. Sci., 2005, 265, 160–166 CrossRef CAS PubMed.
- K. Košutić, L. Furač, L. Sipos and B. Kunst, Sep. Purif. Technol., 2005, 42, 137–144 CrossRef PubMed.
- C. M. Nguyen, S. Bang, J. Cho and K.-W. Kim, Desalination, 2009, 245, 82–94 CrossRef CAS PubMed.
- A. Ismail and W. Lau, AIChE J., 2009, 55, 2081–2093 CrossRef CAS.
- B. Seifert, G. Mihanetzis, T. Groth, W. Albrecht, K. Richau, Y. Missirlis, D. Paul and G. Von Sengbusch, Artif. Organs, 2002, 26, 189–199 CrossRef CAS.
- W. Chinpa, D. Quémener, E. Bèche, R. Jiraratananon and A. Deratani, J. Membr. Sci., 2010, 365, 89–97 CrossRef CAS PubMed.
- C. T. Tao and T. H. Young, J. Membr. Sci., 2006, 269, 66–74 CrossRef CAS PubMed.
- I. C. Kim, H. G. Yoon and K. H. Lee, J. Appl. Polym. Sci., 2002, 84, 1300–1307 CrossRef CAS.
- A. Nagendran and D. R. Mohan, Polym. Adv. Technol., 2008, 19, 24–35 CrossRef CAS.
- W. Albrecht, B. Seifert, T. Weigel, M. Schossig, A. Holländer, T. Groth and R. Hilke, Macromol. Chem. Phys., 2003, 204, 510–521 CrossRef CAS.
- Y. Wang, L. Jiang, T. Matsuura, T. S. Chung and S. H. Goh, J. Membr. Sci., 2008, 318, 217–226 CrossRef CAS PubMed.
- D. Wang, K. Li and W. Teo, J. Membr. Sci., 1998, 138, 193–201 CrossRef CAS.
- S. Swier, M. T. Shaw and R. Weiss, J. Membr. Sci., 2006, 270, 22–31 CrossRef CAS PubMed.
- L. Q. Shen, Z. K. Xu, Q. Yang, H. L. Sun, S. Y. Wang and Y. Y. Xu, J. Appl. Polym. Sci., 2004, 92, 1709–1715 CrossRef CAS.
- Y. C. Shu, F. S. Chuang, W. C. Tsen, J. D. Chow, C. Gong and S. Wen, J. Appl. Polym. Sci., 2008, 107, 2963–2969 CrossRef CAS.
- Y. Liu, X. Yue, S. Zhang, J. Ren, L. Yang, Q. Wang and G. Wang, Sep. Purif. Technol., 2012, 98, 298–307 CrossRef CAS PubMed.
- W. R. Bowen, S. Y. Cheng, T. A. Doneva and D. L. Oatley, J. Membr. Sci., 2005, 250, 1–10 CrossRef CAS PubMed.
- S. Swier, V. Ramani, J. Fenton, H. Kunz, M. Shaw and R. Weiss, J. Membr. Sci., 2005, 256, 122–133 CAS.
- B. Ganesh, A. M. Isloor and M. Padaki, Desalination, 2012, 287, 103–108 CrossRef CAS PubMed.
- M. Padaki, A. M. Isloor, G. Belavadi and K. N. Prabhu, Ind. Eng. Chem. Res., 2011, 50, 6528–6534 CrossRef CAS.
- Y. Tian, Q. He, C. Tao, Y. Cui, S. Ai and J. Li, J. Nanosci. Nanotechnol., 2006, 6, 2072–2076 CrossRef CAS PubMed.
- Z. Jiang, X. Zheng, H. Wu and F. Pan, J. Power Sources, 2008, 185, 85–94 CrossRef CAS PubMed.
- R. Kumar, A. M. Isloor, A. Ismail, S. A. Rashid and T. Matsuura, RSC Adv., 2013, 3, 7855–7861 RSC.
- C. Liao, J. Zhao, P. Yu, H. Tong and Y. Luo, Desalination, 2012, 285, 117–122 CrossRef CAS PubMed.
- J.-F. Li, Z.-L. Xu, H. Yang, L.-Y. Yu and M. Liu, Appl. Surf. Sci., 2009, 255, 4725–4732 CrossRef CAS PubMed.
- S. J. Oh, N. Kim and Y. T. Lee, J. Membr. Sci., 2009, 345, 13–20 CrossRef CAS PubMed.
- G. R. Guillen, Y. Pan, M. Li and E. M. Hoek, Ind. Eng. Chem. Res., 2011, 50, 3798–3817 CrossRef CAS.
- L. Yilmaz and A. McHugh, J. Appl. Polym. Sci., 1986, 31, 997–1018 CrossRef CAS.
- I. Wienk, R. Boom, M. Beerlage, A. Bulte, C. Smolders and H. Strathmann, J. Membr. Sci., 1996, 113, 361–371 CrossRef CAS.
- S. Matsuda, Polym. J., 1991, 23, 435–444 CrossRef CAS.
- G. Bakeri, A. F. Ismail, M. Shariaty-Niassar and T. Matsuura, J. Membr. Sci., 2010, 363, 103–111 CrossRef CAS PubMed.
- D. Rana and T. Matsuura, Chem. Rev., 2010, 110, 2448–2471 CrossRef CAS PubMed.
- I. H. Huisman, P. Prádanos and A. Hernández, J. Membr. Sci., 2000, 179, 79–90 CrossRef CAS.
- Z. Xu, J. Zhang, M. Shan, Y. Li, B. Li, J. Niu, B. Zhou and X. Qian, J. Membr. Sci., 2014, 458, 1–13 CrossRef CAS PubMed.
- K. Kimura, Y. Hane, Y. Watanabe, G. Amy and N. Ohkuma, Water Res., 2004, 38, 3431–3441 CrossRef CAS PubMed.
- J. Peeters, J. Boom, M. Mulder and H. Strathmann, J. Membr. Sci., 1998, 145, 199–209 CrossRef CAS.
- S. R. Panda and S. De, Desalination, 2014, 347, 52–65 CrossRef CAS PubMed.
- C. Labbez, P. Fievet, A. Szymczyk, A. Vidonne, A. Foissy and J. Pagetti, Sep. Purif. Technol., 2003, 30, 47–55 CrossRef CAS.
- L. Bruni and S. Bandini, J. Membr. Sci., 2008, 308, 136–151 CrossRef CAS PubMed.
- M. D. Afonso and M. N. de Pinho, J. Membr. Sci., 2000, 179, 137–154 CrossRef CAS.
- R. Kumar, A. Ismail, M. Kassim and A. M. Isloor, Desalination, 2013, 317, 108–115 CrossRef CAS PubMed.
|
This journal is © The Royal Society of Chemistry 2014 |
Click here to see how this site uses Cookies. View our privacy policy here.