DOI:
10.1039/C4RA05575F
(Paper)
RSC Adv., 2014,
4, 39118-39125
Preparation of NaLuF4:Gd, Yb, Tm–TiO2 nanocomposite with high catalytic activity for solar light assisted photocatalytic degradation of dyes and wastewater
Received
11th June 2014
, Accepted 21st August 2014
First published on 21st August 2014
Abstract
A new nanocomposite NaLuF4:Gd, Yb, Tm–TiO2 photocatalyst was developed. Its morphology, size, crystalline phase, composition, absorbance and emission spectra were characterized by X-ray diffraction, transmission electron microscopy, energy-dispersive X-ray analysis, ultraviolet-visible absorbance and fluorescence spectroscopy. The photocatalytic degradation of dyes including rhodamine B (RhB), methyl blue (MB) and methyl orange (MO), dye mixtures and dye wastewater under simulated solar light irradiation were evaluated. The degradation ratios and the removal ratios of chemical oxygen demand (COD) of the dyes and dye wastewater after the photo-degradation were measured. The results show that the as-prepared nanocomposite exhibits high photocatalytic activity, and it can not only efficiently degrade single dyes, but also mixtures and dye wastewater.
1. Introduction
With the increase of the amount of wastewater containing poisonous organic compounds generated, dye wastewater pollution has become a big challenge all over the world,1,2 Dye molecules usually contain one or several benzene rings which are difficult to degrade by traditional chemical and biological methods. Photocatalysis is an effective and environmentally friendly technique for the degradation of toxic organic substances in air and water. Especially, clean, safe and renewable solar energy can be used to fulfill this purpose.2,3 TiO2, due to its high catalytic activity, physical and chemical stabilities, non-toxicity and low-cost, has been widely studied for the degradation of organic pollutions.4–6 However, due to the large bandgap of TiO2 (∼3.2 eV), it can only harvest UV light. Considering that the percentage of UV light in the solar spectrum is only 5%, which is much lower than that in the visible (∼49%) and near-infrared (NIR) (∼46%) regions,7,8 the overall energy harvesting efficiency of TiO2 is quite low. Up to now, many methods have been adopted to extend the absorption of TiO2 into the visible light region, e.g. surface modification, doping of metallic and nonmetallic elements.9–12 Although the absorption spectrum of TiO2 was effectively expanded, the overall catalytic efficiency was not substantially improved. Potential reasons might be that the oxidation–reduction potentials of electron–hole pairs that are generated by the excitation of long wavelength lights are too small to catalyze the reacion.7,8,13 Only those holes produced from the excitation of ultraviolet light possess enough oxidative ability to degrade organic pollutants. Thus, although the absorption range of TiO2 is extended to visible light, it is difficult to obtain higher degradation efficiency.14,15 Moreover, the large fraction in NIR light remains unexplored.
In recently years, some studies have shown that the construction of upconversion nanoparticles and TiO2 nanocomposites is a good approach to improve NIR light harvesting efficiency and photocatalytic activity of TiO2.13,16,17 The upconversion material upconverts NIR (or visible light) into high-energy UV light, which can be absorbed by TiO2.14,16,18 This method can not only extend the light response range of TiO2 into the NIR (or visible light) region, but also excite the TiO2 by UV light supplied from the upconversion materials. The integration of upconversion materials and TiO2 presents an ideal strategy to improve the photocatalytic efficiency of TiO2 based catalysts.
To date, numerous of fluoride-based host matrix and upconversion materials have been developed. Among these materials, NaLuF4 has been proved to be a good host material. Our previous study found that NaLuF4:Yb/Tm and NaLuF4:Gd/Yb/Er displayed higher upconversion luminescence efficiency in comparison to the counterparts of NaYF4-based nanocrystals.19 Li's group reported that lanthanide doped NaLuF4 nanocrystals with size of 7.8 nm were more efficient than NaYF4-based nanocrystals as well, and were demonstrated to be a good biomarker for in vivo bioimaging.20 Qin's group found that β-NaLuF4:Yb, Tm showed intense ultraviolet and blue upconversion emission with longer fluorescence lifetime compared with the NaYF4-based one.21 Although NaLuF4 is an excellent host for upconversion luminescence, the study of using NaLuF4-based upconversion materials as a spectrum modifier for TiO2 has not been reported.
In this study, we prepared a new photocatalyst of NaLuF4:Gd, Yb, Tm–TiO2 nanocomposite and investigated its photocatalytic properties. Improved photocatalytic efficiency was shown.15,22,23 To the best of our knowledge, this is the first time the NaLuF4:Gd, Yb, Tm–TiO2 nanocomposite has been studied for solar light assisted photocatalytic degradation of dye and wastewater.
2. Experimental
2.1. Materials
Rare earth oxides of Lu2O3 (99.999%), Gd2O3 (99.999%), Yb2O3 (99.999%), and Tm2O3 (99.999%) were purchased from Shanghai Yuelong New Materials Co. Ltd. Oleic acid (OA) (>90%), 1-octadecene (>90%) and thioglycollic acid (TGA) (>98%) were purchased from Sigma-Aldrich. Titanium(IV) ethoxide (>98%), NaOH, NH4F, hydrochloric acid, RhB, MB, MO, ethanol, methanol and cyclohexane were purchased from Sinopharm Chemical Reagent Co., Ltd. (Shanghai). The dye wastewater was supplied from Shanghai Jinshan Langxia silk carpet Co. Ltd. P25 (TiO2, 99.5%) was purchased from Degussa Co. Ltd. (Germany). LnCl3 (Ln:Lu, Gd, Yb, Tm) were prepared by dissolving the corresponding metal oxides in hydrochloric acid at elevated temperature.
2.2. Synthesis of NaLuF4:Gd, Yb, Tm upcovnersion nanocrystals
For synthesizing NaLuF4:Gd, Yb, Tm nanocrystals, 0.555 mmol of LuCl3, 0.24 mmol of GdCl3, 0.20 mmol of YbCl3, and 0.005 mmol of TmCl3 were mixed with 6 mL oleic acid (OA) and 15 mL octadecene (ODE) in 50 mL three-necked flask under stirring. The solution was heated to 160 °C and kept for 30 min, then cooled down to room temperature. Subsequently, 10 mL methanol solution containing NaOH (4 mmol) and NH4F (2.5 mmol) were slowly added into the flask and kept for 30 min. The solution was heated to 100 °C and kept for 30 min to remove methanol and water, then heated to 310 °C under nitrogen atmosphere and kept for 1 h. After the solution was cooled down to room temperature, nanocrystals were precipitated from the solution with ethanol, and collected after centrifuging and washing with ethanol–water (1![[thin space (1/6-em)]](https://www.rsc.org/images/entities/char_2009.gif) :1 v/v) for three times.
:1 v/v) for three times.
2.3. Synthesis of hydrophilic NaLuF4:Gd, Yb, Tm upconversion nanocrystals
The above prepared NaLuF4:Gd, Yb, Tm upconversion nanocrystals are hydrophobic. In order to synthesize NaLuF4:Gd, Yb, Tm–TiO2 nanocomposite, it need to be converted to hydrophilic nanocrystals firstly. In a typical experiment, 1.0 mmol of prepared NaLuF4:Gd, Yb, Tm nanocrystals dissolved in 25 mL of cyclohexane was added to 50 mL of ethanol containing 5 mL of TGA and stirred for 48 h at room temperature. Then the nanocrystals were isolated by centrifugation, washed several times with deionized water and ethanol, and then redispersed in ethanol.
2.4. Synthesis of NaLuF4:Gd, Yb, Tm–TiO2 nanocomposite
0.25 mmol of hydrophilic NaLuF4:Gd, Yb, Tm nanocrystals were dispersed in 20 mL ethanol and stirred for 30 min. 100 μL Titanium(IV) ethoxide dispersed in 40 mL ethanol was added to the solution under ultrasound for 2 h at room temperature. Then 20 mL ethanol containing 1.5 mmol deionized water was added into the mixture drop by drop. The above precursor solution was transferred to a 100 mL autoclave, sealed, and maintained at 160 °C for 20 h. The final products were collected by centrifugation and washed with deionized water and ethanol several times, and then dried at 60 °C in air.
For preparation of NaLuF4:Gd, Yb, Tm–TiO2 physical mixture, the NaLuF4:Gd, Yb, Tm and TiO2 were synthesized according to the above procedure first, then they were mixed mechanically in the same ratio of NaLuF4:Gd, Yb, Tm and TiO2 as that of the NaLuF4:Gd, Yb, Tm–TiO2 nanocomposite.
2.5. Characterization
X-ray powder diffraction (XRD) measurements were performed on a Rigaku D/max-2500 X-ray diffractometer using Cu Kα radiation. Transmission electron microscopy (TEM) analyses were performed on a JEOL JEM-2010F electron microscope operating at 200 kV. Energy-dispersive X-ray analysis (EDX) of the samples was performed during high-resolution transmission electron microscopy (HRTEM) measurements. UV-vis-NIR absorption spectra were measured on a Hitachi 3010 UV-vis spectrophotometer (Japan). The upconversion fluorescence emission spectra were recorded with an Edinburgh FLS-920 fluorescence spectrometer by using an external 0–2 W adjustable laser (980 nm, Beijing Hi-Tech Optoelectronic Co., China) as the excitation source instead of the Xenon source in the spectrophotometer.
2.6. Photocatalytic experiments
Photocatalysis was performed via monitoring RhB degradation by measuring the variation of optical absorption of RhB with a Hitachi U-3010 spectrophotometer, using SGY-IB multifunction of photochemical reactor (Nanjing Sidongke Electri Co. Ltd.) as photocatalytic reaction device. In a typical experiment, 20 mg of sample (catalyst) was dispersed into a quartz cuvette containing 50 mL of RhB aqueous solution (10 mg L−1). The suspension was magnetically stirred in the dark for 30 min to attain adsorption–desorption equilibrium between dye and catalyst. Then the photoreaction vessels were exposed to the simulated solar light irradiation produced by a 500 W Xe lamp (PL-X500D) (the wavelength distribution is similar to the solar light). At giving time intervals, the photoreacted solutions were analyzed by recording variations of the absorption band maximum (554 nm) in the UV-Visible spectra of RhB.
The degradation ratio η (%) of dye was calculated using the following equation:
| η (%) = [(C0 − C)]/C0 × 100 = [(A0 − A)]/A0 × 100 |
where
C0 and
C are the initial and residual concentrations of RhB in solution respectively, and
A0 and
A are the absorbance of RhB at 554 nm before and after exposing under simulated solar light respectively.
In order to evaluate the extent of mineralization of dye by photocatalysis, the chemical oxygen demand (COD) of the dye was measured. The COD was determined by standard dichromate method.24 The COD removal ratios (%) of dye was calculated using the following equation:
| COD removal (%) = [(COD0 − COD)]/COD0 × 100 |
where COD
0 and COD are the chemical oxygen demand values of dye solution before and after photocatalytic degradation.
3. Results and discussion
3.1. Phase and morphology characterization
Fig. 1 shows the XRD patterns of the as-prepared products. The diffraction peaks of the NaLuF4:Gd, Yb, Tm (Fig. 1a) can be indexed as a typical pure hexagonal phase according to the JCPDS file no. 27-0726. No impurity peaks can be identified from the XRD pattern, indicating the desired product of pure hexagonal-phase NaLuF4:Gd, Yb, Tm nanocrystals are synthesized successfully. It can be seen from Fig. 1 that the TiO2 nanoparticles are amorphous before annealing (Fig. 1b) and crystalline after hydorthermally annealling at 160 °C for 20 h (Fig. 1c). As shown in the XRD pattern of NaLuF4:Gd, Yb, Tm–TiO2 nanocomposite (Fig. 1c), the characteristic diffraction peaks of TiO2 are observed which are assigned to anatase titania according to the JCPDS file no. 21-1272, while NaLuF4:Gd, Yb, Tm still maintains the pure hexagonal phase structure.
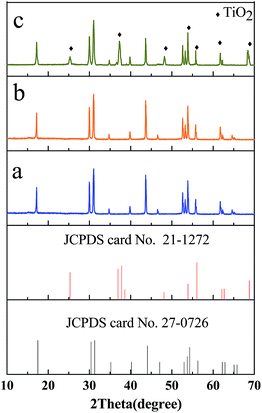 |
| | Fig. 1 XRD patterns of NaLuF4:Gd, Yb, Tm nanocrystal (a), NaLuF4:Gd, Yb, Tm–TiO2 nanocomposite before hydrothermally annealed (b) and after hydrothermally annealed (c). Standard XRD patterns of JCPDS card no. 27-0726 (NaLuF4) and 21-1272 (TiO2). | |
The TEM images of prepared products are shown in Fig. 2. As shown in Fig. 2a, NaLuF4:Gd, Yb, Tm nanocrystals have hexagonal plate-liked structure with diameter about 45 nm, which are uniform and the nanocrystals are well-dispersed. The TEM images of nanocomposite NaLuF4:Gd, Yb, Tm–TiO2 show that a lot of small-sized (10 nm) nanoparticles of TiO2 are dispersed around the NaLuF4:Gd, Yb, Tm particles, where the size and shape of NaLuF4:Gd, Yb, Tm particles remain the same. The HRTEM images of NaLuF4:Gd, Yb, Tm (Fig. 2a, inset) and TiO2 (Fig. 2b, inset) reveal highly crystalline natures of the as-prepared products. The interplanar distances between adjacent lattice fringes correspond to the crystal planes of the nanocrystals,23,25 agreeing with the XRD detected results. The composition of nanocomposite NaLuF4:Gd, Yb, Tm–TiO2 was characterized by EDX analysis. As shown in Fig. 2c, almost all of the elements including Na, Lu, F, Gd, Yb, Ti, and O were detected, further confirmed the composition of the nanocomposite.
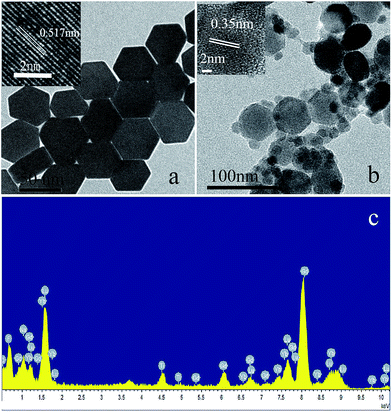 |
| | Fig. 2 TEM (a) and HRTEM (a, inset) images of NaLuF4:Gd, Yb, Tm nanocrystals, TEM (b) and HRTEM (b, inset) images of NaLuF4:Gd, Yb, Tm–TiO2 nanocomposite and TiO2, and EDX spectrum of the NaLuF4:Gd, Yb, Tm–TiO2 nanocomposite (c). | |
3.2. UV-vis-NIR absorption spectra analysis
UV-vis-NIR absorption spectra of NaLuF4:Gd, Yb, Tm nanocrystal and NaLuF4:Gd, Yb, Tm–TiO2 nanocomposite are shown in Fig. 3. Both of the products have an absorption peak at 980 nm which is attributed to the absorption of Yb3+ ions,23,26 while the nanocomposite has sharp peaks emerging at ∼400 nm corresponding to the bandgap absorption of TiO2.15 Based on the UV-vis-NIR spectra, it can be speculated that the UV photos generated from the upconversion process of NaLuF4:Gd, Yb, Tm can be absorbed by the anatase TiO2 via an energy transfer.
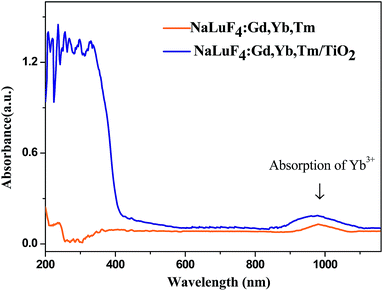 |
| | Fig. 3 UV-vis-NIR absorbance spectra of NaLuF4:Gd, Yb, Tm nanocrystal and NaLuF4:Gd, Yb, Tm–TiO2 nanocomposite. | |
3.3. Upconversion luminescence properties of the nanocomposite
The upconversion luminescence properties of the as-prepared products are investigated. As shown in Fig. 4, Under a 980 nm laser excitation, NaLuF4:Gd, Yb, Tm emits UV and blue lights, where UV emission peaks centered at 291, 349, and 362 nm are attributed to the transitions of Tm3+ ions: 1I6 → 3H6, 1I6 → 3F4, and 1D2 → 3H6, respectively.23,26 Two blue emissions at 450 nm and 478 nm are assigned to 1D2 → 3F4 and 1G4 → 3H6 transitions of Tm3+ ions, respectively.23 The emission at 314 nm is originated from the 6P7/2 → 8S7/2 transitions of Gd3+.27 For the large energy gap between the ground state 8S7/2 and the first excited state 6PJ, the Gd3+ cannot absorb 980 nm photons directly. However, the excited states 6IJ of Gd3+ can be populated through the ET 3P2 →3H6 (Tm3+): 8S7/2 → 6IJ (Gd3+).27,28 At room temperature, the nonradiative relaxation probability of 6IJ → 6PJ is larger than the radiative transition probability of 6I7/2 → 8S7/2, which results in populating 6P5/2 and 6P7/2 levels.28 So the nonradiative decay 6IJ → 6PJ results in 6PJ → 8S7/2. Furthermore the doped Gd3+can promote the phase transformation of nanocrystals from cubic to hexagonal phases,29 resulting in high upconversion luminescence since the upconversion luminescence of hexagonal phase nanocrystals is higher than that of cubic phase.19 It is noticeable that strong UV light is obtained in NaLuF4:Gd, Yb, Tm upon NIR excitation, which can be absorbed by TiO2 and promote the photocatalytic activity of TiO2 subsequently. As shown in Fig. 4, the spectrum of nanocomposite NaLuF4:Gd, Yb, Tm–TiO2 is different from NaLuF4:Gd, Yb, Tm, where the emission peak at 291 nm nearly disappears, and the emission intensities at 314, 349, and 362 nm decrease obviously. The decrease of emission intensities can be attributed to the energy transfer between NaLuF4:Gd, Yb, Tm and TiO2. The emissions at 450 and 478 nm were unchanged, indicating the TiO2 only absorbs the UV light. In contrast, although the emission intensities in 291, 314, 349, and 362 nm for NaLuF4:Gd, Yb, Tm–TiO2 physical mixture also decrease, the decreasing is less than that of the nanocomposite. This can be assigned to the different energy transfer efficiencies. For nanocomposite, NaLuF4:Gd, Yb, Tm and TiO2 attach closely to each other and form compact interfaces, which benefit energy transfer processes.23 In contrast, there are no contact interfaces between NaLuF4:Gd, Yb, Tm and TiO2 particles in the physical mixture, thus the energy transfer is more difficult than that of the nanocompoiste.23
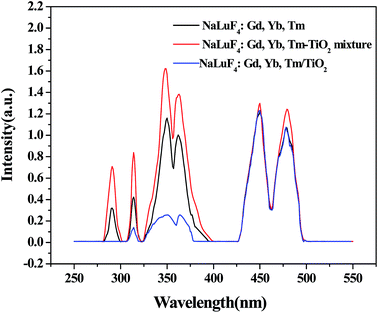 |
| | Fig. 4 Upconversion luminescent spectra of NaLuF4:Gd, Yb, Tm, NaLuF4:Gd, Yb, Tm–TiO2 nanocomposite, and NaLuF4:Gd, Yb, Tm–TiO2 physical mixture under 980 nm excitation. | |
3.4. Photocatalytic measurements
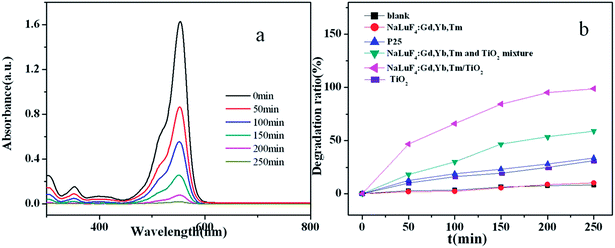
Firstly, RhB was used as a model pollutant to investigate the photocatalytic activity of NaLuF4:Gd, Yb, Tm–TiO2 nanocomposite. A 500 W xenon lamp (wavelength distribution: 300–2500 nm) was used as simulated solar light for light source. Upon irradiation for a designated time, 3 mL RhB aqueous solution was taken out for absorbance measurement. Fig. 5a shows the absorbance spectra of RhB catalyzed by the NaLuF4:Gd, Yb, Tm–TiO2 nanocomposite under simulated solar light irradiation as a function of the irradiation time. The absorption intensity of RhB at 554 nm decreases gradually with the increase in the irradiation time, indicating the degradation of RhB upon the solar light irradiation. The photocatalytic efficiency of the nanocomposite can be evaluated through calculating the time-depended degradation ratio of dye with contrast in blank, P25, TiO2, NaLuF4:Gd, Yb, Tm nanocrystal and NaLuF4:Gd, Yb, Tm–TiO2 physical mixture. It can be seen from Fig. 5b, the photocatalytic activity of NaLuF4:Gd, Yb, Tm–TiO2 nanocomposite is obviously higher than that of controls. The blank test confirms that RhB is quite stable. When catalyst is absent, no obvious change of RhB concentration is observed after irradiation for 250 min. The similar result is observed for using NaLuF4:Gd, Yb, Tm as catalyst, indicating NaLuF4:Gd, Yb exhibits no catalytic activity. The RhB is almost completely degraded (98.76%) in the presence of NaLuF4:Gd, Yb, Tm–TiO2 under the illumination of Xe lamp for 250 min, whereas the degradation ratios of NaLuF4:Gd, Yb, Tm–TiO2 physical mixture, P25 and TiO2 are only 58.9%, 33.6% and 27.3% respectively. The photocatalytic activity of NaLuF4:Gd, Yb, Tm–TiO2 nanocomposite is about 1.7 times higher than that of NaLuF4:Gd, Yb, Tm–TiO2 physical mixture, which can be assigned to the difference in their energy transfer efficiencies discussed above. There are no contact interfaces between NaLuF4:Gd, Yb, Tm and TiO2 particles in the physical mixture, thus the energy transfer efficiency is lower than that of the nanocompoiste.23 In comparison with commercial P25 which is a well-known benchmark catalyst, and pure TiO2, the photocatalytic activity of NaLuF4:Gd, Yb, Tm–TiO2 nanocomposite is remarkably higher (∼2.9 and 3.6 times), demonstrating that the as-prepared nanocomposite that composed with NaLuF4:Gd, Yb, Tm and TiO2 can significant improve the photocatalytic activity of pure TiO2. It is worth to note that the photocatalytic efficiency of the nanocomposite is higher than the ones reported in the literatures.15,16,22,23
 |
| | Fig. 5 Absorbance spectra of RhB catalyzed by the NaLuF4:Gd, Yb, Tm–TiO2 nanocomposite at different irradiation times under simulated solar light irradiation (a); photocatalytic degradation of RhB under simulated solar light irradiation (b). | |
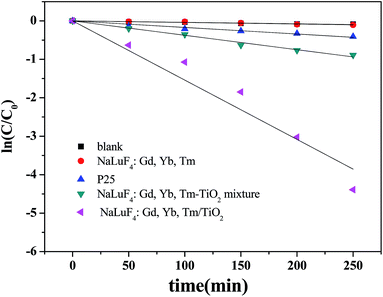
As shown in Fig. 6, the photocatalytic degradation of RhB catalyzed by the prepared samples fits a first-order reaction kinetics well, that is, −ln(C/C0) = kt, where k is the apparent rate constant. In our experiment, k is found to be 1.541 × 10⁻², 3.75 × 10⁻³ and 1.71 × 10⁻³ min−1 for NaLuF4:Gd, Yb, Tm–TiO2 nanocomposite, NaLuF4:Gd, Yb, Tm–TiO2 physical mixture and P25, respectively. The degradation rate of NaLuF4:Gd, Yb, Tm–TiO2 nanocomposite is about 9 times higher than that of P25. The high rate constant of NaLuF4:Gd, Yb, Tm–TiO2 further confirmed its high photocatalytic activity.
 |
| | Fig. 6 Kinetics of RhB degradation under solar light irradiation. | |
The adsorption of catalysts to contaminant molecules may affect the photocatalytic efficiency. Hence the adsorption levels of the samples for RhB were measured. As shown in Fig. 7, after 30 min dark adsorption under stirring, the concentrations of RhB remaining in solution are almost equal for different catalysts, indicating the adsorption ability of the prepared NaLuF4:Gd, Yb, Tm–TiO2 nanocomposite catalyst is almost the same as others, indicating that the higher catalytic activity of it is not caused by physical adsorption.
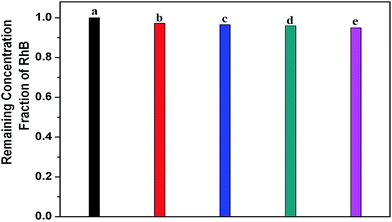 |
| | Fig. 7 Bar plot showing the remaining RhB in solution: (a) initial and equilibrated with (b) P25, (c) NaLuF4:Gd, Yb, Tm, (d) NaLuF4:Gd, Yb, Tm–TiO2 physical mixture, (e) NaLuF4:Gd, Yb, Tm–TiO2 nanocomposite. | |
The influence of the catalyst amount on the photocatalytic degradation of RhB was investigated by varying the amount of catalyst NaLuF4:Gd, Yb, Tm–TiO2 from 5 to 55 mg. Fig. 8 shows the changes of degradation ratios along with various amount of catalyst. The degradation ratio increases lineally as the increase of the catalyst amount in low concentration region, but decreases as the amount reaches to 20 mg. It implies that an optimized amount of catalyst is necessary for enhancing the degradation ratio. The redundant catalysts can enhance light reflectance and decrease light penetration.30
 |
| | Fig. 8 Influence of catalyst loading on the degradation of RhB under simulated solar light ([RhB] = 10 mg L−1, t = 250 min). | |
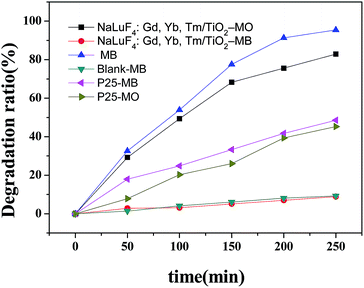
The photocatalytic activity of the prepared catalyst was also evaluated through photocatalytic degradation of MB and MO. As shown in Fig. 10, after illuminating the samples under Xe lamp for 250 min, the degradation ratios of MB and MO are 95.5% and 82.9%, respectively, In contrast, when P25 was used, the degradation ratios of MB and MO are 48.6% and 45.3%. These results demonstrate that the prepared catalyst can be used for the degradation of MB and MO as well. However, it needs to be noted that their degradation ratios are different under the same photocatalytic condition. This can be attributed to the different molecule structures of the dyes considering that the photodegradation of dyes depends on the structure and anchoring group of the dyes as well.31 The molecule structures of RhB, MB and MO are shown in Fig. 9. In general, benzene ring has the best stability and anthracene ring has the worst stability.32 Thus MO is more reluctant to photodegradation compared with the other two dyes. Structure with carboxylate as electron donor is favorable for the degradation reaction,33 thus RhB is comparative easy to be degraded.
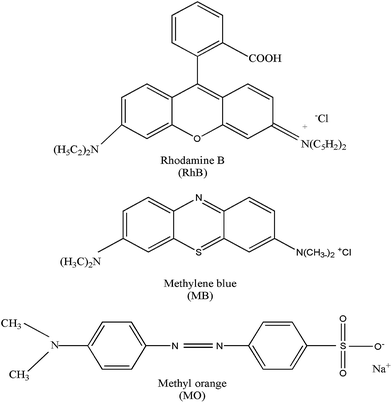 |
| | Fig. 9 Structure formulas of RhB, MB, and MO. | |
 |
| | Fig. 10 Photocatalytic degradation of MB and MO under simulated solar light irradiation. | |
In order to evaluate the mineralization extent of the dyes by photocatalysis, we further measured the chemical oxygen demand (COD) values and COD removal ratios of the dyes. The COD test measures the total quantity of oxygen required for the oxidation of organic matter to small species such as inorganic small molecules of CO2 and water. Hence it can be used to evaluate mineralization extent of dye.34,35 We measured the COD removal ratios of each dyes RhB, MB and MO, dye mixture that consist of equivalent RhB, MB and MO, and a dye wastewater sample taken from a textile printing factory. For all samples, the COD value of photocatalyzed solution was substantially reduced in contrast to that of the initial sample solution. As shown in Fig. 11, after treating with catalyst NaLuF4:Gd, Yb, Tm–TiO2 under simulated solar light irradiation for 250 min, the COD removal ratios of RhB, MB, MO, dye mixture and dye wastewater are 77.5%, 75.4%, 63.5%, 56.3% and 44.7%, respectively. These results indicate that large part of organic compounds was degraded to inorganic compound. It can be anticipate that, as the increase in irradiation time, the mineralization extent of dye and wastewater can be further elevated.
 |
| | Fig. 11 COD removal of dyes under simulated solar light irradiation. | |
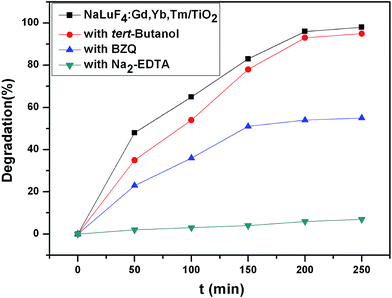
Furthermore, the active photo-induced radicals have been determined by collecting radical trapping results in the presence of different radical scavengers.36–38 In this study, three chemicals of p-benzoquinone (BZQ, a ˙O2− radical scavenger), disodium-ethylenediaminetetraacetate (Na2-EDTA, a hole scavenger) and tert-butanol (a ˙OH radical scavenger) were employed. The experimental results (Fig. 12) show that when Na2-EDTA scavenger for h+ is added to the reaction system, the photodegradation is greatly restrained compared to the reaction without radical scavengers, and the photocatalytic activity is obviously reduced when the BZQ scavenger for ˙O2− is added to the reaction system. Whereas, the presence of tert-butanol has no obvious effect on the photocatalytic activity. These results imply that h+ and ˙O2− are the main active species for the photocatalytic reaction.
 |
| | Fig. 12 Photocatalytic degradation ratio of RhB using different radical scavengers under simulated solar light irradiation. | |
3.5. Mechanism
As schematic shown in Fig. 13, the upconversion nanocrystal of NaLuF4:Gd, Yb, Tm absorbs energy from the solar lights and upconverts them into UV light emission, which can be absorbed by TiO2 and generate high energy electrons and holes in the conduction band (CB) and the valence band (VB). These electron–hole pairs then migrate from inner region to the surfaces and act as the catalytic centre. These holes and electrons having high oxidative and reductive abilities can not only directly decompose the organic dye, but also degrade the organic dye indirectly through ˙OH and ˙O2− radicals that are produced from oxidizing H2O molecules and reducing O2 molecules by the holes and electrons, respectively.23
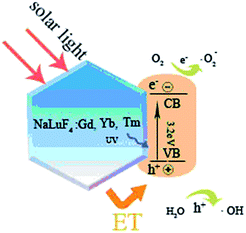 |
| | Fig. 13 Illustrative diagrams of energy transfer process between NaLuF4:Gd, Yb, Tm and TiO2, and the generation of ˙OH and ˙O2− radicals. | |
3. Conclusions
In this paper, a novel NaLuF4:Gd, Yb, Tm–TiO2 nanocomposite photocatalyst was synthesized. The hexagonal-phase nanocrystals NaLuF4:Gd, Yb, Tm were prepared by a solvothermal method firstly, the small-sized anatase TiO2 nanoparticles were then attached on NaLuF4:Gd, Yb, Tm nanocrystals via a hydrolysis and a hydrothermally annealing. Its photocatalytic activity was investigated via photocatalytic degradation of RhB, MB, MO, dye mixture and dye wastewater under the simulated solar light irradiation. The degradation ratios and the COD removal ratios of the dyes and wastewater were measured. In comparison to the pure TiO2 and P25, the photocatalytic activity of the composite catalyst has been substantially improved. Overall, this report presents an approach to enhance the solar light harvesting ability of TiO2 based catalytic materials. Considering the catalytic activity of the nanocomposite to real-life wastewater, it can be expected that the prepared product is potential to be used for environmental cleaning.
Acknowledgements
The authors acknowledge the National Natural Science Foundation of China (no. 21271126, 11025526), National 973 Program (no. 2010CB933901), and Program for Innovative Research Team in University (no. IRT 13078).
Notes and references
- M. S. Dresselhaus and I. L. Thomas, Nature, 2001, 414(6861), 332–337 CrossRef CAS PubMed.
- M. G. Walter, E. L. Warren, J. R. McKone, S. W. Boettcher, Q. X. Mi, E. A. Santori and N. S. Lewis, Chem. Rev., 2010, 110(11), 6446–6473 CrossRef CAS PubMed.
- X. Yang, J. Qin, Y. Li, R. Zhang and H. Tang, J. Hazard. Mater., 2013, 261, 342–350 CrossRef CAS PubMed.
- X. Yang, J. Qin, Y. Jiang, R. Li, Y. Li and H. Tang, RSC Adv., 2014, 4(36), 18627–18636 RSC.
- H. Tang, D. Zhang, G. Tang, X. Ji, W. Li, C. Li and X. Yang, Ceram. Int., 2013, 39(8), 8633–8640 CrossRef CAS PubMed.
- G. Tang, S. Liu, H. Tang, D. Zhang, C. Li and X. Yang, Ceram. Int., 2013, 39(5), 4969–4974 CrossRef CAS PubMed.
- M. Koelsch, S. Cassaignon, C. T. T. Thanh Minh, J. F. Guillemoles and J. P. Jolivet, Thin Solid Films, 2004, 451(542), 86–92 CrossRef PubMed.
- G. Liu, Y. N. Zhao, C. H. Sun, F. Li, G. Q. Lu and H. M. Cheng, Angew. Chem., 2008, 47(24), 4516–4520 CrossRef CAS PubMed.
- R. Asahi, T. Morikawa, T. Ohwaki, K. Aoki and Y. Taga, Science, 2001, 293, 269–271 CrossRef CAS PubMed.
- Y. Izumi, T. Itoi, S. Peng, K. Oka and Y. Shibata, J. Phys. Chem. C, 2009, 113(16), 6706–6718 CAS.
- J. L. Zhang, Y. M. Wu, M. Y. Xing, S. A. K. Leghari and S. Sajjad, Energy Environ. Sci., 2010, 3(6), 715–726 CAS.
- G. L. Huang and Y. F. Zhu, J. Phys. Chem. C, 2010, 114(3), 1512–1519 Search PubMed.
- J. Wang, F. Y. Wen, Z. H. Zhang, X. D. Zhang, Z. J. Pan, P. Zhang, P. L. Kang, J. Tong, L. Wang and L. Xu, J. Environ. Sci., 2005, 17(5), 727–730 CAS.
- G. J. Feng, S. W. Liu, Z. L. Xiu, Y. Zhang, J. X. Yu, Y. G. Chen, P. Wang and X. J. Yu, J. Phys. Chem. C, 2008, 112(35), 13692–13699 CAS.
- D. G. Yin, L. Zhang, B. H. Liu and M. H. Wu, J. Nanosci. Nanotechnol., 2014, 14(8), 6077–6083 CrossRef PubMed.
- J. K. Zhou, M. Takeuchi, X. S. Zhao, A. K. Raya and M. Anpo, Catal. Lett., 2006, 106(1), 67–70 CrossRef CAS PubMed.
- W. P. Qin, D. S. Zhang, D. Zhao, L. L. Wang and K. Z. Zheng, Chem. Commun., 2010, 46(13), 2304–2306 RSC.
- L. Ren, X. Qi, Y. D. Liu, Z. Y. Huang, X. L. Wei and J. Li, J. Mater. Chem., 2012, 22(23), 11765–11771 RSC.
- D. G. Yin, K. L. Song, J. Ouyang, C. C. Wang, B. Liu and M. H. Wu, J. Nanosci. Nanotechnol., 2013, 13(6), 4162–4167 CrossRef CAS PubMed.
- Q. Liu, Y. Sun, T. S. Yang, W. Feng, C. G. Li and F. Y. Li, J. Am. Chem. Soc., 2011, 133(43), 17122–17125 CrossRef CAS PubMed.
- F. Shi, J. S. Wang and X. S. Zhai, CrystEngComm, 2011, 13(11), 3782–3787 RSC.
- D. G. Yin, L. Zhang, B. H. Liu and M. H. Wu, J. Nanosci. Nanotechnol., 2012, 12(2), 937–942 CrossRef CAS PubMed.
- Y. N. Tang, W. H. Di, X. S. Zhai, R. Y. Yang and W. P. Qin, ACS Catal., 2013, 3(3), 405–412 CrossRef CAS.
- H. L. Chen, G. Yang, Y. J. Feng, C. L. Shi, S. R. Xu, W. P. Cao and X. M. Zhang, Chem. Eng. J., 2012, 198, 45–51 CrossRef PubMed.
- A. Xia, M. Chen, Y. Gao, D. M. Wu, W. Feng and F. Y. Li, Biomaterials, 2012, 33(21), 5394–5405 CrossRef CAS PubMed.
- J. Zhang, H. O. Shen, W. Guo, S. H. Wang, C. T. Zhu, F. Xue, J. F. Hou, H. Q. Su and Z. B. Yuan, J. Power Sources, 2013, 226, 47–53 CrossRef CAS PubMed.
- T. Jiang, Y. Liu, S. S. Liu, N. Liu and W. P. Qin, J. Colloid Interf. Sci., 2012, 377(1), 81–87 CrossRef CAS PubMed.
- J. Sytsma, G. F. Imbush and G. Blasse, J. Phys.: Condens. Matter, 1990, 2(23), 5171 CrossRef CAS.
- F. Wang, Y. Han, C. S. Lim, Y. Lu, J. Wang, J. Xu, H. Chen, C. Zhang, M. Hong and X. Liu, Nature, 2010, 463(7284), 1061–1065 CrossRef CAS PubMed.
- B. F. Gao, Y. Ma, Y. Cao, W. S. Yang and J. N. Yao, J. Phys. Chem. B, 2006, 110(29), 14391–14397 CrossRef CAS PubMed.
- D. Zhao, C. C. Chen, Y. F. Wang, W. H. Ma, J. C. Zhao, T. Rajh and L. Zhang, Environ. Sci. Technol., 2007, 42(1), 308–314 CrossRef.
- H. Y. Huo, H. J. Su, W. Jiang and T. W. Tan, Biochem. Eng. J., 2009, 43(1), 2–7 CrossRef CAS PubMed.
- X. M. Song, J. M. Wu and M. Yan, Thin Solid Films, 2009, 517(15), 4341–4347 CrossRef CAS PubMed.
- K. Vignesha, A. Suganthia, M. Rajarajanb and R. Sakthivadivel, Appl. Surf. Sci., 2012, 258(10), 4592–4600 CrossRef PubMed.
- V. K. Gupta, R. Jain, S. Agarwal, A. Nayak and M. J. Shrivastava, Colloid Interface Sci., 2012, 366(1), 135–140 CrossRef CAS PubMed.
- X. Yang, H. Cui, Y. Li, J. Qin, R. Zhang and H. Tang, ACS Catalysis, 2013, 3(3), 363–369 CrossRef CAS.
- H. Cui, X. Yang, Q. Gao, H. Liu, Y. Li, H. Tang, R. Zhang, J. Qin and X. Yan, Mater. Lett., 2013, 93, 28–31 CrossRef CAS PubMed.
- X. Yan, Q. Gao, J. Qin, X. Yang, Y. Li and H. Tang, Ceram. Int., 2013, 39(8), 9715–9720 CrossRef CAS PubMed.
Footnote |
| † Chengcheng Wang, Kailin Song and Yi Feng are co-first author. |
|
| This journal is © The Royal Society of Chemistry 2014 |
Click here to see how this site uses Cookies. View our privacy policy here. 


