DOI:
10.1039/C4RA05556J
(Paper)
RSC Adv., 2014,
4, 33408-33415
Facile synthesis of ultrasmall TiO2 nanocrystals/porous carbon composites in large quantity and their photocatalytic performance under visible light†
Received
10th June 2014
, Accepted 14th July 2014
First published on 17th July 2014
Abstract
In this paper, we demonstrate a facile and scalable route to the preparation of composites containing ultrasmall TiO2 nanocrystals and porous carbon matrix. In this method, the titanium ions are covalently introduced to polymer chains and transformed into TiO2 nanocrystals directly in solid matrices, which allows the generation of well dispersed TiO2 nanocrystals with small size in the entire carbon matrix. To our knowledge, this is the first time that ultrasmall TiO2 nanocrystals are incorporated into a bulk porous carbon matrix. In comparison with pure TiO2 particles, the composites exhibit significant improvement in photocatalytic degradation of methyl blue under visible light irradiation, which might be attributed to the ultrasmall size of TiO2 nanocrystals as well as the high separation efficiency of photogenerated electrons and holes based on the synergistic effect between TiO2 nanocrystals and carbon matrices. Furthermore, the composites could be easily recycled without obvious activity loss.
1. Introduction
Photocatalytic oxidation of hazardous organic pollutants in water has aroused tremendous attention as a promising technology for pollution abatement.1–4 Among various oxide semiconductor photocatalysts, TiO2 has been recognized as the most suitable material for widespread environmental applications owing to its low cost, photochemical stability, low toxicity and unique opto-electronic properties.5–9 The photocatalytic activity of TiO2 depends strongly on three properties: crystal phase, size, and light-use efficiency.10–12 TiO2 exhibits three crystal phases. The most catalytically active phase is anatase, the most stable phase is rutile, and the third phase is brookite. Catalytic activity is even higher when TiO2 contains a mixture of phases.13–15 The size of the nanometric TiO2 building units is another important factor that influences the performance of TiO2. Because the increased surface-to-volume ratio can facilitate reaction/interaction between TiO2 and the interacting media, which mainly occurs on the surface or at the interface. It has been found that a decrease in the size of the TiO2 particles will enhance the total photoreactivity of TiO2. Therefore, a great deal of attention has been given to sculpturing TiO2 into nanometer-sized particles, especially with diameters in the range 1–10 nm.16–21 To date, most of the synthetic methods applied for ultrasmall TiO2 nanoparticles are based on the hydrolytic sol–gel method. The nanoparticles thus produced are typically amorphous and often required post calcinations at high temperatures to improve the crystallinity of the TiO2 nanoparticles. Such a high temperature process would unavoidably result in size increase and particle agglomeration in the solid state. To obtain highly crystalline TiO2 with ultrasmall size and narrow size distribution, incorporating ultrasmall TiO2 into inorganic or organic matrices is a meaningful objective.
Among the inorganic matrices, carbon matrices have received great attention, not only because carbon could effective stabilize TiO2 particles, but also because carbon doping would improve the light-use efficiency and extend the photoresponse of TiO2 to visible region.22–27 As we know, TiO2 possesses a wide band gap (3.20 eV) which limits its photo-absorption to only the UV region, accounting for about 4% of the total sunlight. From the perspective of both chemistry and practical applications, it is undoubtedly important to develop photocatalytic materials that harvest a wide range of visible photons. Nowadays there are mainly two strategies to extend the absorption of TiO2 to visible spectrum. One way is doping TiO2 with transition metals ions such as Fe, Co, Cr or V.28–31 Such metal doped materials are often challenging, however, in terms of the thermal stability and photocorrosion of the materials, as well as the remarkably increased electro/hole recombination of defect sites, which results in a low photocatalytic efficiency. Another way is non-metal (such as C, N, B etc.) doping,32–34 which has since proved to be more successful and has been extensively investigated. For carbon-modified TiO2 catalysts, the activity in visible light was always ascribed to the substitution doping of lattice O by C during synthesis. The formed O–Ti–C bonds construct a hybrid orbital above the valence band of TiO2, which causes visible light absorbance. However, the doping carbon distorts the lattice of TiO2, which also increases the probability of electron/hole recombination. An ideal solution to this problem is to couple TiO2 with carbonaceous materials as a visible light sensitizer via C–O–Ti bonds.35 In this situation, the C element cannot be doped directly into lattice of TiO2 and the desired charge transfer can be realized. In recent years, TiO2 nanocrysltas/carbon composite catalysts with various shape and structures have been successfully prepared. However, traditional methods are limited to prepare composites with nano or micro dimensions, which may suspend in water and suffer some degree of weight lost in the process of photocatalytic reaction and separation. That may re-pollute the treated water again. Furthermore, only small quantity of product can be obtained by traditional methods, which also limits the application of TiO2 Nan crystals/carbon composite catalysts. Consequently, it is certainly needed to establish a method for the preparation of TiO2/carbon composites with bulk dimension and large quantity, which are more optimized systems to enable the application of ultrasmall TiO2 photocatalysts.
Herein we present a facile approach to the large-quantity synthesis of ultrasmall TiO2 nanocrystals/porous carbon composites by using a titanium-ion containing polymer precursor. A key issue to the incorporation of ultrasmall TiO2 nanoparticles in bulk carbon matrix is the ability to control the particle size and avoid particle aggregation. Different from traditional methods, in which TiO2 nanoparticles usually have to be prepared in advance, the novelty of our method is the titanium ions are introduced into polymer matrices uniformly by covalent bonds first, and transformed into TiO2 directly in solid matrices, which allows the generation of high-quality ultrasmall TiO2 nanocrystals with narrow size distribution in the entire matrix. The surface grafted carbon act as a visible light sensitizer via C–O–Ti bonds, therefore the composites exhibit enhanced photocatalytic activity in visible light region. In this method, TiO2 particle size, crystal phase, and light-use efficiency can be controlled in a single process. Furthermore, such TiO2/carbon composites could be easily recycled without activity decrease due to their bulk dimensional structure property.
2. Experimental
2.1. Materials
Tetrabutyl titanate [Ti(OBu)4, 99%], methacrylic acid (MA) and azobisisobutyronitrile (AIBN) were purchased from Aladdin Reagent Company (Shanghai, China). Ti(OBu)4 was used as received without further purification. MA was distilled before use. AIBN was recrystallized from ethanol prior to use. The water used in the experiments was deionized with a resistivity of 18 MΩ cm−1.
2.2. Preparation of TiO2–C composites
In a typical synthesis, stoichiometric Ti(OBu)4 and MA were mixed (in this study, the molar ration of Ti(OBu)4 and MA is 1
:
2) under magnetic stirring. After stirring the mixture for 12 h, the generated butanol was remode from the system by vacuum distillation. Then the mixture was pre-polymerized in a glass tube in an oil bath at 70 °C for 20 min using 0.3 wt% AIBN as initiator. Then the glass tube was put into an oven at 70 °C for 18 h, then at 80 °C, 90 °C and 100 °C for 1 h each, and finally at 120 °C for 4 h. After cooling and demolding, titanium ion-containing polymeric sample was obtained. Finally, the polymeric sample was heated in N2 atmosphere at high temperature for 1 h (the heating rate is 10 K min−1), and TiO2–C composites were obtained. The samples were designated using a code comprised of heating temperature (in °C). For example, TiO2–C-900 denotes a sample heated at 900 °C.
2.3. Photocatalytic experiments
The photocatalytic activity of the samples was evaluated by the degradation of methyl blue (MB) under visible light irradiation. A 500 W Xe lamp was positioned inside a cylindrical vessel, surrounded by a circulating water jacket for cooling. A 200 mL cylindrical quartz vessel was used as photocatalysis reactor. Before the measurement of photoactivity, the TiO2–C samples were saturated by the MB. Specifically, 25 mg of photocatalyst was saturated by 50 mL MB solution with a high concentration of 2.5 × 10⁻⁴ mol L−1 in dark for 12 h to ensure the establishment of an adsorption–desorption equilibrium. Then the solvent was removed by centrifugation and the collect photocatalysts were left to dry. Subsequently, the saturated sample was transferred into 50 mL aqueous solution of MB with a concentration of 2.5 × 10⁻⁵ mol L−1. After stirring in dark for 1 h, the suspension was irradiated with visible light using cutoff filter to remove light of λ < 420 nm. The distance between the sample and light source was about 15 cm. During the irradiation, 3 mL samples of the suspension were removed at regular intervals and filtrated to completely remove the catalyst. The change of MB absorbance in the solution was used to monitor the extent of the reaction at given irradiation time intervals.
2.4. Characterization
TEM images and SEAD patterns were obtained by employing a FEI Tecnai G2 F30 transmission electron microscope, using an accelerating voltage of 300 kV. Powder X-ray diffraction (XRD) data were collected on a Rigaku D/Max-2500 X-ray diffractometer using a Cu target radiation source. Fourier-transform infrared (FTIR) spectra were recorded with KBr disks containing the powder sample with a Nicolet AVATAR 360 FT-IR spectrometer. UV-vis diffuse reflectance and adsorption spectra were recorded at room temperature using a SHIMADZU 3100 UV-vis-near-IR spectrophotometer. Thermogravimetric analysis (TGA) measurements were performed on bulk samples with small grain sizes using a Netzsch STA 449C thermogravimetric analyzer. The Jobin Yvon (JY-HR-800 France), confocal micro Raman spectrometer was employed, using the 458 nm line of an Ar laser as the excitation source. Brunauer–Emmett–Teller (BET) measurements were performed by using a Micromeritics ASAP 2010 M analyzer.
3. Results and discussion
3.1. Synthetic pathway for the preparation of the TiO2 nanocrystals/porous carbon composites
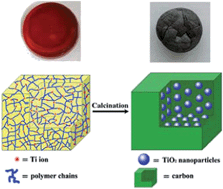
The preparation procedure of the TiO2 nanocrystals/porous carbon composites is illustrated schematically in Fig. 1. Firstly, a titanium ion-containing monomer was synthesized by modification tetrabutyl titanate (Ti(OBu)4) with MA by a ligand exchange/substitution reaction.36,37 When Ti(OBu)4 was dissolved in MA solvent, the ligand exchange/substitution reaction took place instantaneously at room temperature without any catalyst. In the FTIR spectrum of the as-prepared titanium ion containing monomer (Fig. S1†), the presence of the asymmetric and symmetric stretching vibrations of carboxylate groups appearing at 1539 and 1420 cm−1 demonstrate the successful coordination of MA to titanium ions through the carboxyl groups. Secondly, the as-prepared titanium ion-containing monomer was polymerized with MA in the presence of AIBN as radical initiator. As a result, finely dispersed titanium ions were introduced into bulk polymer matrix. Finally, the TiO2–C composites were prepared from the titanium ion-containing polymer precursor by a pyrolysis reaction.
 |
| Fig. 1 Scheme of the synthesis of the TiO2–C composite. | |
3.2. Morphology and structure of the TiO2 nanocrystals/porous carbon composites
The introduction of titanium ions in polymer matrix provides an opportunity to generate TiO2 directly in solid carbon during the pyrolysis process, which allows the generation of well-dispersed ultrasmall TiO2 nanocrystals. During the pyrolysis process of polymer precursor, the Ti ions can be transformed into ultrasmall TiO2 nanocrystals, and the organic polymer can be converted into carbonaceous structures. Fig. 2a shows a typical TEM image and the corresponding energy-dispersive spectroscopy (EDS) spectrum of the TiO2–C composites calcined at 900 °C. The EDS spectrum gives signals of the expected elements, i.e., Ti, O and C. From the TEM image, we can see the TiO2 nanocrystals with diameters of approximately 6–8 nm are separated from each other and are well dispersed in the porous carbon matrix. This is mainly because, throughout the thermal conversion process, the Ti ions were always surrounded by polymer or carbon networks, which effectively prevented the TiO2 nanocrystals from growing further after nucleation. High-resolution (HR)-TEM image (Fig. 2b) of the TiO2–C composites show perfectly crystallized nanomaterial, with the carbon matrix being deposited between nanocrystals. Such “brick and mortar” – type 3D construction effectively avoids the aggregation of TiO2 nanocrystals, which is important for maintaining the stability and photocatalytic activities of the small TiO2 nanocrystals. The related selected-area electron diffraction (SAED) pattern (inset of Fig. 2b) exhibits diffraction rings corresponding to the (101), (004), (200), (211), (204) and (105) planes of anatase TiO2. In the HRTEM image shown in Fig. 2c, the interlayer distance is calculated to be 0.351 nm, which agrees well with the separation between the (101) lattice planes. The HRTEM image in Fig. 2d shows two groups of lattice planes in the TiO2 particle. They are attributed to the (100) and (101) lattice planes, with interplanar spacings of 0.378 and 0.351 nm respectively.
 |
| Fig. 2 TEM image (a) and HRTEM images (b, c and d) of the TiO2–C-900. (Inset of (a) EDS spectrum of the TiO2–C-900. Inset of (b) SAED pattern of the TiO2–C-900.) | |
More detailed information regarding the crystal phase of the TiO2 nanocrystals was characterized by XRD measurements. For comparison, we calcined the titanium ion-containing polymer precursors at 700 °C, 800 °C, 900 °C (denoted as TiO2–C-700, TiO2–C-800, TiO2–C-900), respectively, and their XRD patterns are shown in Fig. 3. We can see that almost all main diffraction reflections can be assigned to the tetragonal body-centered structure of the anatase phase, with cell parameters a = 3.784, c = 9.512 (JCPDS no. 841285). Furthermore, the average size of the TiO2 nanocrystals in TiO2–C-900 calculated by the Debye–Scherrer diffraction formula (d = kλ/β
cos
θ) to the (101) reflection is about 7.5 nm, which is in good agreement with the result of the TEM image. In the XRD spectrum of TiO2–C-900, in addition to the peaks belonged to anatase phase, there are also small peaks (marked with *) on the higher angle sides of the anatase (101) and (004) peaks, which can be assigned to small amounts of rutile present in the sample. As we know, the anatase-to-rutile phase transformation in TiO2 has received much attention as the phase structure of TiO2 nanomaterials largely determines their suitability for practical applications.38–41 It has been documented that the transformation usually occurred at around 600 °C under normal conditions, and many attempts such as doping have been made to inhibit the phase transformation of anatase.40,41 In this study, a notable feature is the anatase TiO2 nanocrystals show extremely high stability; the anatase phase still exist as the predominant crystal phase even after being calcined at 900 °C. It has been demonstrated that the phase transformation of TiO2 particles usually start from the interfaces of contacting anatase grains, which provide the nucleation sites of the rutile phase.38,39 In these “brick and mortar” structured composites, TiO2 nanocrystals was separated by carbon, therefore the interfacial nucleation sites were largely eliminated, leading to a remarkably enhanced phase stability.
 |
| Fig. 3 Power XRD patterns of the TiO2–C-700, TiO2–C-800, TiO2–C-900. | |
The textural characteristic of the TiO2–C samples prepared at different temperature were quantified by measuring the nitrogen adsorption isotherms. The inset of Fig. 4a depicts the N2 adsorption–desorption isotherms with a hysteresis loop, indicating the mesoporous nature of the composites. The BET surface areas are 136, 129 and 125 m2 g−1 for TiO2–C-700, TiO2–C-800 and TiO2–C-900, respectively. As the temperature increases, the surface area decreases; however, the pore size increases as the temperature is raised. Similar results were reported by Gedanken et al.8 The pore size distributions of TiO2–C composites prepared at different temperature were measured by BJH desorption isotherms, which are shown in Fig. 4a. The TiO2–C-700 has unimodal, narrow pore size distribution with a maximum around 3.4 nm. In TiO2–C-800 and TiO2–C-900, the pore size distribution is also unimodal but with a maximum at about 3.9 and 5.5 nm, respectively. Such porous structures would undoubtedly favor the adsorption and diffusion of hazardous organic pollutants to these composite photocatalysts.
 |
| Fig. 4 (a) Pore size distribution of the TiO2–C-700, TiO2–C-800, TiO2–C-900. Inset: N2 adsorption–desorption isotherms of the corresponding composites. (b) TGA curve of the TiO2–C-700, TiO2–C-800, TiO2–C-900 composites at air atmosphere (heating rate: 10 °C min−1). | |
The carbon content in the TiO2–C composite sample can be adjusted by changing the calcination temperature. In order to determine the carbon content in the composites, TGA measurements were carried out. Fig. 4b illustrates TGA curves of composites calcined at different temperature. In all the samples no obvious weight loss is observed until 350 °C. Major weight loss commence at around 350 °C, which can be attributed to the combustion of the carbon matrices. The carbon content of the composite samples decreased with increasing calcination temperature, and is therefore easily controlled by changing the calcination temperature. For example, the carbon content of sample TiO2–C-900 was calculated to be approximately 11.3%, while the carbon content are 13.2% and 17.8% for TiO2–C-800 and TiO2–C-700, respectively.
To study the chemical and bonding environment of the TiO2 nanocrystals and carbon matrix, X-ray photoelectron spectroscopy (XPS) analysis was utilized. The results of TiO2–C-900 are showed in Fig. 5. The fully scanned spectrum (Fig. 5a) demonstrates that Ti, O and C elements exist in the composites. The oxidation state of the Ti in the composites is shown in Fig. 5b. The two bands located at 464.6 and 458.9 eV are attributed to the Ti 2p1/2 and Ti 2p3/2 spin-orbital splitting photoelectron, respectively. The splitting between Ti 2p1/2 and Ti 2p3/2 is 5.7 eV, indicating a normal state of Ti4+ in the composites.42,43 The main C 1s peak is dominated by elemental carbon at 284.6 eV, attributed mainly to the C–C, C
C and C–H bongs of sp2 hybridized carbon. Two weak peaks at 286.0 and 289.1 eV are assigned to the oxygen bound species C–O and C
O respectively.44,45 It is worth noting that no C 1s peak at ∼281 eV (Ti–C bond) was observed, and the chemical environments for Ti were not changed, strongly suggesting that carbon does not enter the TiO2-phase. Moreover, as shown in Fig. 5d, the O 1s spectrum exhibits a shoulder at the high binding energy side of the main O 1s peak, indicating there are several kinds of oxygen chemical states coexist. By fitting the O 1s XPS spectrum, three dominant peaks can be obtained. The peaks at 530.2 and 531.3 eV are assigned to the oxygen in the TiO2 crystal lattice and in chemisorbed water, respectively. The peak at 532.8 eV can be assigned to the oxygen in the C–O–Ti bond.46 These observations illustrate that the graphite carbon here should be deposited onto the surface of TiO2 through chemical bonds (C–O–Ti), which would favoring the desired charge transfer upon light excitation.
 |
| Fig. 5 XPS spectra of the TiO2–C-900: fully scanned spectrum (a), Ti 2p spectrum (b), fitting spectra of C 1s (c) and O 1s (d). | |
Fig. 6a shows the optical absorption of composite sample compared with the absorption spectrum of P25 and carbon. P25 only exhibits the fundamental absorption band in the UV region as expected. However, the composite sample TiO2–C-900 absorb in the whole visible region due to the presence of carbon coating on TiO2. The absorption edge of anatase TiO2 can also be detected. The optical band gap was estimated to be about 3.18 eV according to the UV-vis spectral analysis based on the Kubelka–Munk formula. The significant enhancement of visible light absorption in TiO2–C-900 is contributed to the synergistic effect of TiO2 and carbon. The carbon matrix thereby can photosensitize TiO2 and permit it to respond in a wide range of solar spectrum.
 |
| Fig. 6 (a) UV-vis diffuse reflectance spectra of TiO2–C-900 composite and pure TiO2 (P25) and carbon. (b) Photocatalytic degradation of MB in the present of TiO2–C and other control samples under visible light irradiation. (c) Photocatalytic activity of TiO2–C-900 for MB degradation with three times of cycling uses. (d) ·OH trapping photoluminescence spectra for TiO2–C-900 obtained after visible light irradiation. | |
3.3. Visible light photocatalytic performance of the composite samples
Since UV-vis absorption spectra clearly demonstrate that the optical response of TiO2–C samples shift to the visible light region, we hoped that the composite samples present photochemical activity in the visible light region. The photocatalytic performance of the composites was evaluated by degradation of methyl blue (MB) in aqueous solution under visible light irradiation. It is noteworthy that the decrease of MB concentration can be caused by two possibilities: adsorption and photodecomposition by catalysts. To evaluate the photoactivity by separating it from adsorptivity, the TiO2–C powder samples were adequately saturated by MB in the dark before light irradiation.24 Fig. 6b shows time profiles of C/C0 under visible light irradiation, where C is the concentration of MB at the irradiation time t and C0 the initial concentration of MB. For comparison, the catalytic activities of some control samples were also tested. It can be seen, no appreciable degradation of MB is observed after 3 h in the absence of photocatalysts, meaning that the MB is stable to visible light irradiation. Both the physical mixture of TiO2 nanoparticles and carbon, as well as the commercial P25 shows only an activity level comparable with the self-degradation of MB under the same irradiation conditions. However, as expected, TiO2–C composites show good photocatalytic activity under visible light irradiation. We believe that the high catalytic activity of TiO2–C composites could be largely attributed to the ultrasmall size of TiO2 nanocrystals and charge transfer between nanocrystals and the carbon matrix. When the TiO2 particle size reduced, the distance that the photogenerated electrons and holes need to travel to surface reaction sites is reduced, thereby reducing the recombination probability and enhancing the photoactivity.47 Notably, among the composite samples prepared at different temperature, TiO2–C-900 exhibits higher degradation efficiency than TiO2–C-800 and TiO2–C-700. This may be attributed to better crystalline nature, low carbon content, and bigger pore size. The TiO2–C-900 has broader active pore size, thus more MB molecules can diffuse into large pores and reach the active sites effectively. In addition, the lower carbon content is manifested in a thinner carbon coating layer, which enables the MB solution to get to the active site easier and faster. We also tested the cycling performance of the composite catalyst. Fig. 6c shows the photocatalytic degradation of MB over TiO2–C-900 under visible light irradiation with three time cycling uses. It clear illustrates that as-prepared composites with high photocatalytic activity can be easily recovered, and would greatly promote their industrial application to eliminate the organic pollutants from wastewater.
3.4. Possible mechanism in visible light photocatalysis of the composite samples
The mechanism about the visible light photocatalysis of the as-prepared samples is worthy of further discussion. Actually, the above photocatalytic experiments suggests that the carbon species not only act as adsorbent and dispersing agent, but also act as photosensitizer, since pure TiO2 shows relatively poor catalytic efficiency under visible light irradiation. On the other hand, it seems that, under visible light irradiation the TiO2–C can induce the formation of hydroxyl radicals, which is a strong oxidizing agent to decompose the organic dye. Nevertheless, this ability relies on the fact that the hole in this system is located near the valance band of TiO2, as it needs about 2.4 eV versus normal hydrogen electrode at pH 7 to drive the hydroxyl radical formation.
Based on the above results and theory analyses, we propose that the carbon species coating on the surface of TiO2 are likely to carry out a charge transfer process and responsible for the photosensitized photocatalysis. The TiO2–C composites first absorb visible light, and the graphic carbon was excited. The excited electron in the carbon is transferred into the conduction band of the TiO2, permitting a reduction process, such as the formation of superoxide radicals by adsorbed molecular oxygen. Such electron transfer from sensitizer to TiO2 is consistent with traditional theory about the sensitization of TiO2 by chemical species (such as polymer, carbon nanotube, and other carbon species, et al.).48–51 Simultaneously, a hole might be generated by electron migrating from TiO2 valence band to graphic carbon. That means when the sample was excited by visible light, the electron was more located at the carbon, while the hole stayed electronically and structurally near TiO2,9,35 as only in this situation we can subsequently convert a surface bound water molecule into a hydroxyl radical. In order to detect the generation of hydroxyl radicals in the system, a terephthalic acid photoluminescence probing assay (TA-PL)52 was carried our. Fig. 6d shows the fluorescence spectra of the terephthalic acid solution in the presence of TiO2–C-900 under visible light. We can see the fluorescence intensity increases steadily with irradiation time. This suggests that photooxidation by hydroxyl radicals is the main reaction path in the composites.
From a different view, we can consider the TiO2 in the composites as electron mediator. Effective transfer of photogenerated charge and reduction the chance of charge recombination is the key issue in this system. The as-prepared TiO2–C composites exhibit a specific and unique structural feature: the ultrasmall TiO2 nanocrystals disperse finely in the porous carbon matrix. Such unique “brick and mortar” – type 3D construction would assure an excellent a very rapid vectorial transport of photogenerated charge carriers (electrons or holes) through the grain boundaries.
4. Conclusions
In conclusion, we have developed a facile method for the incorporation of unstable ultrasmall TiO2 nanocrystals into bulk porous carbon matrices without aggregation. This novel strategy for the formation of TiO2–C composites exhibits a key feature: the titanium ions are covalently introduced into polymer chains and transformed into TiO2 nanocrystals directly in solid matrices, which allows the generation of well dispersed TiO2 nanocrystals with small size in the entire carbon matrices. The as-prepared bulk heterojoint materials exhibit enhanced visible photocatalytic properties, and consequently should greatly promote the industrial application of TiO2–C composites to eliminate the organic pollutants from wastewater. Since the carboxyl group can bond not only with titanium but also a wide range of other metal ions, our strategy would also be extended to carbon composites with diverse functionality.
Acknowledgements
This work was supported by the National Nature Science Foundation of China (Grant no. 21104011, 51273051, 21174033), the Fundamental Research Funds for the Central Universities (Grant no. HIT.NSRIF.2012042), the Development Program for Outstanding Young Teachers in Harbin Institute of Technology (HITQNJS.2009.067), the China Postdoctoral Science Foundation (no. 20080440863), the Heilongjiang Postdoctoral Science Foundation (no. LBH-Z08202) and the Heilongjiang Postdoctoral Science-Research Foundation (no. LBH-Q13057).
References
- M. R. Hoffmann, S. T. Martin, W. Choi and D. W. Bahnemann, Chem. Rev., 1995, 95, 69 CrossRef CAS.
- K. Woan, G. Pyrgiotakis and W. Sigmund, Adv Mater., 2009, 21, 2233 CrossRef CAS PubMed.
- M. N. Chong, B. Jin, C. W. K. Chow and C. Saint, Water Res., 2010, 44, 2997 CrossRef CAS PubMed.
- Y. Hu, X. Gao, L. Yu, Y. Wang, J. Ning, S. Xu and X. W. Lou, Angew. Chem., Int. Ed., 2013, 52, 5636 CrossRef CAS PubMed.
- X. Chen and S. S. Mao, Chem. Rev., 2007, 107, 2891 CrossRef CAS PubMed.
- Y. Gao, X. Pu, D. Zhang, G. Ding, X. Shao and J. Ma, Carbon, 2012, 50, 4093 CrossRef CAS PubMed.
- J. Zhuang, Q. Tian, H. Zhou, Q. Liu, P. Liu and H. Zhong, J. Mater. Chem., 2012, 22, 7036 RSC.
- S. Shanmugam, A. Gabashvili, D. S. Jacob, J. C. Yu and A. Gedanken, Chem. Mater., 2006, 18, 2275 CrossRef CAS.
- P. Zhang, C. Shao, Z. Zhang, M. Zhang, J. Mu, Z. Guo and Y. Liu, Nanoscale, 2011, 3, 2943 RSC.
- A. Biswas, A. Corani, A. Kathiravan, Y. Infahsaeng, A. Yartsev, V. Sundstrom and S. De, Nanotechnology, 2013, 24, 195601 CrossRef PubMed.
- T. Nonoyama, T. Kinoshita, M. Higuchi, K. Nagata, M. Tanaka, K. Sato and K. Kato, J. Am. Chem. Soc., 2012, 134, 8841 CrossRef CAS PubMed.
- J. Wang, D. N. Tafen, J. P. Lewis, Z. Hong, A. Manivannan, M. Zhi, M. Li and N. Wu, J. Am. Chem. Soc., 2009, 131, 12290 CrossRef CAS PubMed.
- J. Zhang, Q. Xu, Z. Feng, M. Li and C. Li, Angew. Chem., Int. Ed., 2008, 47, 1766 CrossRef CAS PubMed.
- T. Ohno, K. Tokieda, S. Higashida and M. Matsumura, Appl. Catal., A, 2003, 244, 383 CrossRef CAS.
- D. C. Hurum, A. G. Agrios and K. A. Gray, J. Phys. Chem. B, 2003, 107, 4545 CrossRef CAS.
- N. Wu, J. Wang, D. N. Tafen, H. Wang, J. G. Zheng, J. P. Lewis, X. Liu, S. S. Leonard and A. Manivannan, J. Am. Chem. Soc., 2010, 132, 6679 CrossRef CAS PubMed.
- B. Chen, J. Hou and K. Lu, Langmuir, 2013, 29, 5911 CrossRef CAS PubMed.
- I. Zumeta, D. Díaz and P. Santiage, J. Phys. Chem. C, 2010, 114, 11381 CAS.
- L. Sun, Z. Zhao, Y. Zhou and L. Liu, Nanoscale, 2012, 4, 613 RSC.
- D. Pan, N. Zhao, Q. Wang, S. Jiang, X. Ji and L. An, Adv. Mater., 2005, 17, 1991 CrossRef CAS PubMed.
- K. Ding, Z. Miao, Z. Liu, Z. Zhang, B. Han, G. An, S. Miao and Y. Xie, J. Am. Chem. Soc., 2007, 129, 6362 CrossRef CAS PubMed.
- L. W. Zhang, H. B. Fu and Y. F. Zhu, Adv. Funct. Mater., 2008, 18, 2180 CrossRef CAS PubMed.
- S. Sakthivel and H. Kisch, Angew. Chem., Int. Ed., 2003, 42, 4908 CrossRef CAS PubMed.
- M. Inagaki, F. Kojin, B. Tryba and M. Toyoda, Carbon, 2005, 43, 1652 CrossRef CAS PubMed.
- T. Tsumura, N. Kojitani, I. Izumi, N. Iwashite, M. Toyoda and M. Inagaki, J. Mater. Chem., 2002, 12, 1391 RSC.
- Y. J. Xu, Y. Zhuang and X. Fu, J. Phys. Chem. C, 2010, 114, 2669 CAS.
- Y. Yao, G. Li, S. Ciston, R. M. Lueptow and K. A. Gray, Environ. Sci. Technol., 2008, 42, 4952 CrossRef CAS.
- T. Liu and H. Zhang, RSC Adv., 2013, 3, 16255 RSC.
- J. Lim, P. Murugan, N. Lakshminarasimhan, J. Y. Kim, J. S. Lee, S. H. Lee and W. Choi, J. Catal., 2014, 310, 91 CrossRef CAS PubMed.
- B. Tian, C. Li and J. Zhang, Chem.–Eng. J., 2012, 191, 402 CrossRef CAS PubMed.
- S. Klosek and D. Raftery, J. Phys. Chem. B, 2001, 105, 2815 CrossRef CAS.
- S. In, A. Orlov, R. Berg, F. Garacía, S. Pedrosa-Jimenez, M. S. Tikhov, D. S. Wright and R. M. Lambert, J. Am. Chem. Soc., 2007, 129, 13790 CrossRef CAS PubMed.
- G. Liu, C. Han, M. Pelaez, D. Zhu, S. Liao, V. Likodimos, N. Ioannidis, A. G. Kontos, P. Falaras, P. S. M. Dunlop, J. A. Byrne and D. D. Dionysiou, Nanotechnology, 2012, 23, 294003 CrossRef PubMed.
- D. L. Shieh, Y. S. Lin, J. H. Yeh, S. C. Chen, B. C. Lin and J. L. Lin, Chem. Commun., 2012, 48, 2528 RSC.
- L. Zhao, X. Chen, X. Wang, Y. Zhang, W. Wei, Y. Sun, M. Antonietti and M. M. Titirici, Adv. Mater., 2010, 22, 3317 CrossRef CAS PubMed.
- P. D. Cozzoli, A. Kornowski and H. Weller, J. Am. Chem. Soc., 2003, 125, 14539 CrossRef CAS PubMed.
- Z. Zhang, X. Zhong, S. Liu, D. Li and M. Han, Angew. Chem., Int. Ed., 2005, 44, 3466 CrossRef CAS PubMed.
- J. Zhang, M. Li, Z. Feng, J. Chena and C. Li, J. Phys. Chem. B, 2006, 110, 927 CrossRef CAS PubMed.
- J. Zhang, Q. Xu, M. Li, Z. Feng and C. Li, J. Phys. Chem. C, 2009, 113, 1698 CAS.
- C. Kang, L. Jing, T. Guo, H. Cui, J. Zhou and H. Fu, J. Phys. Chem. C, 2009, 113, 1006 CAS.
- K. Ding, Z. Miao, B. Hu, G. An, Z. Sun, B. Han and Z. Liu, Langmuir, 2010, 26, 10294 CrossRef CAS PubMed.
- O. Akhavan and E. Ghaderi, J. Phys. Chem. C, 2009, 113, 20214 CAS.
- X. W. Lou and H. C. Zeng, J. Am. Chem. Soc., 2003, 125, 2697 CrossRef CAS PubMed.
- E. Papirer, R. Lacroix, J.-B. Donnet, G. Nansé and P. Fioux, Carbon, 1995, 33, 63 CrossRef CAS.
- W. J. Ren, Z. H. Ai, F. L. Jia, L. Z. Zhang, X. X. Fan and Z. G. Zou, Appl. Catal., B, 2007, 69, 138 CrossRef CAS PubMed.
- T. Xu, W. Hou, X. Shen, H. Wu, X. Li, J. Wang and Z. Jiang, J. Power Sources, 2011, 196, 4934 CrossRef CAS PubMed.
- A. Kudo and Y. Miseki, Chem. Soc. Rev., 2009, 38, 253 RSC.
- D. D. Zhang, R. L. Qiu, L. Song, B. Eric, Y. Q. Mo and X. F. Huang, J. Hazard. Mater., 2009, 163, 843 CrossRef CAS PubMed.
- Q. Sun and Y. M. Xu, J. Phys. Chem. C, 2009, 113, 12387 CAS.
- W. Wang, P. Serp, P. Kalck and J. L. Faria, J. Mol. Catal. A: Chem., 2005, 235, 194 CrossRef CAS PubMed.
- J. Zhong, F. Chen and J. L. Zhang, J. Phys. Chem. C, 2010, 114, 933 CAS.
- J. C. Barreto, G. S. Smith, N. H. P. Strobel, P. A. McQuillin and T. A. Miller, Life Sci., 1995, 56, 89 Search PubMed.
Footnote |
† Electronic supplementary information (ESI) available. See DOI: 10.1039/c4ra05556j |
|
This journal is © The Royal Society of Chemistry 2014 |
Click here to see how this site uses Cookies. View our privacy policy here.