High electrocatalytic performance of platinum and manganese dioxide nanoparticle decorated reduced graphene oxide sheets for methanol electro-oxidation

A. T. Ezhil Viliana, Muniyandi Rajkumarb, Shen-Ming Chen*a, Chi-Chang Hub, Karunakara Moorthy Boopathicd and Chih-Wei Chucd
aDepartment of Chemical Engineering and Biotechnology, National Taipei University of Technology, No. 1, Section 3, Chung-Hsiao East Road, Taipei 106, Taiwan, Republic of China. E-mail: smchen78@ms15.hinet.net; Fax: +886 2270 25238; Tel: +886 2270 17147
bLaboratory of Electrochemistry & Advanced Materials, Department of Chemical Engineering, National Tsing Hua University, Hsinchu 30013, Taiwan, Republic of China
cNanoscience and Technology Program, Taiwan International Graduate Program, Academia Sinica, Taipei 115, Taiwan, Republic of China
dResearch Center for Applied Science, Academia Sinica, Taipei115, Taiwan, Republic of China

Received 9th June 2014 , Accepted 20th August 2014

First published on 20th August 2014


Abstract

In this study we report the synthesis of a novel Pt–MnO2–ERGO electrocatalyst by the deposition of MnO2 and Pt nanoparticles decorated on reduced graphene oxide sheets using a simple electrochemical method. The as prepared MnO2 and Pt nanoparticles decorated on the reduced graphene oxide sheets (Pt–MnO2–ERGO electrocatalysts) were characterized by scanning electron microscopy (SEM), transmission electron microscopy (TEM), X-ray diffraction (XRD), energy-dispersive X-ray spectroscopy (EDX) and X-ray photoelectron spectroscopy (XPS). The cyclic voltammetric (CV), chronoamperometric and electrochemical impedance spectroscopic (EIS) measurements show high electrocatalytic activity and stability of the electrodes towards the methanol oxidation reaction in nitrogen saturated sulfuric acid aqueous solutions and in mixed sulfuric acid and methanol aqueous solutions. The voltammetric results show the electrocatalytic characteristics of the Pt–MnO2–ERGO electrocatalysts, which exhibit superior electrocatalytic activity (including good poison tolerance, and low onset potential) and stability toward electro-oxidation of methanol in a model reaction. The electrochemical impedance spectroscopic result shows good electrocatalytic activity in relation to methanol oxidation and improved tolerance of CO. In addition, the as designed Pt–MnO2–ERGO nanocomposite modified electrode with a novel structure can be directly employed for fuel cells.

Introduction

Over the past few decades, direct methanol fuel cells (DMFCs) have generated tremendous interest as green power sources for portable electronics owing to their advantages of high-energy conversion efficiency, system simplicity, environmental friendliness, low operating temperature and the storage convenience of liquid fuel cells.1–3 However, the successful commercial application of DMFCs is still hindered by several technological challenges, including the high cost and insufficient durability of the widely used metal-based catalysts,4,5 critical problems with the Pt catalysts, and poor kinetics due to catalyst poisoning by the carbon intermediate species produced during the oxidation of methanol. The unstable catalytic activity, poor durability, and high cost have limited the commercial prospects of DMFCs.6,7 A great deal of effort has been devoted to reducing the use of Pt and enhancing the catalytic efficiency of Pt for methanol oxidation in fuel cells and practicality in industrial applications.8

In recent years, many bi- or trimetallic Pt-based catalysts such as Pt–Ru, Pt–Co–Ru, and Pt–Co–Sn have been developed.9–12 On the other hand, graphene, a two-dimensional (2D) carbon material with a single-atom thick sheet of hexagonally arrayed sp2-bonded carbon atoms has attracted a great deal of attention from both the scientific and industrial communities.13–15 It is emerging as one of the most appealing catalytic support materials due to its unique structure and excellent properties such as superior electrical conductivity, excellent mechanical flexibility, high thermal and chemical stability, and extremely large surface area.16,17 Graphene is being integrated with other materials in order to harness its favorable properties for practical applications including in metals, semiconductors, ceramics, polymers and other carbon materials.18 Graphene oxide (GO) is a derivative of graphene, which has many oxygen-containing functional groups on its surface (hydroxyl, epoxide, carbonyl and carboxyl groups) which provide sites for the anchoring and dispersion of metal nanoparticles.19 It has been found that graphene-supported Pt-based catalysts exhibit improved performance and create less poisoning by CO-like intermediates during methanol oxidation than catalysts supported on carbon.20 Several forms of carbon materials have been considered in robust strategies for the creation of DMFCs, such as hollow carbon hemispheres,21 carbon nanotubes (CNTs),22 carbon nanofibers,23 carbon nanorods,24 carbon nanospheres,25 graphene,26 and so on. Among the carbon materials, graphene is regarded as a suitable supporting material for the loading of Pt nanoparticles in fuel cells, due to the large specific surface area, excellent electronic conductivity, thermal stability and durability.27

To the best of our knowledge, there has been no study on the effects of MnO2 and Pt nanoparticles decorated on reduced graphene oxide sheets (Pt–MnO2–ERGO) and its electrocatalytic applications towards methanol oxidation. The experimental conditions related to the preparation of the Pt–MnO2–ERGO electro catalyst nanoparticles are discussed and the samples were characterized using X-ray diffraction (XRD), energy-dispersive X-ray spectroscopy (EDX), scanning electron microscopy (SEM), Transmission electron microscopy (TEM) and X-ray photoelectron spectroscopy (XPS) analysis. The catalytic activity of the as prepared MnO2 and Pt nanoparticles decorated on the reduced graphene oxide sheets for methanol oxidation were studied using cyclic voltammetry (CV), chronoamperometric measurements and electrochemical impedance spectroscopy (EIS) techniques. The Pt–MnO2–ERGO nanocomposite electrode demonstrate good electrocatalytic activity towards methanol oxidation, improved tolerance of CO and also could be directly employed for fuel cell applications.

Experimental section

Chemicals

Graphite (powder, <20 μm), H2PtCl6·6H2O, KMnO4, H2SO4, methanol and commercial Pt–C were purchased from Sigma-Aldrich and used without further purification. Double distilled water (with a resistivity of 18.25 MΩ cm) was employed throughout the experiments. All other analytical grade reagents were used without further purification.

Apparatus

The CV measurement was carried out at a CH Instrument 405A electrochemical workstation (Shanghai Chenhua Co., China). A three-electrode system was employed, including a working ERGO–MnO2–Pt modified GCE electrode, a saturated Ag/AgCl/KCls reference electrode and a platinum wire counter electrode. SEM images were measured with a Hitachi S-3000 H and EDX images were recorded using a HORIBA EMAX X-ACT Model 51-ADD0009. Transmission electron microscopy (TEM) images were collected by using a Philips TECNAI 20 microscope (200 kV). EIS was carried out at a frequency range of 0.1 Hz to 100 kHz with a ZAHNER instrument (Kroanch, Germany). XPS analysis was carried out using a PHI 5000 Versa Probe equipped with an Al Kα X-ray source (1486.6 eV). Raman spectra were measured with a Raman spectrometer (Dong Woo 500i, Korea) equipped with a charge-coupled detector. XRD analysis was carried out using an XPERT-PRO diffractometer (PANalytical B.V., the Netherlands) using Cu Kα radiation (k = 1.54 Å). The current and power were measured using precision multimeter (Keithley instruments; model 2400) in a room atmosphere.

Synthesis of graphene oxide

The GO used in the experiments was synthesized from natural flake graphite powder by a modified Hummers method.28 Briefly, graphite powder (5.0 g) was put into 0 °C concentrated H2SO4 (150 mL) and then 25 g of KMnO4 was slowly added under ice cooling. The mixture was stirred continuously for 30 min. After the addition of 600 mL of deionized water while the temperature was kept under 50 °C, 250 mL of water and 6 mL of H2O2 (30 weight%) were subsequently added to reduce the residual KMnO4. The reaction was allowed to continue for 30 min, yielding a brilliant yellow solution. Finally, the solid suspension was first washed using 2 M of HCl solution and then washed 3–4 times with ethanol and dried overnight in a vacuum at 60 °C. The graphite oxide slurry was then dried in a vacuum oven at 60 °C for 48 h before use. Afterwards, the sample was prepared by dispersing 0.5 mg mL−1 of GO in deionized water with the aid of ultra-sonication for 30 minutes.

Preparation of the ERGO–MnO2–Pt modified electrodes

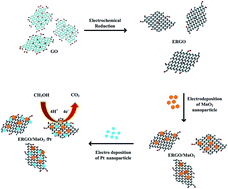
The glassy carbon electrode (GCE) with a diameter of 3 mm was polished with an alumina (particle size of about 0.05 mm)/water slurry using a Buehler polishing kit. It was then washed with deionized water and ultrasonicated for 3 min each in water and ethanol to remove any adsorbed alumina particles or dirt from the electrode surface and finally dried. The typical procedure for constructing the ERGO–MnO2–Pt modified electrode was schematically shown in Scheme 1. A 5 μL of GO dispersion was drop casted on the pre-cleaned GCE and dried in air oven at 30 °C. The modified GCE was then rinsed with water to remove loosely adsorbed GO. Higher amounts of GO could agglomerate on the electrode surface, affecting the catalytic activity and stability. Therefore, an optimal concentration of 0.5 mg mL−1 was used. The GO film modified GCE was gently washed with water and transferred to an electrochemical cell containing 0.05 M PBS (pH 5) after which 30 successive cycles of electrochemical reduction were performed in the potential range between 0 and −1.5 V at a scan rate of 0.05 V s−1 (see Fig. S1). The first large cathodic peak appeared at −1.1 V, corresponding to the electrochemical reduction of oxygen functionalities of GO. The epoxy and hydroxyl groups on the basal plane were mostly decorated with GO sheets, while carbonyl and carboxyl groups were located at the edges.29 Then, the electrochemically reduced graphene oxide (ERGO) modified GCE was dried under an infrared lamp for few minutes. Electro deposition of MnO2 was performed on the as-ERGO modified GCE electrode using scanning between the potentials 0.5 V and −0.3 V at a rate of 0.02 V s−1 in a N2-saturated a solution containing 10 mm KMnO4 + 0.04 M H2SO4 for 6 cycles.30 Later, electrochemical deposition of Pt nanoparticles on the MnO2–ERGO modified electrode surface was carried out by immersing in an aqueous solution containing 1 mM K2PtCl6 in 0.5 M H2SO4 for 10 cycles in the potential range of −0.25 to 1.0 V (see Fig. S2). The as prepared catalyst can posses a better electrocatalytic performance under the above-mentioned conditions. Each single fuel cell set up consists of an anode and cathode compartments. The as prepared nanocomposite electrode posses higher open circuit voltage and power density at 1 M methanol solution. On the other hand, The stability of the modified Pt–MnO2–ERGO electrode was assessed by immersing it in a nitrogen-saturated 0.1 M H2SO4 solution using a scan rate of 50 mV s−1. The electrocatalytic activity of the methanol oxidation reaction was measured by immersion in a nitrogen-saturated 0.1 M H2SO4 + 1 M CH3OH solution at a scan rate of 50 mV s−1 until repeatable cyclic voltammograms were attained. Furthermore, all experiments were carried out at ambient temperature.
image file: c4ra05507a-s1.tif
Scheme 1 Schematic representation of fabrication of Pt–MnO2–ERGO nanocomposite modified electrode.

Results and discussion

Surface characterization of the Pt–MnO2–ERGO

Fig. 1A shows the XPS spectra for Pt–MnO2–ERGO, in which elements of Pt, C, Mn, and O are detected in the Pt–MnO2–ERGO electro catalyst and normalized to produce the graphite carbon peak at 284.6 eV. The C 1s XPS spectra of GO show binding energies at 284.6 (C[double bond, length as m-dash]C), 285.48 (C–OH), 286.68 (C–O–C), 287.39 (C[double bond, length as m-dash]O), and 288.55 eV (O[double bond, length as m-dash]C–O). These values are in agreement with those obtained in previous studies.31 Further evidence for the formation of MnO2 can be seen in the XPS spectrum of Mn for the MnO2–ERGO sample, where Mn 2p3/2 and Mn 2p1/2 peaks are observed at 642.2 eV and 654.0 eV, respectively, as presented Fig. 1C. In addition, as can be observed in Fig. 1D, there are two peaks in the Pt 4f binding energy region of Pt–MnO2–ERGO at 70.6 eV and 73.9 eV, which are attributed to 4f7/2, and 4f5/2 of metallic Pt, respectively. To evaluate the surface oxidation states of Pt, the Pt 4f spectra were deconvoluted into three doublets, which are assigned to the different oxidation states of Pt. The most intense doublet (around 71 eV and 74 eV) is assigned to metallic Pt.32 Thus, it can be concluded that Pt–MnO2–ERGO are present in the prepared nano electro catalyst.
image file: c4ra05507a-f1.tif
Fig. 1 (A) XPS spectra of Pt–MnO2–ERGO electrocatalysts (B) high-resolution XPS spectra of C 1s, (C) the Mn 2p, and (D) Pt 4f core-level spectra of the as fabricated Pt–MnO2–ERGO electrocatalysts.

Fig. 2A shows the results of Raman spectroscopy, another powerful method widely used in studies of GO and ERGO. The results reveal two prominent peaks at the typical D band (1330 cm−1) and G band (1588 cm−1) for GO, which correspond to the presence of sp3 defects and tangential vibrations of sp2 carbon atoms in the hexagonal plane, respectively. While the intensity ratio of the D and G bands (ID/IG) of GO is about 0.98, the ID/IG of ERGO has increased to 1.31 due to a decrease in the average size of the sp2 carbon network upon the electrochemical reduction of the exfoliated GO. This is in agreement with that of XRD results above.


image file: c4ra05507a-f2.tif
Fig. 2 Raman spectra of GO, ERGO. (B) XRD patterns of (a) ERGO, (b) MnO2–ERGO, (c) ERGO–Pt, (d) Pt–MnO2–ERGO electro catalysts. (C) SEM images of ERGO and TEM images of Pt–MnO2–ERGO electro catalysts.

Fig. 2B shows the XRD patterns of Pt–MnO2–ERGO. The diffraction peaks at 2θ angles of 24.28° and 24.35° in the XRD pattern of graphite can be assigned to the (002) facets of the hexagonal crystalline graphite, respectively, and indicate that the GO has been reduced to ERGO. Furthermore, the diffraction peaks at around 26.6°, 33.8°, 51.9°, and 61.8° are due to diffraction at the (100), (101), (102), and (110) planes of MnO2, (JCPDS card no. 44-0141) respectively, and confirm that the as-prepared MnO2 nanoparticles are well-crystallized.33 The strong diffraction peaks at 2θ = 39.81°, 46.09°, 67.79° and 81.33° observed on the Pt–MnO2–ERGO are assigned to the characteristic (111), (200), and (220) crystalline planes of Pt, respectively.

Morphological studies

The morphology and the size of the ERGO, MnO2–Pt, MnO2–ERGO and Pt–MnO2–ERGO on the ITO electrodes were examined by SEM, TEM and EDX analysis. As can be seen from Fig. 2C ERGO flakes with broad lamellar structures or folds, which provide the large surface-area with thickness 3–4 nm are formed. Fig. 3A shows the morphologies of the MnO2 and Pt nanoparticles, which are highly agglomerated on the ITO surface, so the morphologies between them cant able to distinguish separately in the figure. In order to confirm the presence of these materials we do EDX spectrum. Fig. 3D shows the EDX spectrum shows peaks corresponding to Mn (40%), O (50%) and Pt (10%), confirming the existence of MnO2 between the Pt nanoparticles. The wrinkles on the moderately reduced ERGO sheets on the ITO help to maintain the high surface area important for preventing aggregation of the ERGO. Furthermore, The MnO2 anchored on the moderately reduced ERGO–ITO surface. This can be attributed to the oxygen functionalities and negative charges at the ERGO surface, which favor the adsorption of MnO2. Further removal of these oxygen-containing groups from the ERGO surface leads to a remarkable increase in MnO2 particle size due to aggregation, indicating that the oxygen-containing groups on ERGO surfaces do play an important role in enhancing the loading of MnO2 as can be seen in Fig. 3B. Further confirmation of the existence of ERGO–MnO2 is found in the EDX spectra, which show peaks corresponding to Mn (20%), O (65%), and C (15%), as shown in Fig. 3E. Furthermore, the SEM micrographs show uniformly distributed platinum nanoparticles that have directly grown on the moderately reduced external ERGO surface (see Fig. 3C) due to the existence of an electronic interaction between the negatively charged [PtCl6]4− and oxygen functionalities at the ERGO and MnO2 surface. This provides a larger active surface area. In addition, the morphologies of the Pt–MnO2–ERGO nanocomposite are illustrated. These improve the electrocatalytic activity as well. The corresponding EDX spectra for Pt–MnO2–ERGO nanocomposite appearing in Fig. 3F show peaks corresponding to the elements of C (10%), O (45), and Mn (35%), Pt (10%), confirming the existence of metallic Pt nanoparticles on the surface of the MnO2–ERGO nanosheets, which is very conducive to the electro-oxidation of methanol. In addition Fig. 2D shows HRTEM images of the Pt–MnO2–ERGO, respectively. The image reveals MnO2 nanostructure coated on the ERGO sheet surface. Which will direct the carbon–MnO4 reactions occur preferentially at the defective sites in the ERGO, and therefore a significant amount of framework defects are consumed in the first step. The residual carbon–oxygen functional groups on the MnO2–ERGO sheets play an important role in distributing the Pt nanoparticles. Moreover, the presence of hydrous MnO2 can create large hydrophilic regions on the surface of ERGO, which can facilitate the diffusion of Pt2+ ions and effectively prevent agglomeration of the metal nanoparticles.
image file: c4ra05507a-f3.tif
Fig. 3 SEM images of (A) Pt–MnO2, (B) MnO2–ERGO, (C) Pt–MnO2–ERGO, and EDX spectra of (D) Pt–MnO2, (E) MnO2–ERGO (F) Pt–MnO2–ERGO electro catalysts.

Electrochemical investigation of Pt–MnO2–ERGO modified GCE

EIS is an exact method to elucidate the electrochemical properties of the proposed film. The EIS analysis has been studied by analyzing the Nyquist plots of the corresponding films. Here the respective semicircle parameters correspond to the electron transfer resistance (Ret), solution resistance (Rs) and double layer capacity (Cdl) of the films. The plot of the real component (Z′) and the imaginary component −Z′′(imaginary) resulted in the formation of a semi-circular Nyquist plot. From the shape of an impedance spectrum, the electron-transfer kinetics and diffusion characteristics can be extracted. The respective semicircle parameters correspond to the electron transfer resistance (Ret) and the double layer capacity (Cdl) nature of the modified electrode. Fig. 4A displays the Nyquist plot for the comparison of different modified electrodes (a) Pt–C, (b) Pt–MnO2, (c) Pt–ERGO and (d) Pt–MnO2–ERGO modified electrodes in a nitrogen saturated solution of 0.1 M H2SO4 containing 1 M CH3OH. Fig. 4A inset shows the randles equivalent circuit model for the proposed film. On comparison with different modified electrodes, the Pt–MnO2–ERGO exhibits a smaller semicircle when compare with Pt–ERGO, Pt–MnO2, and Pt–C electrocatalysts in the 0.1 M H2SO4 + 1 M CH3OH electrolyte solution. From these results, we can clearly indicate that the loading of Pt nanoparticles on the MnO2–ERGO modified GCEs can facilitate electron transfer reaction at the electrode interface, which implies the Pt–MnO2–ERGO modified GCE may act as an excellent electro catalyst for methanol oxidation reaction on its surface. Therefore, the composite film could be efficiently used for the electrocatalytic reactions. A simplified randles circuit model (Fig. 4A, inset) has been used to fit the impedance spectra. The randles circuit model well suites with the impedance spectroscopic results and the fit model error for the film was found as 6.3%. Finally the electrochemical impedance spectroscopic analysis clearly illustrates that the electrochemical behavior of the proposed Pt–MnO2–ERGO composite film is excellent.
image file: c4ra05507a-f4.tif
Fig. 4 (A) Nyquist plots of the EIS for the (a) Pt–C, (b) Pt–MnO2, (c) Pt–ERGO and (D) Pt–MnO2–ERGO modified electrodes in a nitrogen saturated solution of 0.1 M H2SO4 containing 1 M CH3OH in a frequency range from 0.1 Hz to 100 kHz. The inset shows the randles equivalent circuit for the modified electrodes. (B) Cyclic voltammograms obtained for the (a) Pt–C, (b) Pt–MnO2, (c) Pt–ERGO and (D) Pt–MnO2–ERGO modified electrodes in a nitrogen saturated solution of 0.1 M H2SO4 at a scan rate of 50 mV s−1.

Fig. 4B shows the CVs for the Pt–MnO2–ERGO modified GCE electrodes and Pt–ERGO, Pt–MnO2 and Pt–C electro catalysts in 0.1 M H2SO4 at a sweep rate of 50 mV s−1. The electrochemically active surface area (ESA) of the electro catalysts can be calculated from the hydrogen adsorption and desorption area by34

 
ECSA = QH/(0.21 × WPt), (1)
where QH (C) represents the average charge for hydrogen adsorption and desorption; WPt is the loading of Pt electro-deposited on the electrode; and 0.21 (mC cm−2) represents the transferred coefficient for a monolayer of H adsorbed on the Pt surface. The ECSA is essential for comparing electrocatalytic activity and it provides information regarding the number of available electrochemically active sites. The hydrogen desorption peak area is commonly used to determine ECSA in the potential region of −0.2 V to 1.2 V (vs. Ag/AgCl). A strong desorption peak in the corresponding potential range on the Pt–MnO2–ERGO electro catalyst is observed during the positive-going potential scan. The calculated results show that the Pt–MnO2–ERGO electro catalyst exhibits a higher ECSA value (62.8 m2 g−1) > Pt–ERGO with an ECSA of 42.4 m2 g−1 > Pt–MnO2 with an ECSA of 38.9 m2 g−1 > Pt–carbon blacks with an ECSA of 32.5 m2 g−1; see Table 1, suggesting better performance for methanol oxidation. This outstanding performance of Pt–MnO2–ERGO can explain the higher electrocatalytic activity. This result can be attributed to more effective utilization of the smaller size of the Pt nanoparticles and more uniform deposition of Pt NPs loaded on the MnO2–ERGO sheets.

Table 1 Electrochemical parameters of as-prepared different electro catalystsa
Electrocatalysts Onset potential/V ECSA/m2 g−1 If/Ir ratio Ref.
a If and Ir represent the forward and backward anodic peak current density.
Pt–tungsten carbide–ERGO 0.25 253.12 1.26 36
Core–shell-like PbPt/graphene 0.29 49.7 1.16 37
Pt–Ru–ERGO–CCE 10.28 1.30 38
Pt–graphene and β-cyclodextrin (NaBH4) 0.35 36.20 1.32 39
Pt–Ni–graphene 0.12 98 1.33 40
Pt–ERGO–amine functionalized Fe3O4 magnetic nanospheres 59.29 0.95 41
Pt–7% CeO2–graphene 0.659 66.4 1.48 42
Pt–MnO2–ERGO 0.36 62.8 1.98 This work


Effect of scan rate and electrochemical oxidation of methanol on the Pt–MnO2–ERGO electrodes

Further investigation is carried out to explore the electrochemical characterization of the Pt–MnO2–ERGO modified GCE electrode; by measuring the CV response in the N2 saturated 0.1 M H2SO4 + 1 M methanol solution, as shown in Fig. 5A. It can be seen that the peak currents of methanol oxidation increased with the increase in the scan rate. Fig. 5A displays the methanol oxidation at the Pt–MnO2–ERGO modified GCE electrode. There is a linear relationship between the peak current density (Ip) obtained from the forward CV scans and square root of the scan rate (ν1/2) (see Fig. 5B). In addition, the Ep moves slightly to higher potentials with an increasing scan rate. This indicates that the process of methanol diffusion controls the oxidation of methanol at the Pt–MnO2–ERGO modified GCE electrode.
image file: c4ra05507a-f5.tif
Fig. 5 (A) CVs for the Pt–MnO2–ERGO modified electrodes in a nitrogen saturated solution of 0.1 M H2SO4 containing 1 M CH3OH at different scan rates, from a to g, the scan rates were 10 to 50 mV s−1. (B) The relationship between the peak currents and the square root of the scan rates. (C) Cyclic voltammograms of (a) Pt–C, (b) Pt–MnO2, (c) Pt–ERGO and (D) Pt–MnO2–ERGO modified electrodes in a nitrogen saturated solution of 0.1 M H2SO4 containing 1 M CH3OH at a scan rate of 50 mV s−1.

The catalytic activity of the Pt–MnO2–ERGO modified GCE electrode and Pt–ERGO, Pt–MnO2, and Pt–C electro catalysts was characterized by CV in a 0.1 M H2SO4 + 1 M CH3OH aqueous solution at a potential scan rate of 50 mV s−1; the corresponding results are shown in Fig. 5C. All results for the Pt–MnO2–ERGO modified GCE electrodes and the Pt–ERGO, Pt–MnO2, and Pt–C electro catalysts show the characteristic peaks for pure Pt in the forward peak and backward peak scans. The onset potential for methanol oxidation occurs at 0.36 V, which is less than that of the Pt–ERGO (0.40 V), Pt–MnO2 (0.42 V) or Pt–C (0.45 V) electro catalysts, indicating that methanol oxidation is easier on the Pt–MnO2–ERGO. In addition, the ratio of the forward oxidation peak current (If) to the reverse anodic peak current (Ib) is an important index that can be used to gauge the tolerance of catalysts to the accumulation of carbonaceous species. Therefore, the higher If/Ib ratio for the methanol oxidation suggests more effective removal of the poisoning species on the catalyst surface, which implies that the methanol can be oxidized much more efficiently. Furthermore, the ERGO affects the catalytic activity of the Pt–MnO2 electro catalysts (see Fig. 5C). the more negative onset potential for methanol oxidation on the Pt–MnO2–ERGO electro catalysts is indicative of superior catalytic activity toward methanol oxidation than is the case with the Pt–ERGO (If/Ib value is approximately 1.12), Pt–MnO2 (If/Ib value is approximately 1.32), or Pt–C (If/Ib value is approximately 99) electro catalysts. As can be seen in Fig. 5C, the If/Ib value is approximately 1.98 for the Pt–MnO2–ERGO electro catalysts, which is higher than for the Pt–ERGO, Pt–MnO2, and Pt–C electro catalysts. The significantly higher If/Ib value for the Pt–MnO2–ERGO electro catalysts than that of Pt–ERGO indicates that the presence of MnO2 improves the electrocatalytic activity of the Pt–ERGO for methanol oxidation. A comparison of the proposed method to the reported ones, presented in Table 1, indicates that the proposed method is superior to the previous ones with regard to superior catalytic activity toward methanol oxidation. This suggests that here is less accumulation of carbonaceous species on the Pt–MnO2–ERGO electro catalysts. This result indicates that the moderately reduced ERGO supported electro catalysts possess better poison tolerance. This can be ascribed to the presence of residual oxygen-containing groups on the moderately reduced ERGO, which act as binding sites for Pt–MnO2. The oxygen-containing groups (such as OH) might also promote the oxidation of CO adsorbed by the active Pt sites and benefit the regeneration of Pt. The ERGO sheets are negatively charged and contain –COOH and –OH functional groups on the surface and at the edge of the carbon sheets. The negatively charged ERGO sheets can bond strongly with the Mn2+ through electrostatic attraction. This indicates the suitability of the modified electrode for electronic analysis. The adsorption of OHad species onto the MnO2 is more favorable. The catalytic effect of MnO2 towards the oxidation of methanol oxidation is probably due to a parallel catalytic reaction. In the presence of methanol, MnO2 acts as both the catalyst support and a catalyst for methanol oxidation. As soon as the MnO2 is reduced by methanol to the lower valence state of MnOOH, it is electro oxidized back to MnO2 on the electrode surface. The reactions are described in the following equations:35

 
CH3OH + Pt → Pt–COads + 4H+ + 4e (2)
 
H2O + MnO2 → MnO2–OHads + H+ + e (3)
 
Pt–COads + MnO2–OHads → Pt + MnO2 + CO2 + H+ + e (4)

On the other hand, The Pt–MnO2–ERGO electrocatalysts can facilitate electron transport and accelerate the mass transfer kinetics at the electrode surface and thus promote higher catalytic activity.

Current transients

The catalytic activity and stability of the Pt–MnO2–ERGO modified GCE electrodes and Pt–ERGO, Pt–MnO2, and Pt–C electro catalysts for methanol oxidation were further investigated through chronoamperometry in a 0.1 M H2SO4 + 1 M CH3OH aqueous solution under a constant potential of 0.65 V for 3000 s. As shown in Fig. 6A, the currents decreased quickly at the beginning. Tenacious reaction intermediates such as COads will begin to accumulate if the kinetics of the removal reaction cannot keep pace with that of methanol oxidation, possibly owing to the continuous oxidation of methanol on the surface. The electro catalyst has good anti-poisoning ability due to a more gradual decay of current density with time. In Fig. 6A, it can be seen that the current density for methanol oxidation on the Pt–MnO2–ERGO modified GCE electrode and the Pt–ERGO, Pt–MnO2, and Pt–C electro catalyst electrode decreases slowly throughout the process, whereas the corresponding decay on the Pt–MnO2 and Pt–C electro catalyst electrodes is very fast. The Pt–MnO2–ERGO modified GCE electrode shows improved anti-poison ability and the Pt–ERGO, Pt–MnO2 and Pt–C electro catalysts show excellent current stability over 3000 s duration. However, as can be observed in Fig. 6A, the current densities at 1500 s are 2.19 mA cm−2 for Pt–MnO2–ERGO, 1.76 mA cm−2 for Pt–ERGO, 1.24 mA cm−2 for Pt–MnO2 and 0.65 mA cm−2 for Pt–C. respectively. The highest oxidation current density can be found for the Pt–MnO2–ERGO modified electro catalyst and the steady-state current density among the Pt–ERGO, Pt–MnO2 and Pt–C electro catalysts throughout all ranges up to 3000 s, this result further proves the Pt–MnO2–ERGO electro catalyst has better electrocatalytic activity than the latter for methanol electro-oxidation.
image file: c4ra05507a-f6.tif
Fig. 6 (A) Chronoamperometric curves showing methanol oxidation on the (a) Pt–C, (b) Pt–MnO2, (c) Pt–ERGO and (D) Pt–MnO2–ERGO modified electrodes at 0.65 V in a 0.1 M H2SO4 + 1 M CH3OH solution. (B) Cyclic voltammograms of Pt–MnO2–ERGO modified electrodes with 200 cycle in a nitrogen saturated solution of 0.1 M H2SO4 containing 1 M CH3OH at a scan rate of 50 mV s−1.

Stability studies

The long-term cycle stabilities of the Pt–MnO2–ERGO modified electro catalysts CH3OH + 0.1 M H2SO4 were also tested by cycling the electrode potential between 0 and 0.8 V at 50 mV s−1 for 200 cycles. The representative CVs and estimated peak current densities as obtained in forward scans (ia) with increasing cycle numbers are shown in Fig. 6B. We can observe that the Pt–MnO2–ERGO modified electro catalysts have higher activity for methanol oxidation. The peak current for methanol oxidation in the first scan for the Pt–MnO2–ERGO modified electro catalysts reaches a peak value of 9.11 mA cm−2 (ia). After 200 CV test cycles, the current density of the Pt–MnO2–ERGO modified electro catalyst remains at 72.5% of the first scan. The decrease in the electrocatalytic peak currents is mainly due to the agglomeration of Pt particles in the reaction process, which leads to a decrease of the reaction activity. Some of the Pt particles might fall on reduced graphene oxide carriers, which would lead to an accumulation of carbonaceous residues on the electro catalyst surface. The observations imply that the Pt–MnO2–ERGO modified electro catalysts possesses significantly enhanced long-term cycle stability for methanol oxidation.

A simple methanol fuel cell has been composed by assembling Pt–MnO2–ERGO modified GCE as anode and commercially available Pt–C as a cathode with Nafion 112 as the membrane in our homemade fuel cell setup in our laboratory. The performance of the direct methanol fuel cell was carried out in the presence of 0.1 M H2SO4 + 1 M CH3OH aqueous solutions at 30 °C. The results shows that the as prepared Pt–MnO2–ERGO composite modified electro catalysts provides better power performance, by as much as 148 mW cm−2 compared with the commercial Pt–C value of 92 mW cm−2 (see Fig. S3). The improved power performance of the as prepared nanocomposite is attributed to the high oxygen reduction activity and the enhanced tolerance towards the oxidation of methanol, which transferred from the anode to the cathode through the Nafion membrane. Moreover, the open-circuit voltage for Pt–MnO2–ERGO modified electro catalysts is higher than that of Pt–C. The open circuit voltage (VOC) of the methanol fuel cell is approximately 0.55 V, and a maximum power density of 148 mW cm−2 has been achieved. Further research is underway to improve the power density of the assembled direct methanol cell. From these results it is clearly evident that the Pt–MnO2–ERGO modified electro catalysts and Pt–C composite can be a versatile platform for the development of direct methanol fuel cells.

Conclusion

In summary, we have reported on a way to synthesize reduced graphene oxide (ERGO) supported Pt–MnO2 electro catalysts using a simple electro deposition technique, a layer-by-layer method. CV and chronoamperometric were used to measure the electrocatalytic activity. Results showed that the Pt–MnO2–ERGO modified electro catalyst presented greatly enhanced catalytic activity and long-term stability toward methanol electro-oxidation. Its specific activity could reach 1.98 mA and cm−2, respectively, which is significantly higher than that of the Pt–ERGO or Pt–MnO2 electro catalysts or the commercially available Pt black. The electrochemical catalytic activity of these Pt–MnO2–ERGO modified electro catalysts towards methanol oxidation was also evaluated in comparison with the activity of Pt–ERGO, Pt–MnO2 electro catalysts and commercial Pt black. The Pt–MnO2–ERGO modified electro catalysts demonstrated superior electrocatalytic activity. Moreover, SEM and EDX results confirmed the transparent structure of the Pt–MnO2–ERGO modified electro catalysts. The electrochemical synthesis of Pt–MnO2–ERGO modified electro catalysts could be a promising system for methanol oxidation.

Acknowledgements

We wish to express our appreciation to the Ministry of Science and Technology, Taiwan (ROC) for support of this work.

References

  1. D. Guo, P. Cai and J. You, Colloids Surf., A, 2012, 368, 443–446 CAS.
  2. L. Claude, L. Alexandre, L. Veronique, D. Fabien, C. Christophe and J. Leger, J. Power Sources, 2002, 105, 283–296 CrossRef.
  3. Y. Qiao and C. Li, J. Mater. Chem., 2011, 21, 4027–4036 RSC.
  4. Y. Feng, G. Zhang, J. Ma, G. Liu and B. Xu, Phys. Chem. Chem. Phys., 2011, 13, 3863–3872 RSC.
  5. C. Rao and B. Viswanathan, J. Phys. Chem. C, 2009, 113, 18907–18913 Search PubMed.
  6. A. Halder, S. Sharma, M. Hegde and N. Ravishankar, J. Phys. Chem. C, 2009, 113, 1466–1473 CAS.
  7. S. Guo, S. Dong and E. Wang, Adv. Mater., 2010, 22, 1269–1272 CrossRef CAS PubMed.
  8. Z. Li, S. Lin, Z. Chen, Y. Shi and X. Huang, Colloids Surf., A, 2012, 368, 413–419 CAS.
  9. B. Luo, S. Xu, X. Yan and Q. Xue, J. Power Sources, 2012, 205, 239–243 CrossRef CAS PubMed.
  10. H. B. Zhao, L. Li, J. Yang and Y. M. Zhang, Electrochem. Commun., 2008, 10, 1527–1529 CrossRef CAS PubMed.
  11. D. M. Han, Z. P. Guo, R. Zeng, C. J. Kim, Y. Z. Meng and H. K. Liu, Int. J. Hydrogen Energy, 2009, 34, 2426–2434 CrossRef CAS PubMed.
  12. L. Gan, L. Ruitao, H. D. Du, B. H. Li and F. Y. Kang, Electrochem. Commun., 2009, 11, 355–358 CrossRef CAS PubMed.
  13. K. S. Novoselov, A. K. Geim, S. V. Morozov, D. Jiang, M. I. Katsnelson, I. V. Grigorieva, S. V. Dubonos and A. A. Firsov, Nature, 2005, 438, 197–200 CrossRef CAS PubMed.
  14. K. S. Novoselov, A. K. Geim, S. V. Morozov, D. Jiang, Y. Zhang, S. V. Dubonos, I. V. Grigorieva and A. A. Firsov, Science, 2004, 306, 666–669 CrossRef CAS PubMed.
  15. C. Berger, Z. Song, X. Li, X. Wu, N. Brown, C. Naud, D. Mayou, T. Li, J. Hass, A. N. Marchenkov, E. H. Conrad, P. N. First and W. A. de Heer, Science, 2006, 312, 1191–1196 CrossRef CAS PubMed.
  16. A. K. Geim and K. S. Novoselov, Nat. Mater., 2007, 6, 183–191 Search PubMed.
  17. C. N. R. Rao, A. K. Sood, K. S. Subrahmanyam and A. Govindaraj, Angew. Chem., Int. Ed., 2009, 48, 7752–7777 CrossRef CAS PubMed.
  18. J. Yang, X. Shen, G. Zhu, Z. Jib and H. Zhou, RSC Adv., 2014, 4, 386–394 RSC.
  19. C. Xu, X. Wang and J. W. Zhu, J. Phys. Chem. C, 2008, 112, 19841–19845 CAS.
  20. L. F. Dong, R. Gari, Z. Li, M. M. Craig and S. F. Hou, Carbon, 2010, 48, 781–787 CrossRef CAS PubMed.
  21. Z. X. Yan, Z. F. Hu, C. Chen, H. Meng, P. K. Shen and H. B. Ji, J. Power Sources, 2010, 195, 7146–7151 CrossRef CAS PubMed.
  22. M. M. Zhang, Z. X. Yan and J. M. Xie, Electrochim. Acta, 2012, 77, 237–243 CrossRef CAS PubMed.
  23. E. S. Steigerwalt, G. A. Deluga and C. M. Lukehart, J. Phys. Chem. B, 2002, 106, 760–766 CrossRef CAS.
  24. N. D. Luong, Y. Lee and J. D. Nam, J. Mater. Chem., 2008, 18, 4254–4259 RSC.
  25. Y. C. Zhao, F. Y. Wang, J. N. Tian, X. L. Yang and L. Zhan, Electrochim. Acta, 2010, 55, 8998–9003 CrossRef CAS PubMed.
  26. M. M. Zhang, Z. X. Yan, Q. Sun, J. M. Xie and J. J. Jing, New J. Chem., 2012, 36, 2533–2540 RSC.
  27. F. Yang, Y. Liu, L. Gao and J. Sun, J. Phys. Chem. C, 2010, 114, 22085–22091 CAS.
  28. W. S. Hummers and R. E. Offeman, J. Am. Chem. Soc., 1958, 80, 1339 CrossRef CAS.
  29. H. L. Guo, X. F. Wang, Q. Y. Qian, F. B. Wang and X. H. Xia, Nano Lett., 2009, 3, 2653–2659 CAS.
  30. B. Unnikrishnan, P. Ru and S. M. Chen, Sens. Actuators, B, 2012, 169, 235–242 CrossRef CAS PubMed.
  31. Y. Zhang, X. Yuan, Y. Wang and Y. Chen, J. Mater. Chem., 2012, 22, 7245–7251 RSC.
  32. H. Xia, D. Zhu, Z. Luo, Y. Yu, X. Shi, G. Yuan and J. Xie, Sci. Rep., 2013, 29781, 1–8 Search PubMed.
  33. S. Deng, D. Sun, C. Wu, H. Wang, J. Liu, Y. Sun and H. Yan, Electrochim. Acta, 2013, 111, 707–712 CrossRef CAS PubMed.
  34. Z. Z. Jiang, Z. B. Wang, Y. Y. Chu, D. M. Gu and G. P. Yin, Energy Environ. Sci., 2011, 4, 728–735 CAS.
  35. R. Liu, H. Zhou, J. Liu, Y. Yao, Z. Huang, C. Fu and Y. Kuang, Electrochem. Commun., 2013, 26, 63–66 CrossRef CAS PubMed.
  36. C. Ma, W. Liu, M. Shi, X. Lang, Y. Chu, Z. Chen, D. Zhao, W. Lin and C. Hardacre, Electrochim. Acta, 2013, 114, 133–141 CrossRef CAS PubMed.
  37. D. Chen, Y. Zhao, Y. Fan, W. Wang, X. Li, X. Peng, X. Wang and J. Tian, Int. J. Hydrogen Energy, 2013, 1–8 CrossRef PubMed.
  38. H. Wang, J. Du, Z. Yao, R. Yue, C. Zhai, F. Jiang, Y. Du, C. Wang and P. Yang, Colloids Surf., A, 2013, 436, 57–61 CrossRef CAS PubMed.
  39. Z. Li, L. Zhang, X. Huang, L. Ye and S. Lin, Electrochim. Acta, 2014, 121, 215–222 CrossRef CAS PubMed.
  40. Y. Hu, P. Wu, H. Zhang and C. Cai, Electrochim. Acta, 2012, 85, 314–321 CrossRef CAS PubMed.
  41. S. Lin, C. Shen, D. Lu, C. Wang and H. Gao, Carbon, 2013, 53, 112–119 CrossRef CAS PubMed.
  42. S. Yu, Q. Liu, W. Yang, K. Han, Z. Wang and H. Zhu, Electrochim. Acta, 2013, 94, 245–251 CrossRef CAS PubMed.

Footnote

Electronic supplementary information (ESI) available. See DOI: 10.1039/c4ra05507a

This journal is © The Royal Society of Chemistry 2014
Click here to see how this site uses Cookies. View our privacy policy here.