Novel optical characteristics of Eu2+ doped and Eu2+, Ce3+ co-doped LiSi2N3 phosphors by gas-pressed sintering
Quansheng Wu,
Yanyan Li,
Xicheng Wang,
Zhengyan Zhao,
Chuang Wang,
Hao Li,
Aijun Mao and
Yuhua Wang*
Key Laboratory for Special Function Materials and Structural Design of the Ministry of the Education, School of Physical Science and Technology, Lanzhou University, Lanzhou, 730000, China. E-mail: wyh@lzu.edu.cn; Fax: +86-931-8913554; Tel: +86-931-8912772
First published on 20th August 2014
Abstract
Eu2+ doped and Eu2+, Ce3+ co-doped LiSi2N3 phosphors were successfully prepared by gas-pressed sintering in this study. The dominant excitation band of LiSi2N3:Eu2+ was found at about 355 nm and exhibited a broad-band yellow emission centered at 592 nm instead of the early reports of 310 nm and 580 nm, respectively. The shifting behavior dominantly contributed to different oxygen content in the host. The second luminescent center formed by the introduction of oxygen into nitride phosphors was discussed in detail. The detailed energy transfer mechanism from Ce3+ to Eu2+ in the LiSi2N3 host is also reported and a notable unusual redshift behavior was observed in Eu2+, Ce3+ co-doped LiSi2N3 phosphors.
1 Introduction
It is well known that the spectral properties of rare-earth ions with 5d–4f transitions (e.g. Eu2+, Ce3+) strongly depend on the surrounding environment (e.g., symmetry, covalence, coordination, bond length, site size, crystal-field strength, etc.), due to the fact that the 5d excited state is not shielded from the crystal field by the 5s2 and 5p6 electrons.1–3 Such types of rare-earth ions show long wavelength absorption and band emission in the nitride-based materials, due to the high covalency and the large crystal field splitting effect of the nitrogen anion.4,5 As is known, the nitrogen ion (N3−) has a higher effective charge compared with the oxygen ion (O2−), and the electronegativity of nitrogen (3.04) is smaller than that of oxygen (3.50). Therefore, coordinating with nitrogen would cause a stronger nephelauxetic effect (covalence), the centre of gravity of the 5d states of the activator ions shifting to longer wavelength, and the crystal-field splitting being larger than that in a similar oxygen environment.6,7 The nitrides and oxynitrides activated by these rare-earth ions have demonstrated to be promising efficient conversion phosphors for white Light-Emitting Diodes (LEDs), due to long-wavelength emission at the near-UV or blue excitation, as well as their small thermal quenching and high quantum efficiency.8 The composition of nitride phosphors is normally focused on the alkaline earth silicon nitride/oxynitride, e.g., M2Si5N8 (ref. 9–13) and MSi2N2O2,14–16 (M = Ca, Sr, Ba), as well as alkaline earth aluminum–silicon nitride/oxynitride, e.g., CaAlSiN3 (ref. 17 and 18) or Ca-α-Sialon19,20 etc.Beyond these common phosphor materials, LiSi2N3 is a novel nitride based phosphor among Li3N–Si3N4 system reported by Y. Q. Li and coworkers using traditional solid-state reaction.21 LiSi2N3:Eu2+ shows a fairly broad yellow emission (580 nm) in the range of 400–800 nm when excited at 310 nm. The emission bands of Eu2+ exhibited a blue-shift and the shapes of the emission bands changed greatly with the increasing temperature. These two luminescent phenomena may be related to the multi-luminescent centers. However, these two luminescent phenomena and radiative mechanisms are not fully understood in the early report. Doped nitride-based phosphors usually have more complicated chemistry. Understanding how substitutions (nitrogen ions replaced by oxygen ions) tune photoluminescence is important because the local environment of activator ions through substitutions probably has considerable difference from the structural average. Herein, in order to better for the basic research and explore the potential applications in n-UV LEDs, single-phased Li1−2xSi2N3:Eux2+, and Li0.991−2xSi2N3:Eux2+, Ce0.0033+ (x = 0–0.01) phosphors were prepared by gas-pressed sintering in the present work. The impact of oxygen content on photoluminescence properties of LiSi2N3:Eu2+ was investigated in detail in this study. The luminescence properties of Eu2+, Ce3+ co-doped LiSi2N3 phosphors were also investigated.
2 Experimental sections
2.1 Materials and synthesis
A series of nitridosilicate phosphors, Li1−2xSi2N3:Eux2+, and Li0.991−2xSi2N3:Eux2+, Ce0.0033+ (x = 0–0.01), were prepared by gas-pressed sintering. Stoichiometric amounts of powder Li3N (Aldrich, >99.50%), Si3N4 (Aldrich, 99.90%), CeN and EuCl3 (Aldrich, 99.999%) were ground in an agate mortar for 30 min in a glovebox to form a homogeneous mixture. CeN was pre-synthesized by nitriding the Ce (Aldrich, >99.9%) metals under a flowing pure nitrogen atmosphere at 800 °C. The concentrations of both moisture and oxygen in the glovebox were <1 ppm. Thereafter, the powder mixtures were transferred into BN crucibles and heated at 1500 °C for 2 h under high-purity nitrogen (99.9995%) atmosphere at a pressure of 0.5 MPa. The CaAlSiN3−xOx:Eu2+ phosphors were also prepared as referenced samples heated at 1750 °C for 4 h under a pressure of 1.0 MPa using Ca3N2 (Aldrich, >95.0%), CaCO3(AR), Si3N4 (Aldrich, 99.5%), and AlN (Aldrich, >98.0%). Before nitrogen imported into the furnace, the pressure condition was evacuated to 10−2 Pa vacuum state. The sintered products were ground again, yielding crystalline powder.2.2 Characterization
All measurements were made on finely ground powder. The phase purity of samples were analyzed by X-ray diffraction (XRD) using a Rigaku D/Max-2400 X-ray diffractometer with Ni-filtered Cu Kα radiation. Photoluminescence (PL) and excitation (PLE) spectra were measured at room temperature using a FLS-920T fluorescence spectrophotometer equipped with a 450W Xe light source and double excitation monochromators. Diffuse reflectance ultraviolet-visible (UV-vis) absorption spectra were measured using a Perkin Elmer 950 spectrometer, while BaSO4 was used as a reference. The PL decay curves were measured by an FLS-920T fluorescence spectrophotometer with an F900 nanosecond flash hydrogen lamp as the light source. High temperature luminescence intensity measurements were carried out by using an aluminum plaque with cartridge heaters; the temperature was measured by thermocouples inside the plaque and controlled by a standard TAP-02 high temperature fluorescence controller. The powder morphology was investigated by scanning electron microscopy (SEM; S-3400, Hitachi, Japan). Chemical composition was carried out with a scanning electron microscope (SEM; S-4800, Hitachi, Japan) equipped with an Energy Dispersive Spectrometer (EDS) system.3 Results and discussion
3.1 Phase identification and morphology observation
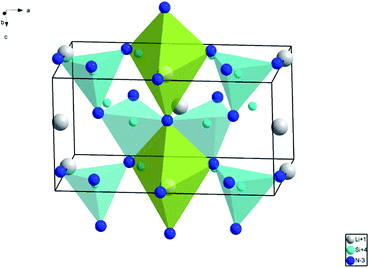
The phase identification of Li0.991−2xSi2N3:Eux2+, Ce0.0033+ and Li1−2xSi2N3:Eux2+ (x = 0–0.01) phosphors characterized by XRD are shown in Fig. 1. As can be seen, both of the powder diffraction patterns are in good agreement with standard card (JCPDS card 26-1186) and there is no detectable impurity phase presented. The result indicates that the Li0.991−2xSi2N3:Eux2+, Ce0.0033+ and Li1−2xSi2N3:Eux2+ retain a single phase. The diffraction peaks of Li0.991−2xSi2N3:Eux2+, Ce0.0033+ and Li1−2xSi2N3:Eux2+ are shifted a little to lower angles with respect to the position of standard LiSi2N3, which is due to the fact that the radii of Ce3+ and Eu2+ are larger than that of Li+ in the LiSi2N3 host lattice. And this indicates that Ce3+ and Eu2+ have been effectively incorporated into the LiSi2N3 host lattice. LiSi2N3 is isostructural with Si2N2O and Li2SiO3, having wurtzite-type structure (space group Cmc21).22,23 Similar to Si2N2O, the framework of [Si2N3] in LiSi2N3 is built up by two-dimensional in finite, parallel layers of condensed [Si6N6] twelve-membered rings formed by corner sharing of the nitrogen atoms of the SiN4 tetrahedra.23 Li+ occupies the 4a site and directly connects with five nitrogen atoms within the unit cell (∼2.7 Å), as shown in Fig. 2.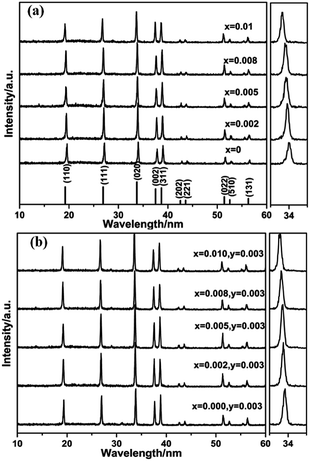 | ||
| Fig. 1 XRD patterns of (a) Li1−2xSi2N3:Eux2+ and (b) Li0.991−2xSi2N3:Eux2+, Cey3+ (x = 0–0.01, y = 0.003) phosphors. | ||
The SEM micrographs of Li0.99Si2N3:Eu0.0052+ and Li0.981Si2N3:Eu0.0052+, Ce0.0033+ phosphors are shown in Fig. 3c and a. Li0.99Si2N3:Eu0.0052+ and Li0.981Si2N3:Eu0.0052+, Ce0.0033+ phosphors both exhibit an amorphous morphology and a fine grain size with diameters of about 1 mm. However, the grains also have a little aggregate.
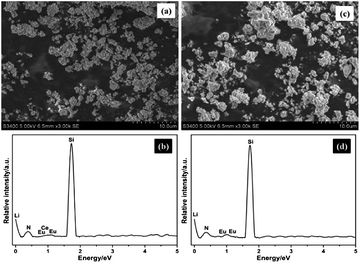 | ||
| Fig. 3 SEM micrographs and EDS patterns of Li0.981Si2N3:Eu0.0052+, Ce0.0033+ (a and b) and Li0.99Si2N3:Eu0.0052+ (c and d). | ||
The corresponding EDX spectra analysis (Fig. 3b and d) indicates that the product has a chemical composition of Li, Si, N and Eu (Ce), and no impurity element exists. In addition, no signal of oxygen was detected in the Li0.981Si2N3:Eu0.0052+, Ce0.0033+ and Li0.99Si2N3:Eu0.0052+ samples, which indicates that the samples have a very low oxygen content.
3.2 Luminescence properties of LiSi2N3:Eu2+
The reflection spectra, excitation and emission spectra of the as-prepared Li0.99Si2N3:Eu0.012+ powders are shown in Fig. 4. The undoped sample shows a white body color and has an absorption in the range of 200–230 nm. For the Eu2+-doped samples, strong absorption bands are presented from 230 to 450 nm region. The excitation spectrum shows a broadband profile covering the range from the near-UV to visible part, which has 3 peaks at ∼296 nm, ∼355 nm, and ∼395 nm, respectively, which is assigned to 4f → 5d transition of Eu2+ ions. The emission band is located in the range of 475–800 nm resulting in a yellow emission. This fairly broad emission band (FWHM = 160 nm) may be related to multi-luminescent centers in LiSi2N3 host.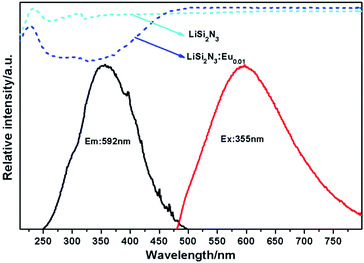 | ||
| Fig. 4 The reflection spectra (x = 0, 0.01), excitation and emission spectra (x = 0.01) of the as-prepared Li1−xSi2N3:Eux2+. | ||
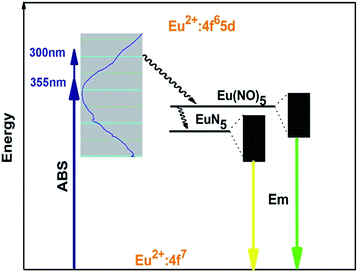
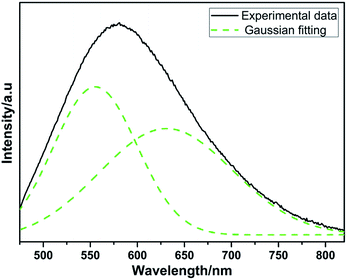
However, different with the early report by Y. Q. Li etc.,21 the dominant excitation band of Eu2+ is found at relative low energy peaking at about 355 nm instead of 310 nm. Moreover, the emission peak shows red shift from 580 nm to 592 nm at the same Eu concentration. Apparently, small amounts of oxygen are quite inevitable in nitridosilicates. The raw materials of Li3N and Si3N4 contain some oxygen content. According to the different synthesized processes, the phosphors LiSi2N3:Eu2+ prepared by using the horizontal tube furnace reported by Y. Q. Li etc.21 would contain more oxygen than the ones prepared by using the gas pressure sintering furnace. As is known, the anions, that is, N3− and O2−, which coordinated with the activator Eu2+, determine the luminescence properties by the variation of surrounding covalency. Based on the above analysis, there will be multi-luminescent centers in LiSi2N3 host when nitrogen is partially replaced by oxygen. The 5d levels of Eu2+ that are not shielded from the outside environment split under different ligand field strength and the number of split levels is determined by the local symmetry around Eu2+ ions.1–3,24 In the present case, the incorporated Eu2+ ions are hexahedrally coordinated and presented as EuN5 hexahedron. When incorporating oxygen content, the nitrogen sites in the EuN5 hexahedron are partially replaced by O2− ions to form Eu(N, O)5, which reduces the nephelauxetic effect around Eu2+ ions. As a result, the excitation band and the emission band originates from the overlap of two types of Eu2+ ions with different environments: EuN5 and Eu(N, O)5. The obvious difference between the excitation bands observed is owing to the following factors. On one hand, a large amount of luminescent centers of Eu(N, O)5 form in the structure with the increase of oxygen content. Consequently, the decrease of covalency around the Eu2+ environment results in the movement of barycenter of 5d orbitals to higher energy location. On the contrary, the decrease of oxygen content would result in the movement of barycenter of 5d orbitals to lower energy location. This is also in good agreement with the red-shifting behavior of the emission spectra observed in this work. On the other hand, the activator Eu2+ in EuN5 and Eu(N, O)5 forms two individual energy levels. According to the change in environmental covalency discussed above, 5d barycenter of Eu2+ in Eu(N, O)5 is higher than that in EuN5 as the schematic illustration of energy level shown in Fig. 5. When excited at a shorter wavelength (300 nm), the high energy absorbed by the phosphor (ABS) is firstly transferred to the barycenter of Eu2+ in Eu(N, O)5 environment with a stoke shift, and then jumps to the lower 5d barycenter of Eu2+ in EuN5 through a nonradiative transition. The former process corresponds to the short wavelength excitation, while the latter one provides a long wavelength excitation. Evidently, the energy prefers the former excitation process to the 4f65d excited state at the ultraviolet excitation, resulting in different shapes of the excitation bands. Furthermore, the emission of LiSi2N3:Eu0.0052+ can be well separated to two peaks locating at 550 nm and 630 nm, by the Gaussian fitting as plotted in Fig. 6, which is consistent with the above discussion. The emission of 550 nm and 630 nm can be assigned to the transitions of Eu2+ in the form of Eu(N, O)5 and EuN5, respectively.
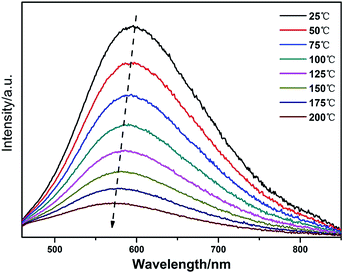
This is also supported by the results of emission spectra of LiSi2N3:Eu2+ with the temperature increasing. As shown in Fig. 7. The emission exhibits a blue-shifting with temperature increasing. To account for this observation, it should be considered that thermally active phonon-assisted tunneling from the excited states of low-energy emission band (EuN5) to the excited states of high-energy emission band (Eu(N, O)5) in the configuration coordinate diagram occurs.25,26 Two emissions arise from different minima on the potential energy surface of relaxed excited state as given in Fig. 5. At low temperature, the barrier E1 (355 nm) can be overcome and the low-energy emission (EuN5) is dominant. At higher temperature, the thermal back-transfer over the barrier E2 (300 nm) is possible, and consequently the higher energy emission (Eu(N, O)5) is dominant. Thus, the blue-shift behavior is observed with increasing temperature.
Moreover, this assumption can be further supported by the comparison of the luminescence properties of CaAlSiN3−xOx:Eu2+ (x > 0) and CaAlSiN3:Eu2+, as shown in Fig. 8. The dominant excitation band of CaAlSiN3:Eu2+ is found at 460 nm, and the emission peak is at 645 nm. When incorporating oxygen content, the excitation band and emission band of CaAlSiN3:Eu2+ exhibits a blue-shifting behavior and the emission band shows a larger full wide half maximum, indicating that the introduction of oxygen at the surrounding environment of Eu2+ would form two luminescent centers (EuN4 and Eu(N, O)4), which results in the blue-shifting of emission bands and excitation bands.
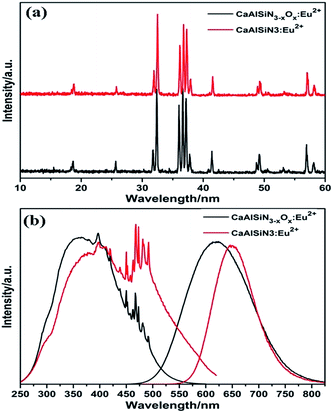 | ||
| Fig. 8 (a) XRD patterns, (b) excitation and emission spectra of the as-prepared CaAlSiN3−xOx:Eu2+ and CaAlSiN3:Eu2+. | ||
3.2 Luminescence properties of Li0.991−2xSi2N3:Eux2+, Ce0.003 (x = 0–0.01)
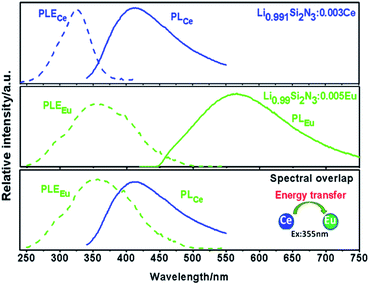
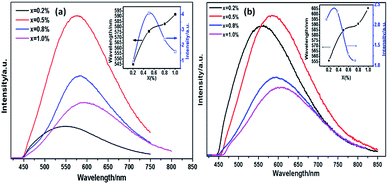
Spectral overlap between the excitation band of Eu2+ (PLEEu) and the emission band of Ce3+ (PLCe) in LiSi2N3 hosts shown in Fig. 9 is likely to be the resonant energy transfer from Ce3+ to Eu2+.27 The concentration of Ce3+ is fixed at 0.003 with tuning the concentrations of Eu2+ to investigate the energy transfer mechanism from Ce3+ to Eu2+ in LiSi2N3 host.The emission spectra of Li0.991−2xSi2N3:Eux2+, Ce0.0033+ and Li0.991−2xSi2N3:Eux2+ (x = 0–0.01) are shown in Fig. 10, which describes the highest emission intensity at x = 0.005. Compared with Eu2+ doped LiSi2N3, Eu2+, Ce3+ co-doped LiSi2N3 exhibits a red-shifting behavior. The emission bands of Li0.991−2xSi2N3:Eux2+, Ce0.0033+ exhibit a greenish-yellow emission with broad bands peaking at about 556–606 nm. The redshift is owing to the following two factors: the first one is that the high energy of excitation would be absorbed by Ce3+ ions and then converted to lower energy to excite Eu2+ ions; the second one is that the Eu–N/O bonds become more covalent as a result of using the larger Ce3+ ions to substitute for the second-neighbor Li+ ions around activator ion. The covalence of Eu–N/O bonds and the crystal field splitting effect are progressively enhanced by the neighbor-cation control, resulting in the observed red-shifting in the emission energy.28,29 However, compared with Eu2+ doped LiSi2N3, Eu2+, Ce3+ co-doped LiSi2N3 exhibited lower emission intensity. The main reason is that the Li vacancies formed when Ce3+ substitutes Li+, which results in a number of luminescence killers in the LiSi2N3 host.
According to Dexter's theory, the definition of the critical distance of energy transfer from Ce3+ to Eu2+ is the distance for the probability of transfers being equal to the probability of radiative emission of Ce3+.30 The RC between Ce3+ and Eu2+ was also obtained from spectra data based on Dexter's energy transfer theory and the equation: RC6 = 0.63 × 1028 × 4.8 × 10−16 × PA/E4 × ∫fS(E)FA(E)dE,31 where PA is the oscillator strength of the transition, which for Ce3+ ion was taken as 0.01, E is the energy of maximum spectral overlap calculated (from Fig. 5) as 3.20 eV, and ∫fS(E)FA(E)dE is the spectral overlap between the normalized shapes of Ce3+ emission spectrum (fS(E)) and the Eu2+ excitation spectrum (FA(E)), calculated (from Fig. 9) to be 0.046 eV−1. The calculated value of the RC between Ce3+ and Eu2+ for LiSi2N3 is about 15.38 Å, which is longer than 3–4 Å3, indicating that the energy transfer mechanism from Ce3+ to Eu2+ in LiSi2N3 host can take place via the electric multipolar interaction rather than the exchange interaction mechanism.32
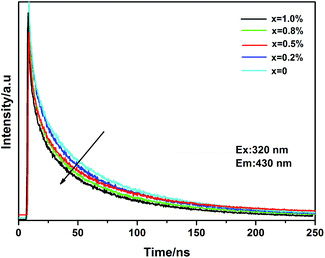
Fig. 11 shows the decay curves of Ce3+ for Li0.991−2xSi2N3:Eux2+, Ce0.0033+ phosphors monitored at 430 nm with an irradiation of 320 nm. The results clearly demonstrate that the lifetimes of Ce3+ become shorter with increasing Eu2+ concentration. Hence, it is likely that the energy transfer from Ce3+ to Eu2+ is a nonradiative resonant type in the LiSi2N3 host. In general, energy transfer from the sensitizer to activator in a phosphor may take place via a multipolar interaction or an exchange interaction at higher concentrations. On the basis of Dexter's energy transfer expression for multipolar interactions and Reisfeld's approximation,33,34 the following relationship can be given.
| PSA = 1/τs0 − 1/τs ∝ Cn/3 | (1) |
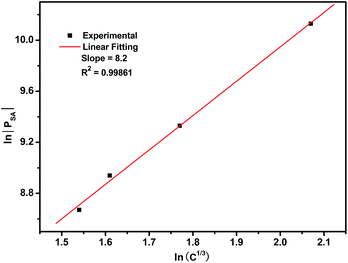 | ||
Fig. 12 Dependence of ln![[thin space (1/6-em)]](https://www.rsc.org/images/entities/char_2009.gif) |PSA| vs. ln(C1/3) for the Li0.991−2xSi2N3:Eux2+, Ce0.0033+ (0.002 ≤ x ≤ 0.01) phosphors. |PSA| vs. ln(C1/3) for the Li0.991−2xSi2N3:Eux2+, Ce0.0033+ (0.002 ≤ x ≤ 0.01) phosphors. | ||
For application in high power LEDs, the thermal stability of phosphors is one of the important issues to be considered. The temperature dependence of the emission spectra of Li0.981Si2N3:Eu0.0052+, Ce0.0033+ and Li0.99Si2N3:Eu0.0052+ under excitation at 355 nm are shown in Fig. 13, which show a relatively poor thermal stability. It is believed that thermal ionization is mainly responsible for quenching of the luminescence of Eu2+ at high temperatures in LiSi2N3 host,1 because the excited 5d electrons are easily ionized by the absorption of thermal energy and entrance into the bottom of the conduction band of the host through the top of the Eu2+ excitation levels. At 150 °C, the integral emission intensity of the Li0.981Si2N3:Eu0.0052+, Ce0.0033+ phosphor is about 30% of that measured at room temperature. Compared with Eu2+ doped LiSi2N3, Eu2+, Ce3+ co-doped LiSi2N3 shows a slightly higher thermal quenching.
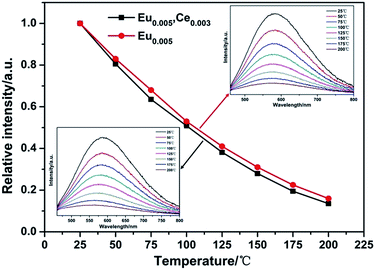 | ||
| Fig. 13 The temperature dependence of the emission spectra of Li0.981−2xSi2N3:Eu0.0052+, Ce0.0033+ and Li0.99Si2N3:Eu0.0052+. | ||
4 Conclusions
In this work, we have investigated the synthesis and luminescence properties of LiSi2N3:Eu2+. The low content of oxygen at the surrounding environment of Eu2+ results in the red-shifting of excitation and emission bands, and it is elucidated by the energy transition mechanism. On the other hand, the energy transfer mechanism from Ce3+ to Eu2+ in the LiSi2N3 host was investigated to be electric multipolar interaction and a notable unusual redshift behavior was observed in the Li0.991−2xSi2N3:Eux2+, Ce0.0033+ system due to the neighbor-cation control, which will be useful in tuning optical and other properties that are sensitive to local coordination environments.Acknowledgements
This work is supported by Specialized Research Fund for the Doctoral Program of Higher Education (no. 20120211130003) and the National Natural Science Funds of China (Grant no. 51372105).Notes and references
- G. Blasse and B. C. Grabmaier, Luminescent Materials, Springer, 1994 Search PubMed.
- J. W. H. van Krevel, H. T. Hintzen, R. Metselaar and A. Meijerink, J. Alloys Compd., 1998, 268, 272 CrossRef CAS.
- R. J. Xie, N. Hirosaki and M. Mitomo, J. Electroceram., 2008, 21, 370 CrossRef CAS.
- J. Ballato, J. S. Lewis III and P. Holloway, Mater. Res. Bull., 1999, 9, 51 Search PubMed.
- Z. J. Zhang, O. M. ten Kate, A. Delsing, E. van der Kolk, P. H. L. Notten, P. Dorenbos, J. Zhao and H. T. Hintzen, J. Mater. Chem., 2012, 22, 9813 RSC.
- Z. Y. Zhao, Z. G. Yang, Y. R. Shi, C. Wang, B. Liu, G. Zhu and Y. H. Wang, J. Mater. Chem. C, 2013, 1, 1407 RSC.
- C. W. Yeh, W. T. Chen, R. S. Liu, S. F. Hu, H. S. Sheu, J. M. Chen and H. T. Hintzen, J. Am. Chem. Soc., 2012, 134, 14108–14117 CrossRef CAS PubMed.
- R. J. Xie and N. Hirosaki, Sci. Technol. Adv. Mater., 2007, 8, 588–600 CrossRef CAS PubMed.
- R. J. Xie, N. Hirosaki, T. Suehiro, F. F. Xu and M. Mitomo, Chem. Mater., 2006, 18, 5578 CrossRef CAS.
- Y. Kim, J. Kim and S. Kang, J. Mater. Chem. C, 2013, 1, 69–78 RSC.
- W. T. Chen, H.-S. Sheu, R. S. Liu and J. P. Attfield, J. Am. Chem. Soc., 2012, 134, 8022–8025 CrossRef CAS PubMed.
- M. Zeuner, P. J. Schmidt and W. Schnick, Chem. Mater., 2009, 21, 2467 CrossRef CAS.
- M. Zeuner, F. Hintze and W. Schnick, Chem. Mater., 2009, 21, 336 CrossRef CAS.
- W. B. Park, S. P. Singh, C. Yoon and K. S. Sohn, J. Mater. Chem. C, 2013, 1, 1832–1839 RSC.
- M. Seibald, T. Rosenthal, O. Oeckler, C. Maak, A. Tücks, P. J. Schmidt, D. Wiechert and W. Schnick, Chem. Mater., 2013, 25(9), 1852–1857 CrossRef CAS.
- Y. Gu, Q. Zhang, H. Wang and Y. Li, J. Mater. Chem., 2011, 21, 17790–17797 RSC.
- X. Q. Piao, K. I. Machida, T. Horikawa, H. Hanzawa, Y. Shimomura and N. Kijima, Chem. Mater., 2007, 19, 4592–4599 CrossRef CAS.
- S. S. Wang, W. T. Chen, Y. Li, J. Wang, H. S. Sheu and R. S. Liu, J. Am. Chem. Soc., 2013, 135, 12504–12507 CrossRef CAS PubMed.
- Q. S. Wu, Y. H. Wang, Z. G. Yang, M. D. Que, Y. Y. Li and C. Wang, J. Mater. Chem. C, 2014, 2, 829 RSC.
- R. J. Xie, N. Hirosaki, M. Mitomo, T. Suehiro, X. Xu and H. Tanaka, J. Am. Ceram. Soc., 2005, 88(10), 2883–2888 CrossRef CAS PubMed.
- Y. Q. Li, N. Hirosaki, R. J. Xie, T. Takeka and M. Mitomo, J. Solid State Chem., 2009, 182, 301–311 CrossRef CAS PubMed.
- J. David, Y. Laurent, J. P. Charlot and J. Lang, Bull. Soc. Fr. Mineral. Cristallogr., 1973, 96, 21 CAS.
- M. Orth and W. Schnick, Z. Anorg. Allg. Chem., 1999, 625, 1426 CrossRef CAS.
- Y. Wang, F. Y. Zhao, X. Q. Piao, Z. Sun, T. Horikawa and K. I. Machida, ECS J. Solid State Sci. Technol., 2013, 2(7), R131–R134 CrossRef CAS PubMed.
- S. Shionoya and W. M. Yen, Phosphor Handbook, CRC Press, New York, 1998 Search PubMed.
- J. S. Kim, Y. H. Park, S. M. Kim, J. C. Choi and H. L. Park, Solid State Commun., 2005, 133, 445–448 CrossRef CAS PubMed.
- J. Sun, J. Zeng, Y. Sun and H. Du, J. Alloys Compd., 2012, 81, 540 Search PubMed.
- W. Y. Huang, F. Yoshimura, K. Ueda, Y. Shimomura, H. S. Sheu, T. S. Chan, C. Y. Chiang, W. Z. Zhou and R. S. Liu, Chem. Mater., 2014, 26(6), 2075–2085 CrossRef CAS.
- Q. S. Wu, Z. G. Yang, Z. Y. Zhao, M. D. Que, X. C. Wang and Y. H. Wang, J. Mater. Chem. C, 2014, 2, 4967 RSC.
- D. L. Dexter, J. Chem. Phys., 1953, 21, 836 CrossRef CAS PubMed.
- C. H. Hsu, B. M. Cheng and C. H. Lu, J. Am. Ceram. Soc., 2011, 94, 2878 CrossRef CAS PubMed.
- Z. G. Xia and R. S. Liu, J. Phys. Chem. C, 2012, 116(29), 15604–15609 CAS.
- J. Solé, L. Bausa and D. Jaque, An introduction to the optical spectroscopy of inorganic solids[M], John Wiley & Sons, 2005 Search PubMed.
- G. Blasse, Phys. Lett. A, 1968, 28, 444–445 CrossRef CAS.
- G. Blasse and B. C. Grabmaier, Luminescent Materials, Springer-Verlag, Berlin, Germany, 1994 Search PubMed.
| This journal is © The Royal Society of Chemistry 2014 |

