Composition dependence of physical properties of biodegradable poly(ethylene succinate) urethane ionenes

Fang Wu, Cai-Li Huang, Jian-Bing Zeng*, Shao-Long Li and Yu-Zhong Wang*
Center for Degradable and Flame-Retardant Polymeric Materials (ERCPM-MoE), College of Chemistry, State Key Laboratory of Polymer Materials Engineering, National Engineering Laboratory of Eco-Friendly Polymeric Materials (Sichuan), Sichuan University, 29 Wangjiang Road, Chengdu 610064, China. E-mail: zengjianbing@scu.edu.cn; yzwang@scu.edu.cn; Fax: +86-28-85410755; Tel: +86-28-85410755

Received 9th June 2014 , Accepted 23rd September 2014

First published on 24th September 2014


Abstract

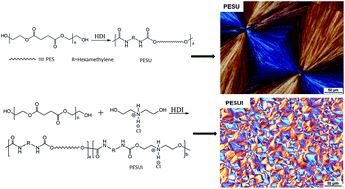
To obtain an excellent comprehensive performance of poly(ethylene succinate) (PES), we have synthesized a series of poly(ethylene succinate) (PES) urethane ionenes (PESUIs) with various content of urethane ionic group by the chain extension reaction of dihydroxyl-terminated poly(ethylene succinate) and diethanolamine hydrochloride with hexamethylene diisocyanate as a chain extender, and we systematically investigated the composition dependence of the physico-chemical properties of PESUI through a series of characteristic techniques. The results of thermal and crystallization behaviors suggest that the incorporation of urethane ionic group slightly affects the glass transition temperature, melting temperature, and thermal stability, and significantly accelerates the crystallization rate of PES without changing the crystallization mechanism. The fastest crystallization rate was reached with the incorporation of 4 mol% urethane ionic groups. Spherulitic morphology observation indicates that nucleation density significantly increased, while spherulitic growth rate gradually decreased with increase in urethane ionic group content. Both complex viscosity and storage modulus initially increased and then decreased with increase in urethane ionic group content, and their maximum values were observed for the sample with 4 mol% of urethane ionic group. Mechanical properties slightly varied with urethane ionic group content.


1. Introduction

Because of the increasing environmental pollution caused by the indiscriminate use of non-degradable fossil-based plastics, biodegradable polymers have attracted increasing attention. Aliphatic polyesters exhibit good biodegradability and excellent physical properties, and thus can be used as potential substitutes for non-degradable conventional plastics, such as polyethylene (PE) and polypropylene (PP), in the application of packaging, mulching film, shopping and trash bags, and disposable food containers.1–7 In addition, the aliphatic polyesters usually possess excellent biocompatibility, and thus find wide application in biomedical materials.8–12 Furthermore, some of the aliphatic polyesters such as poly(lactic acid), succinic acid-based polymers, and bacterial polyesters can be derived from renewable resources, which makes them independent from petroleum, whose reserves are rapidly decreasing.13–17 Therefore, the development of aliphatic polyesters is of significance for both environmental protection and resource conservation.

Poly(butylene succinate) (PBS) and poly(ethylene succinate) (PES) are two important succinic acid-based polyesters with good mechanical properties, thermal stability and processibility and relatively higher melting temperatures.18,19 The success in the production of succinic acid via the bioconversion of renewable resources, such as starch, enables those polymers to be bio-based,3,15–17 which would further stimulate the development of these polyesters. Because PBS shows comparable mechanical strength and toughness to PE and PP, it is regarded to be the most promising biodegradable aliphatic polyester to substitute them in general purpose application. However, PES has received less attention, although it shows similar physical properties, and it is considerably cost-effective than PBS.20

It is known that crystallization plays a crucial role in the physical properties of polymers. Thus, crystallization behaviors, including the crystal structures, crystallization kinetics, crystalline morphology and growth of PBS and PES, have been widely investigated in the recent literature.21–29 Crystallization rate is a very important parameter for the thermal processing of crystalline polymers, in particular with low glass transition temperature because their ultimate shapes can only be formed when crystallization takes place. Compared with PBS, PES has a slow crystallization rate;25,30 this may be one of the main reasons for the considerable development of the industrialization of PBS compared to that of PES, although the latter is less expensive.

The crystallization rate of PES can be regulated via physical blending or chemical copolymerization with other components or compounding with nanoparticles.30–40 Chemical copolymerization does not have potential to increase the crystallization rate of PES due to the increased disturbance of molecular chains.34,39,40 Physical blending is also incapable of significantly accelerating the crystallization rate of PES.30,33 Compounding with nanoparticle represents an efficient way to increase the crystallization rate of PES through nucleation.31,37 However, nanoparticles are usually inorganic compounds showing poor compatibility with PES; thus, although crystallization rate is increased, other properties may deteriorate because the nanoparticles tend to aggregate.

We found that when urethane ionic group was incorporated into PES to form PES urethane ionene (PESUI), the crystallization rate of PES segment could be significantly improved.41 Except for crystallization behaviors, other properties including rheological behaviors, mechanical properties, and the thermal stability of aliphatic polyesters are also very important for practical applications. In this study, we have synthesized a series of PESUIs with the molar fraction of urethane ionic group from 1% to 5%, and systematically investigated the effect of the content of urethane ionic group on the thermal properties, crystallization behaviors, and mechanical and rheological properties of the PESUI, and we compared the results with those of PES urethane (PESU), which does not contain ionic group.

2. Experimental section

2.1 Materials

Ethylene glycol and succinic acid of AR grade were obtained from Kelong Chemical Corporation (Chengdu, China) and used without further purification. Tetrabutyl titanate (Kelong Chemical Corporation, Chengdu, China) with a concentration of 0.2 g mL−1 was prepared by dissolving it in anhydrous toluene. Hexamethylene diisocyanate (HDI, AR grade) and diethanolamine hydrochloride (DEAH) procured from Sigma-Aldrich were used as received. All other chemicals with reagent grade were used without any purification.

2.2 Synthesis of dihydroxyl-terminated poly(ethylene succinate) (HO-PES-OH)

HO-PES-OH was prepared by a two-step method of transesterification and polycondensation. The detailed procedures were reported in our previous papers.10,11,36 Typically, succinic acid and ethylene glycol with a molar ratio of 1[thin space (1/6-em)]:[thin space (1/6-em)]1.2 were added into a three-neck round-bottom flask equipped with water separator, nitrogen inlet pipe, and mechanical stirrer. The reactants were mechanically stirred at 180 °C for 4 h under N2 atmosphere to complete esterification, and then the catalyst tetrabutyl titanate (0.1 wt% of the total reactants) was added into the flask. Polycondensation was carried out at 220 °C under vacuum of 30 Pa for 60 min. The resultant was cooled to room temperature and directly used.

2.3 Synthesis of poly(ethylene succinate) urethane ionene (PESUI)

PESUI was synthesized by the chain extension reaction of HO-PES-OH and DEAH with HDI as a chain extender. Typically, the predetermined amounts of HO-PES-OH and DEAH were added into the reactor, which was vacuumed and purged three times with nitrogen. The reactor was heated to 150 °C to melt HO-PES-OH, then the reactants were mechanically stirred to homogeneous melts, and the predetermined amount of HDI was injected into the reactor. The chain extension reaction was finished in 1 h. The sample was purified by dissolving in CHCl3, followed by precipitating in excess CH3OH. The obtained powdered products were vacuum dried at 40 °C for 2 days before characterization. Six samples with the molar ratios of HO-PES-OH (based on the molecular weight of PES repeating unit) to DEAH to be 100[thin space (1/6-em)]:[thin space (1/6-em)]0, 99[thin space (1/6-em)]:[thin space (1/6-em)]1, 98[thin space (1/6-em)]:[thin space (1/6-em)]2, 97[thin space (1/6-em)]:[thin space (1/6-em)]3, 96[thin space (1/6-em)]:[thin space (1/6-em)]4 and 95[thin space (1/6-em)]:[thin space (1/6-em)]5 were synthesized and named as PESU, PESUI-1, PESUI-2, PESUI-3, PESUI-4 and PESUI-5, respectively. The molar ratio of –NCO group to –OH group of HO-PES-OH and DEAH was kept at 1[thin space (1/6-em)]:[thin space (1/6-em)]1 for the synthesis of all the samples. The content of hydroxyl group of HO-PES-OH was calculated according to its number average molecular weight obtained by NMR analysis.

2.4 Nuclear magnetic resonance (NMR) spectroscopy

1H NMR spectra of HO-PES-OH, PESU and PESUIs were recorded on a Bruker AC-P 400 MHz spectrometer at ambient temperature in CDCl3 solution with tetramethylsilane as the internal reference.

2.5 Intrinsic viscosity

The intrinsic viscosities of HO-PES-OH, PESU and PESUIs were measured with an Ubbelohde viscometer at a concentration of 0.1% (w/v) in chloroform at 25 °C.

2.6 Thermogravimetric analysis (TGA)

Thermal stabilities of the samples were determined through thermogravimetric analysis. Thermograms were recorded under N2 atmosphere on a NETZSCH TG 209 F1 apparatus from room temperature to 550 °C at a heating rate of 10 °C min−1.

2.7 Differential scanning calorimeter (DSC)

A TA DSC-Q200 differential scanning calorimeter was utilized to study glass transition temperature (Tg), crystallization temperature and enthalpy, and melting temperature and fusion enthalpy of PESU and PESUIs. 5 mg samples in aluminum pans were first melted at 130 °C for 3 min to eliminate any thermal history, and then quenched to −30 °C at a cooling rate of 60 °C min−1; after 3 min the samples were heated to 130 °C at a heating rate of 10 °C min−1, then cooled to −30 °C at a cooling rate of 10 °C min−1, and finally reheated up to 130 °C at the same scanning rate. Corresponding scans were recorded for data analysis. The isothermal crystallization kinetics of PESU and PESUIs also were studied by DSC. Typically, 5 mg samples were quickly heated to 130 °C and held for 3 min to remove thermal history, then quenched to a predetermined crystallization temperature (Tc, varying in a range of 50–80 °C for different samples), then maintained at this temperature until crystallization was complete. The exothermal curves of heat flow versus crystallization time were recorded for isothermal crystallization kinetics analysis.

2.8 Wide angle X-ray diffraction (WAXD)

Wide angle X-ray diffraction patterns were recorded with an X-ray diffractometer (Philips X'Pert X-ray diffractometer) with Cu-Kα radiation. The equipment was operated at room temperature with a scan rate of 2° min−1 scanning from 5 to 40°.

2.9 Polarized optical microscope (POM)

Spherulitic morphology of PESU and PESUIs were studied with a polarized optical microscope (POM) (NIKON ECLIPSE LV100POL) equipped with a hot stage (HSC621V). Sample films were prepared by the casting and evaporation of polymer chloroform solution on microscopic cover glass. The concentration of the solution was 10 mg mL−1. The samples were first melted at 140 °C for 5 min to diminish previous thermal history and subsequently quenched to a predetermined crystallization temperature and maintained at that temperature until the crystallization completed.

2.10 Rheological measurements

Rheological measurements were carried out on a rotational rheometer (Bohlin Gemini 200 instrument) using a heat stream of nitrogen gas for temperature control. Under nitrogen atmosphere, the samples loaded between the 25 mm parallel plates were compressed to 1 mm thickness after melting at 140 °C for 3 min. Then, a frequency sweep for the samples was performed at 140 °C using parallel plates. Angular frequency range was 0.01–100 Hz.

2.11 Tensile testing

The Tensile strength and elongation at break of the samples were measured on a Sansi Universal Testing Machine (CMT, Shenzhen, China) at a crosshead speed of 50 mm min−1 at room temperature. The samples were shaped with a dumbbell-shaped cutter. Sample thickness and width of the specimens were 0.5 mm and 4 mm, respectively. The length of the sample between the two grips of the testing machine was 25 mm. Six measurements were conducted for each sample, and the results were reported as averaged values.

3. Results and discussion

3.1 Synthesis and characterization of poly(ethylene succinate) urethane ionene

PESUI was synthesized through a chain-extension reaction of HO-PES-OH precursors with DEAH in the presence of HDI, as shown in Scheme 1. Therefore, HO-PES-OH had to be synthesized before the synthesis of PESUI. HO-PES-OH was prepared by the condensation polymerization of succinic acid and ethylene glycol with a molar ratio of 1[thin space (1/6-em)]:[thin space (1/6-em)]1.2. Previous studies suggested that when the molar ratio of succinic acid and ethylene glycol was 1[thin space (1/6-em)]:[thin space (1/6-em)]1.2, the obtained PES would be predominantly terminated with hydroxyl groups, and the number average molecular weight (Mn,NMR) of HO-PES-OH calculated by NMR analysis was efficient in determining the amount of chain extender during chain extension.10,11,36 Fig. 1 shows the 1H NMR spectrum of HO-PES-OH and the corresponding assignment of the peaks. The peaks appearing at 2.66 (δHa) and 4.30 (δHb) ppm were assigned to the methylene protons in the repeating units of HO-PES-OH. The shifts of methylene protons connecting with hydroxyl groups and ester bonds at the terminus of the PES chain were seen at 3.82 (δHc) and 4.23 (δHc′) ppm. The Mn,NMR of HO-PES-OH can be calculated from the integral area of the peaks at 2.66 and 3.82 ppm, and it was 5780 g mol−1 in this study.
image file: c4ra05484a-s1.tif
Scheme 1 Route for the synthesis of PESUI.

image file: c4ra05484a-f1.tif
Fig. 1 1H NMR spectrum of HO-PES-OH.

As mentioned in the experimental section, a chain-extension reaction was carried out at 150 °C for an hour to synthesize PESUIs. For property comparison, PESU was synthesized via reaction of HO-PES-OH and HDI. Five PESUI samples with different content of DEAH were synthesized in this work and named as PESUI-1, PESUI-2, PESUI-3, PESUI-4 and PESUI-5, where the number denoted the feed molar content of DEAH. The chemical structure and composition of the synthesized PESU and PESUIs were characterized by NMR. Fig. 2 shows the 1H NMR spectra of PESU and typical PESUI-3. The signals of the terminal methylene protons of HO-PES-OH disappeared after chain extension, suggesting that the chain extension reaction was successfully performed. The two methylene protons in the repeating units of PES were at shifts of 2.66 (δHa) and 4.30 (δHb) ppm, respectively. The three new signals appearing at shifts of 1.34 (δHc), 1.50 (δHd) and 3.16 (δHe) ppm were caused by the three different HDI methylene protons. In addition to the similar characteristic signals to PESU, a new characteristic signal was observed at 3.47 (δHg) ppm for PESUI. The new signal was reasonably assigned to the methylene protons linked with N atom of DEAH residue. Because the other kind of methylene protons of DEAH residue, those linked with urethane group, have a similar chemical environment to those (Hb) of PES, they would share close chemical shifts with Hb, and thus they were not visible.


image file: c4ra05484a-f2.tif
Fig. 2 1H NMR spectra of PESU (A) and typical PESUI-3 (B).

Sample compositions could be calculated by the following equations:

 
image file: c4ra05484a-t1.tif(1)
 
image file: c4ra05484a-t2.tif(2)
 
FHDI = 1 − FPESFDEAH, (3)
where I2.66, I3.16, and I3.47 represent the peak intensities of methylene protons in the repeating units of PES, HDI and DEAH residues, respectively. 144, 170, and 139 are the molecular weights of repeating units of PES, HDI and DEAH moieties, respectively. The composition of the resulting polymer can be calculated from the weight fraction (F) of each component, and the results are shown in Table 1.

Table 1 Composition and molecular weight of PESU and PESUIs
Sample Feeding ratio Composition [η] (dL g−1)
fPES/fDEAH/fHDI FPES/FDEAH/FHDI
PESU 97.18/0/2.82 96.81/0/3.19 0.62
PESUI-1 95.14/0.95/3.91 94.98/0.95/4.07 0.77
PESUI-2 93.18/1.84/4.98 93.59/1.74/4.67 1.08
PESUI-3 91.26/2.72/6.02 91.93/2.72/5.35 2.19
PESUI-4 89.38/3.59/7.02 91.35/3.17/5.48 2.12
PESUI-5 87.53/4.45/8.02 90.31/4.03/5.66 2.02


The intrinsic viscosity [η] of the samples was measured with an Ubbelohde viscometer at a concentration of 0.1% (w/v) in chloroform at 25 °C, as shown in Table 1. The [η] values initially increased and then slightly decreased with increasing urethane ionic group. With the addition of a small amount of DEAH, the small molecular DEAH had higher reactivity than HO-PES-OH with Mn = 5780 g mol−1, thus the molecular weight of the PESUIs could effectively increase, which is one of the reason for the intrinsic viscosity of PESUI to initially increase with increasing DEAH amount. The other reason may be that the existence of the urethane ionic group caused the aggregation of the polymer chains in the solution because of the ionic interaction of the ionic groups of different polymer chains, which would increase intrinsic viscosity. However, when the content of DEAH increased further, the high melt viscosity of the PESUI (Section 3.5) would reduce the mobility of the polymer chains, thus slightly hindering increase in intrinsic viscosity. A good balance between the two effects should be reached with addition of 3 mol% DEAH, and consequently, PESUI-3 showed higher intrinsic viscosity.

3.2 Basic thermal and crystallization behavior of PESU and PESUIs

The effect of urethane ionic group on the thermal stability of PESUIs was characterized by TGA. Fig. 3 shows the TGA curves of PESU and PESUIs. It can be seen that no apparent weight loss took place up to 240 °C for both PESU and PESUIs, indicating that all the samples possessed good thermal stability. For PESU, the onset degradation temperature at the weight loss of 5% (T0.05) was about 296 °C, and the temperature at the maximum mass loss rate (Tmax) was about 387 °C. In cases of PESUIs, all the T0.05 and Tmax were close to that of PESU, around 290–297 °C and 375–390 °C, respectively, suggesting that the incorporation of urethane ionic group apparently did not change the thermal stability.
image file: c4ra05484a-f3.tif
Fig. 3 TGA curves of PESU and PESUIs between 50 and 500 °C at the heating rate of 10 °C min−1 under N2 atmosphere.

It is more interesting to study the effect of urethane ionic group content on the thermal transition of PESUIs. Fig. 4A shows the DSC heating scans of PESU and PESUIs at a heating rate of 10 °C min−1 from the melt-quenched amorphous state. It can be seen that all the samples showed similar glass transition temperature (Tg) at around −8 °C and similar melting temperature (Tm) at around 100 °C, suggesting that the incorporation of urethane ionic group almost did not change the Tg and Tm values of PES. For the effect of urethane ionic group content on the cold crystallization rate (Tcc) of PESUIs, we can see that PESU showed a cold crystallization temperature (Tcc) value at 45.26 °C, Whereas that of PESUIs initially decreased and then increased with increase in urethane ionic group content, and the lowest Tcc was observed for PESUI-4. Tcc values were 42.20, 39.79, 37.32, 35.02, and 37.02 °C for PESUI-1, PESUI-2, PESUI-3, PESUI-4, and PESUI-5, respectively. The results suggest that the overall crystallization rates of PESUIs initially increased and then decreased with the increase in urethane ionic group content, and PESUI-4 had the highest crystallization rates. The values of these parameters are summarized in Table 2. It is worth noting that the fusion enthalpy (ΔHm) of PESU was 47.54 J g−1, which initially increased and then decreased with the increase of urethane ionic group content, which were 49.50, 50.50, 49.72, 48.77, and 42.62 J g−1 for PESUI-1, PESUI-2, PESUI-3, PESUI-4, and PESUI-5, respectively. The incorporation of urethane ionic group should lead to a diluent effect on the crystallization of PESU, which should result in depressed ΔHm, which is proved by comparing the ΔHm values of PESU and PESUI-5. However, when DEAH content was less than 4 mol%, PESUIs showed comparable or even higher ΔHm values compared with PESU. This would have been caused by the improved crystallization rate with the incorporation of urethane ionic group. As indicated above, the crystallization of PESUIs started before PESU due to their lower Tcc. Therefore, PESUIs had more time to crystallize, and thus to reach a higher degree of crystallinity during same crystallization conditions. The cold crystallization enthalpy (ΔHcc) showed a similar variation trend with ΔHm.


image file: c4ra05484a-f4.tif
Fig. 4 DSC heating scans of PESU and PESUIs at a heating rate of 10 °C min−1 from melt-quenched amorphous state (A), DSC cooling (B) and subsequent heating scans (C) of PESU and PESUIs at a scanning rate of 10 °C min−1.
Table 2 Characteristic data of DSC analysis for PESU and PESUIs
Sample Tga (°C) Tcca (°C) ΔHcca (J g−1) Tma (°C) ΔHma (J g−1) Tcb (°C) ΔHcb (J g−1) Xcc (%)
a Obtained from melt-quenched DSC heating scans.b Obtained from cooling scans.c Determined by the deconvolution of WAXD curves.
PESU −8.49 45.26 43.01 98.93 47.54 54.3
PESUI-1 −8.26 42.20 44.23 99.23 49.50 32.83 6.28 50.8
PESUI-2 −8.24 39.79 45.98 99.29 50.50 37.36 9.01 48.7
PESUI-3 −7.69 37.32 41.31 99.64 49.72 49.59 47.30 45.6
PESUI-4 −7.69 35.02 35.01 99.81 48.77 52.21 48.75 45.4
PESUI-5 −8.24 37.02 33.06 99.45 42.62 49.61 41.32 40.0


The effect of urethane ionic group content on the non-isothermal melt crystallization of PESUIs was further investigated by DSC. Fig. 4B shows the DSC cooling curves of PESU and PESUIs at a cooling rate of 10 °C min−1 from their melting state. The values of crystallization temperature (Tc) and crystallization enthalpy (ΔHc) are also shown in Table 2. The crystallization of PESU was not detected during cooling scan, and only cold crystallization was observed in the subsequent heating scan (Fig. 4C). When a small amount of urethane ionic group was incorporated, weak exothermic crystallization peaks with ΔHc of less than 10 J g−1 could be observed for PESUI-1 and PESUI-2, and crystallization finished in the following heating scans. However, when the content of urethane ionic group was further increased, apparent large exothermic crystallization peaks with ΔHc of more than 40 J g−1 were observed for PESUI-3, PESUI-4 and PESUI-5, and no cold crystallization peak could be observed in the subsequent heating scans, suggesting that the crystallization was completed during cooling. Tc values initially increased and then decreased with increasing urethane ionic group content, which were 32.83, 37.36, 49.59, 52.21, and 49.61 °C for PESUI-1, PESUI-2, PESUI-3, PESUI-4 and PESUI-5, respectively, indicating that the melt crystallizability also initially increased and then decreased with increasing urethane ionic group content, and PESUI-4 showed the best melt crystallizability, which is in agreement with the variation trend in the cold crystallizability of the samples, as discussed above. The increased crystallizability of PESUIs was attributed to the improved nucleation effect after the incorporation of urethane ionic groups which could aggregate to form nuclei for the crystallization of PES segments; this was demonstrated in the previous study41 and will be confirmed in detail by POM observation in the following section.

The crystal structure of PESU and PESUIs was characterized by WAXD. Fig. 5 shows the WAXD patterns of PESU and PESUIs that are isothermally crystallized at 70 °C for 48 h. Three main diffraction peaks for PESU were observed at about 20.1°, 22.7°, and 23.2°, corresponding to the (021), (121), and (200) planes, respectively. All the PESUIs with different urethane ionic group contents showed similar diffraction peaks at almost the same locations as PESU, suggesting that the incorporation of urethane ionic group did not apparently affect the crystal structure of PESU. The degree of crystallinity of PESU and of PESUIs was determined through the deconvolution of crystalline and amorphous peaks in the WAXD pattern using the peak separation software,36 and the values, as shown in Table 2, were 54.3%, 50.8%, 48.7%, 45.6%, 45.4%, and 40.0% for PESU, PESUI-1, PESUI-2, PESUI-3, PESUI-4, and PESUI-5, respectively. The results indicate that the incorporation of urethane ionic group did not change the crystal structure but decreased the Xc of PESU due to the diluent effect.


image file: c4ra05484a-f5.tif
Fig. 5 WAXD patterns of PESU and PESUIs.

3.3 Isothermal crystallization kinetics of PESU and PESUIs

To thoroughly study the effect of urethane ionic group on the crystallization behavior of PESUIs, the isothermal crystallization kinetics of PESUIs was investigated by DSC and compared with that of PESU. Fig. 6A shows the development of relative crystallinity (Xt) with crystallization time (t) at temperatures of 65–80 °C for typical PESUI-4. Xt was calculated by the integration of the exothermic peak during isothermal process according to the equation
 
image file: c4ra05484a-t3.tif(4)
where Qt and Q are the total releasing heat at crystallization time t and at the end of crystallization, respectively, and the term dHc(t)/dt represents the heat flow at crystallization time t. The time needed for completing the crystallization increased when crystallization temperature increased, indicating that crystallization is retarded with increasing temperature. The development of Xt with t for PESU and other PESUIs showed a similar phenomenon with increasing crystallization temperature; for brevity, the plots are not shown in this study. It is of more importance to investigate the effect of urethane ionic group content on the isothermal crystallization kinetics of PESUIs. Fig. 6B shows the development of Xt with t for PESU and PESUIs at temperature of 70 °C. It can be seen that the time required to complete crystallization were 73.8, 42.4, 33.3, 8.4, 7.2, and 8.3 min for PESU, PESUI-1, PESUI-2, PESUI-3, PESUI-4 and PESUI-5, respectively, suggesting the time needed for PESUIs to complete crystallization was considerably shorter than that of PESU at a given crystallization temperature. In particular, when the content of urethane ionic group was over 3 mol%, the crystallization of PESUIs was almost 10 times faster than PESU, which means that the content of urethane ionic group played a very important role in the crystallization behavior of PESUIs.

image file: c4ra05484a-f6.tif
Fig. 6 (A) Development of relative crystallinity with crystallization time at different crystallization temperatures for PESUI-4; (B) development of relative crystallinity with crystallization time at 70 °C for PESU and PESUIs; (C) Avrami plots of PESUI-4 at different crystallization temperatures; and (D) Avrami plots of PESU and PESUIs at 70 °C.

The well-known Avrami equation was used to analyze the isothermal crystallization kinetics of PESU and PESUIs. The equation assumes that relative crystallinity develops with crystallization time as

 
1 − Xt = exp(−ktn) (5)
where Xt is relative crystallinity at time t, k is a crystallization rate constant depending on nucleation and crystalline growth rate, and n is the Avrami exponent, which denotes the nature of the nucleation and growth process.42 Eqn (5) can be rewritten as
 
log[−ln(1 − Xt)] = log[thin space (1/6-em)]k + nlog[thin space (1/6-em)]t. (6)

A plot of log[−ln(1 − Xt)] versus log[thin space (1/6-em)]t would give a straight line from which both the rate constant and the Avrami exponent can be derived. Fig. 6C shows the Avrami plots of a typical PESUI-4 at a crystallization temperature of 65–80 °C. A series of parallel straight lines were obtained for all the temperatures, similar straight lines were also obtained for other samples at different temperatures, indicating the Avrami equation is suitable for treatment of the isothermal crystallization kinetics of the samples. Fig. 6D shows the Avrami plots of PESU and PESUIs at a crystallization temperature of 70 °C; a series of straight lines were also obtained, suggesting that PESU and PESUIs may show the same crystallization mechanism.

The Avrami parameters n and k are summarized in Table 3. It is obvious that the values of n slightly varied between 2.3 and 2.9 for PESU and the five PESUIs within the temperature range involved in this study, suggesting that the crystallization kinetics of PESU and PESUIs might correspond to three-dimensional truncated spherulitic growth with a thermal nucleation,43 and the incorporation of urethane ionic group did not change the crystallization mechanism but it changed the crystallization rate of the samples.

Table 3 Isothermal crystallization kinetics parameters of PESU and PESUIs
Sample Tc (°C) n k × 10−3 (min−1) Sample Tc (°C) n k × 10−3 (min−1)
PESU 55 2.56 4.96 PESUI-3 65 2.41 170
60 2.66 1.37 70 2.44 44.8
65 2.77 0.28 75 2.55 7.30
70 2.67 0.08 80 2.93 0.24
PESUI-1 55 2.76 9.44 PESUI-4 65 2.29 313
60 2.75 4.52 70 2.36 75.2
65 2.70 1.51 75 2.67 7.74
70 2.72 0.30 80 2.53 1.51
PESUI-2 55 2.74 14.1 PESUI-5 65 2.34 200
60 2.64 8.36 70 2.55 46.2
65 2.55 3.46 75 2.83 4.18
70 2.55 1.19 80 2.92 0.18


Because the values of n are different for different samples, it is inappropriate to directly compare the overall crystallization rates of PESU with PESUIs from the values of rate constants. The half-time of crystallization (t0.5), defined as the time needed to achieve 50% of the final crystallinity, is thus calculated to describe isothermal crystallization kinetics. The value of t0.5 can be deduced from the following equation:

 
image file: c4ra05484a-t4.tif(7)

The reciprocal value of t0.5, i.e., 1/t0.5, is usually employed to represent the overall crystallization rates of polymers. According to the values of n and k, the values of 1/t0.5 were calculated and graphically shown in Fig. 7.


image file: c4ra05484a-f7.tif
Fig. 7 Composition dependence of 1/t0.5 for the samples under different crystallization temperatures.

It can be seen that the values of 1/t0.5 decreased with increasing Tc for all the samples, indicating that the overall crystallization rates of all the samples decreased with an increase in Tc. At a given Tc, all the PESUIs showed a higher 1/t0.5 value than PESU, and the values of 1/t0.5 initially increased and then decreased with increase in urethane ionic group content, and the highest value of 1/t0.5 was reached for PESUI-4, suggesting that the overall crystallization rates of PESUIs were faster than PESU and initially increased and then decreased with increasing urethane ionic group content, and that when 4 mol% DEAH was incorporated, the PESUI-4 showed the fastest crystallization rate.

The fact that the incorporation of urethane ionic group could significantly improve the crystallization rate of PESU appears to be unreasonable because the incorporation of urethane ionic group would not only lead to a diluent effect for the crystallization of polymer but it would also decrease polymer chain regularity; both aspects would reduce the crystal growth rate of semi-crystalline polymers. It is well known that crystallization rate is dependent on both nucleation efficiency and crystal growth rate. Due to the increasing diluent effect and decreasing polymer chain regularity by the incorporation and increase in the content of urethane ionic group, we can appropriately suppose that the crystal growth rate of the samples should gradually decrease with increasing urethane ionic group content. Therefore, the reason for the improvement in the crystallization rates of PESUIs can only be attributed to the possible improved nucleation efficiency. To prove this hypothesis, the crystallization morphologies of PESU and PESUIs were observed by POM.

3.4 Spherulitic morphology and growth of PESU and PESUIs

Fig. 8 shows a series of the POM images of typical PESUI-4 spherulites formed in a wide temperature range of 60–85 °C. It can be seen that the spherulites showed the characteristic Maltese cross extinction pattern, regardless of Tc; the size of spherulites became larger with increasing Tc, and that the number of spherulites apparently reduced with increasing Tc. The results suggest that the nucleation density of PESUI-4 became smaller at higher Tc. The spherulitic morphologies of other samples showed a similar phenomenon; they are not shown for brevity.
image file: c4ra05484a-f8.tif
Fig. 8 Spherulitic morphology of PESUI-4 isothermally crystallized at different temperatures.

It is more valuable to study the effect of urethane ionic content on the spherulitic morphologies of PESUIs. Fig. 9 shows the POM images of PESU and the five PESUIs spherulites formed at a crystallization temperature of 70 °C. All the samples showed compact spherulites irrespective of composition. However, the size of the spherulites gradually decreased, while the number of nucleation sites increased with an increase in ionic group content. When the content of DEAH increased from 2 mol% to 3 mol%, a dramatic increase in the number of nuclei was observed for PESUI-3, which is in agreement with the variation of the overall crystallization rate of PESUIs versus urethane ionic group, as discussed in the above section. The results proved our hypothesis that the improved crystallization rates of PESUIs were attributed to the improved nucleation efficiency by the incorporation of urethane ionic group, which tended to aggregate to form nucleation sites to initiate the crystallization of PES molecular chain in PESUI. Although nucleation efficiency gradually increased with the content of urethane ionic group, the overall crystallization rate of PESUI did not always increase but rather initially increased and then decreased with increasing urethane ionic group content, as discussed in the section on isothermal crystallization kinetics. The results may be explained by the decreasing crystal growth rate of the samples with increasing urethane ionic group content due to the diluent effect and the increasing disturbance of polymer chain regularity.


image file: c4ra05484a-f9.tif
Fig. 9 Spherulitic morphology of PESU and PESUIs formed at crystallization temperature of 70 °C.

Spherulitic growth rate (G) was measured by the increase of spherulite radius with time, as shown in Fig. 10. The values of G were obtained from the slopes of the plots of spherulite radius versus crystallization time. The G value of PESU at 70 °C was 0.166 μm s−1, which gradually decreased to 0.164, 0.159, 0.147, 0.143, and 0.140 μm s−1 for PESUI-1, PESUI-2, PESUI-3, PESUI-4, and PESUI-5, respectively. We could see that they showed a decreasing trend with increasing urethane ionic group content. From the above discussion, we can conclude that the urethane ionic group has two opposite effects on the crystallization of PESUI, i.e., a positive effect of nucleation and a negative effect of decreasing crystal growth rate, and we can conclude that the optimum balance of the two effects was reached when 4 mol% DEAH was incorporated because PESUI-4 showed the fastest overall crystallization rate.


image file: c4ra05484a-f10.tif
Fig. 10 Spherulitic growth rate calculation for PESU and PESUIs at 70 °C.

3.5 Rheological properties of PESUIs and PESU

Generally, ionic groups have a significant influence on the rheological behavior of polymer because the strong physical cross-linkage by electrostatic attractive forces between ionic groups. Therefore, rheological measurements were carried out to study the effect of urethane ionic group content on the rheological properties of PESUIS. Fig. 11A shows the complex viscosities of PESUIs and PESU. From this figure, it is apparent that the ionic groups had a significant influence on the complex viscosity over the entire frequency range studied. Shear thinning behavior existed for all the samples, but the shear thinning of PESUIs started at lower frequency than that of PESU; in particular, no Newtonian-plateau was observed for PESUI-3, PESUI-4, and PESUI-5 at low frequency, which can be attributed to the long relaxation time of the polymer. Simultaneously, PESUIs exhibited a higher complex viscosity than PESU, and the complex viscosity of PESUIs increased first and then decreased with increase in urethane ionic group content. Especially, when the content of DEAH increased from 2 mol% to 3 mol%, a dramatic increase in complex viscosity occurred. The maximum complex viscosity was observed for PESUI-4 with DEAH further increased to 4 mol%. The results were probably related to the strong physical cross-linkage by electrostatic attractive forces between ionic groups. On one hand, the ionic groups of PESUIs may form sufficient physical cross-linkage with each other, and the number of physical cross-linkages increased with increase in the ionic group content up to 4 mol%. However, on the other hand, the complex viscosity of PESUI-5 was lower than that of PESUI-3 or PESUI-4, which may have been due to the reverse effect of physical cross-linkage resulting from preferential intramolecular ion-pair associations. Intramolecular ion-pair association led to the collapse of the polymer chain, which may have caused the reduction of the viscosity.44 Furthermore, the extent of shear thinning was increased with increase in ionic group content; thus, at high frequency, PESUI-4 exhibited a lower viscosity than PESUI-3. Other properties such as storage modulus (G′) were also influenced by ionic groups. Fig. 11B shows storage modulus G′ plotted as a function of frequency at a reference temperature of 140 °C for all the samples. The phenomenon of G′ is similar to complex viscosity. The storage modulus increased as the ionic group content increased up to 4 mol% at low frequency, and at high frequency, the storage modulus of PESUI-3 was slightly higher than that of PESUI-4. The reason for this phenomenon was the same as for the complex viscosity.
image file: c4ra05484a-f11.tif
Fig. 11 Complex viscosities versus angle frequency (A) and storage modulus versus angle frequency (B) of PESU and PESUIs at 140 °C.

3.6 Tensile properties

Mechanical properties are very important for the practical application of materials. In this study, the tensile properties of PESU and PESUIs were investigated, and the results of tensile testing are summarized in Table 4. The break strength of all the samples was around 23 MPa, suggesting that the incorporation of urethane almost did not change the tensile strength of the polymers. The elongation at the break of the sample gradually increased with the increase of urethane ionic group, which should have resulted from the gradually decreased degree of crystallinity due to the increase of urethane ionic group. The Young's modulus of the samples stayed approximately constant when the content of urethane ionic group increased to 2 mol%, and then decreased with the further increasing of urethane ionic group. Urethane ionic group was supposed to play two opposite roles in the Young's modulus. The interaction between the polymer chains would increase with increasing urethane ionic group, which played a positive effect, while the degree of crystallinity of the polymers gradually decreased with increasing urethane ionic group, which played a negative effect. When a small amount urethane ionic group was incorporated, the positive effect of ionic groups on Young's modulus was cancelled by the reduced crystallinity, while when the amount of urethane ionic group increased to a higher content, the negative effect dominated due to the further decreasing crystallinity, and thus the Young's modulus gradually decreased.
Table 4 Tensile properties of PESU and PESUIs
Sample Break strength (MPa) Elongation at break (%) Young's modulus (MPa)
PESU 23.9 ± 0.9 347 ± 10 457.5 ± 5.4
PESUI-1 23.9 ± 0.4 349 ± 9 478.2 ± 14.5
PESUI-2 22.7 ± 0.5 367 ± 10 466.5 ± 10.2
PESUI-3 23.9 ± 1.5 415 ± 48 430.7 ± 30.9
PESUI-4 22.5 ± 1.1 396 ± 34 433.1 ± 15.4
PESUI-5 23.8 ± 1.3 445 ± 40 408.8 ± 17.9


4. Conclusions

In summary, poly(ethylene succinate) urethane ionenes were successfully synthesized by the chain extension of dihydroxyl-terminated PES with DEAH using aliphatic 1,6-hexamethylene diisocyanate as a chain extender, and their chemical structures and physical properties were thoroughly investigated. The study shows that the incorporation of urethane ionic group did not apparently change the thermal stability, tensile properties, or crystal structure of PESU. However, the degree of crystallinity of PESUIs decreased with the increase of ionic group content. DSC results suggest that the crystallizability of PESUIs increased first and then decreased with increase in urethane ionic group content. The isothermal crystallization kinetics investigation suggested that the crystallization rate of PESUIs was faster than that of PESU at a given temperature, and the crystallization rate of PESUI-4 is the fastest, while the crystallization mechanism was unchanged. In addition, POM observation indicated that urethane ionic group has two opposite effects on the crystallization of PESUIs: a positive effect of nucleation and a negative effect of decreasing crystal growth rate. When 4 mol% DEAH was incorporated, PESUI-4 showed the faster crystallization rate due to the best balance of the two effects. Urethane ionic group plays an important role in the rheological behaviour of PESUIs. Both complex viscosity and storage modulus increased first and then decreased with increase in urethane ionic group content, and the maximum values for both the parameters were observed for PESUI-4. The tensile properties of PESUIs were also studied; the break strength of all the samples was around 23 MPa, the elongation at break of the sample gradually increased with increase of urethane ionic group, and the Young's modulus stayed approximately constant when the content of urethane ionic group increased to 2 mol% and then decreased with further increasing urethane ionic group content.

Acknowledgements

This work was supported by the National Science Foundation of China (51373107 and 51121001) and the Specialized Research Fund for the Doctoral Program of Higher Education (20110181130008).

References

  1. T. Fujimaki, Polym. Degrad. Stab., 1998, 59, 209–214 CrossRef CAS.
  2. R. W. Lenz and R. H. Marchessault, Biomacromolecules, 2005, 6, 1–8 CrossRef CAS PubMed.
  3. L. T. Lim, R. Auras and M. Rubino, Prog. Polym. Sci., 2008, 33, 820–852 CrossRef CAS PubMed.
  4. J. Xu and B. H. Guo, Biotechnol. J., 2010, 5, 1149–1163 CrossRef CAS PubMed.
  5. Y. S. He, J. B. Zeng, G. C. Liu, Q. T. Li and Y. Z. Wang, RSC Adv., 2014, 4, 12857–12866 RSC.
  6. Z. Qiu and W. Guan, RSC Adv., 2014, 4, 9463–9470 RSC.
  7. G. C. Liu, Y. S. He, J. B. Zeng, Y. Xu and Y. Z. Wang, Polym. Chem., 2014, 5, 2530–2539 RSC.
  8. B. Jeong, Y. H. Bae, D. S. Lee and S. W. Kim, Nature, 1997, 388, 860–862 CrossRef CAS PubMed.
  9. H. Y. Wang, J. H. Ji, W. Zhang, Y. H. Zhang, J. Jiang, Z. W. Wu, S. H. Pu and P. K. Chu, Acta Biomater., 2009, 5, 279–287 CrossRef CAS PubMed.
  10. C. Liu, J. B. Zeng, S. L. Li, Y. S. He and Y. Z. Wang, Polymer, 2012, 53, 481–489 CrossRef CAS PubMed.
  11. J. B. Zeng, Y. D. Li, Q. Y. Zhu, K. K. Yang, X. L. Wang and Y. Z. Wang, Polymer, 2009, 50, 1178–1186 CrossRef CAS PubMed.
  12. H. F. Sun, L. Mei, C. X. Song, X. M. Cui and P. Y. Wang, Biomaterials, 2006, 27, 1735–1740 CrossRef CAS PubMed.
  13. W. Suntornsuk and Y. D. Hang, Lett. Appl. Microbiol., 1994, 19, 249–252 CrossRef CAS PubMed.
  14. M. Okada, Prog. Polym. Sci., 2002, 27, 87–133 CrossRef CAS.
  15. A. P. Andrade, B. Withoit, D. L. Chang and Z. Li, Macromolecules, 2003, 36, 9830–9835 CrossRef CAS.
  16. Y. Tachibana, T. Masuda, M. Funabashi and M. Kunioka, Biomacromolecules, 2010, 11, 2760–2765 CrossRef CAS PubMed.
  17. M. Zhou, J. Yan, Y. Li, C. Geng, C. He, K. Wang and Q. Fu, RSC Adv., 2013, 3, 26418–26426 RSC.
  18. Y. Inoue and N. Yoshie, Prog. Polym. Sci., 1992, 17, 571–610 CrossRef CAS.
  19. Y. Doi and A. Steinbüchel, Biopolymers, Polyesters III—Applications and Commercial Products, Wiley-VCH, Weinheim, Germany, 2002, vol. 4, ch. 10 Search PubMed.
  20. K. Chrissafis and K. Paraskevopoulos, Thermochim. Acta, 2005, 435, 142–150 CrossRef CAS PubMed.
  21. M. Chen, W. C. Chang, H. Y. Lu, C. H. Chen, J. S. Peng and C. J. Tsai, Polymer, 2007, 48, 5408–5416 CrossRef CAS PubMed.
  22. Z. Gan, H. Abe and Y. Doi, Biomacromolecules, 2000, 1, 704–712 CrossRef CAS.
  23. Z. Gan, H. Abe and Y. Doi, Biomacromolecules, 2000, 1, 713–720 CrossRef CAS.
  24. H. Huang, L. Chang and E. M. Woo, Macromol. Chem. Phys., 2011, 212, 1155–1164 CrossRef.
  25. G. Z. Papageorgiou and D. N. Bikiaris, Polymer, 2005, 46, 12081–12092 CrossRef CAS PubMed.
  26. G. Z. Papageorgiou, D. S. Achilias and D. N. Bikiaris, Macromol. Chem. Phys., 2007, 208, 1250–1254 CrossRef CAS.
  27. Z. Qiu, T. Ikehara and T. Nishi, Polymer, 2003, 44, 5429–5437 CrossRef CAS.
  28. Z. Qiu, M. Komura, T. Ikehara and T. Nishi, Polymer, 2003, 44, 7781–7785 CrossRef CAS PubMed.
  29. T. Iwata, Y. Dio, K. Isono and Y. Yoshida, Macromolecules, 2001, 34, 7343–7348 CrossRef CAS.
  30. Y. S. He, J. B. Zeng, S. L. Li and Y. Z. Wang, Thermochim. Acta, 2012, 529, 80–86 CrossRef CAS PubMed.
  31. S. S. Ray and M. E. Makhatha, Polymer, 2009, 50, 4635–4643 CrossRef PubMed.
  32. H. Y. Lu, M. Chen, C. H. Chen, J. S. Lu, K. C. Hoang and M. Tseng, J. Appl. Polym. Sci., 2010, 116, 3693–3701 CAS.
  33. J. B. Zeng, Q. Y. Zhu, Y. D. Li, Z. C. Qiu and Y. Z. Wang, J. Phys. Chem. B, 2010, 114, 14827–14833 CrossRef CAS PubMed.
  34. Y. Yang and Z. Qiu, J. Appl. Polym. Sci., 2011, 122, 105–111 CrossRef CAS.
  35. Y. Yang and Z. Qiu, CrystEngComm, 2011, 13, 2408–2417 RSC.
  36. Q. Y. Zhu, Y. S. He, J. B. Zeng, Q. Huang and Y. Z. Wang, Mater. Chem. Phys., 2011, 130, 943–949 CrossRef CAS PubMed.
  37. S. Zhu, Y. Zhao and Z. Qiu, Thermochim. Acta, 2011, 517, 74–80 CrossRef CAS PubMed.
  38. J. B. Zeng, Q. Y. Zhu, X. Lu, Y. S. He and Y. Z. Wang, Polym. Chem., 2012, 3, 399–408 RSC.
  39. Z. Gan, H. Abe and Y. Doi, Biomacromolecules, 2001, 2, 313–321 CrossRef CAS PubMed.
  40. M. Mochizuki, K. Mukai, K. Yamada, N. Ichise, S. Murase and Y. Iwaya, Macromolecules, 1997, 30, 7403–7407 CrossRef CAS.
  41. J. B. Zeng, F. Wu, C. L. Huang, Y. S. He and Y. Z. Wang, ACS Macro Lett., 2012, 1, 965–968 CrossRef CAS.
  42. M. Avrami, J. Chem. Phys., 1939, 7, 1103–1112 CrossRef CAS PubMed.
  43. B. Wunderlich, Macromolecular Physics, Academic Press, New York, 1976, vol. 2 Search PubMed.
  44. R. D. Lundberg and R. R. Philips, J. Polym. Sci., Polym. Phys. Ed., 1982, 20, 1143–1154 CrossRef CAS.

This journal is © The Royal Society of Chemistry 2014
Click here to see how this site uses Cookies. View our privacy policy here.