
Comparative study of optical, structural and electrical properties of zinc phthalocyanine Langmuir–Blodgett thin film on annealing
Dhrubojyoti Roy*a,
Nayan Mani Dasa,
Nanda Shaktib and
P. S. Guptaa
aDepartment of Applied Physics, Nanoscience and Thin Film Laboratory, Indian School of Mines, Dhanbad-826004, India. E-mail: dhrubojyoti27@gmail.com; Fax: +91-3262296563; Tel: +91-8292190838
bDepartment of Physics, Indian Institute of Technology Delhi, New Delhi-110002, India
First published on 22nd August 2014
Abstract
Zinc phthalocyanine (ZnPc) in the mixture of N-methyl pyrroldione (NMP) and chloroform (CHCl3) [1![[thin space (1/6-em)]](https://www.rsc.org/images/entities/char_2009.gif) :10 (v/v)] spreading solvent was observed to have only a monomeric absorption peak. However, on processing the solution into a thin film using the Langmuir–Blodgett (LB) technique, it shows absorption peaks corresponding to H, J and monomer aggregates, as confirmed by UV-Vis absorption spectroscopy. The Q-band absorption spectra of ZnPc LB thin film was observed to have a sharp change on annealing at 65 °C, indicating a change in the aggregation configuration of molecules over the surface. The annealed ZnPc LB thin film is found to have H and monomer aggregates only, which indicates that ZnPc molecules are arranged in an edge on face-to-face conformation. The ZnPc LB thin film remains in this aggregation until the higher annealing temperature. The ZnPc LB thin film shows an α-phase characteristic when annealed at 65 °C, and it remains intact in this phase up to 200 °C. The α–β phase transformation starts occurring from 200 °C and is completed at 290 °C. The large increase in crystallite size, as obtained from the XRD study, and the change in the shape of the ZnPc nanoparticles from spherical to nanorod structure, as observed from FESEM and AFM images, confirms the transformation of the ZnPc film from metastable α phase to stable β phase. Electrical conductivity is found to be enhanced considerably for β-phase with respect to α-phase in dark and under photoexcitation because of better charge carrier transport.
:10 (v/v)] spreading solvent was observed to have only a monomeric absorption peak. However, on processing the solution into a thin film using the Langmuir–Blodgett (LB) technique, it shows absorption peaks corresponding to H, J and monomer aggregates, as confirmed by UV-Vis absorption spectroscopy. The Q-band absorption spectra of ZnPc LB thin film was observed to have a sharp change on annealing at 65 °C, indicating a change in the aggregation configuration of molecules over the surface. The annealed ZnPc LB thin film is found to have H and monomer aggregates only, which indicates that ZnPc molecules are arranged in an edge on face-to-face conformation. The ZnPc LB thin film remains in this aggregation until the higher annealing temperature. The ZnPc LB thin film shows an α-phase characteristic when annealed at 65 °C, and it remains intact in this phase up to 200 °C. The α–β phase transformation starts occurring from 200 °C and is completed at 290 °C. The large increase in crystallite size, as obtained from the XRD study, and the change in the shape of the ZnPc nanoparticles from spherical to nanorod structure, as observed from FESEM and AFM images, confirms the transformation of the ZnPc film from metastable α phase to stable β phase. Electrical conductivity is found to be enhanced considerably for β-phase with respect to α-phase in dark and under photoexcitation because of better charge carrier transport.
Introduction
In organic electronic devices, the structural integrity and uniformity of the organic active layer on different interfaces is highly desirable for optimum device performance.1 The control of the preferential orientation of the π-stacking direction in a thin film, i.e. the direction of favorable charge transport in conjugated materials, is essential to improve transport performances in devices such as organic field effect transistors (OFETs) and organic solar cells.2 Among the organic semiconductors, the metallophthalocyanines (MPcs) have attracted significant interest because of their high thermal and chemical stability, high molecular symmetry, and favorable optical properties3 combined with unique electronic properties. MPcs consisting of a central metallic atom bound to π conjugated ligand and the chemical structure of these materials has a similarity with biological molecules such as chlorophyll and hemoglobin. Among the MPcs molecules, the zinc phthalocyanine (ZnPc) has been used largely because of its semiconductor property and high absorption coefficient (peak value of 1.5 × 105 cm−1) in the wavelength range of 600–750 nm, and is a popular candidate for small molecules organic solar cells.4–6To tailor these materials for applications in efficient devices, it is important to have proper knowledge regarding the crystallinity and morphology of their thin films, their optical property and transport properties. This makes it necessary to understand the emergence of aggregation behavior of the molecules and polymorphism in thin films of these macrocyclic π-conjugated materials because it directly impacts device performances. The growth of organic molecules depends on the interaction of the molecules with different types of surfaces.7 The weakly interacting substrates have small surface free energy (mainly oxides such as SiO2, glass, Al2O3 and polymeric substrate), which preferentially favor the upright standing growth of planar and nearly linear extended molecules for thin film deposition because the van der Waals and π–π interaction with neighbours is energetically preferred over the molecule–substrate interaction.8 Similarly, on strongly interacting metallic surfaces, the organic molecules adopt a flat lying molecular orientation.9
Supramolecular self-assembly is a very useful technique to fabricate molecular materials10 to investigate properties such as electrical conductivity and sensing. Phthalocyanine molecules have a tendency of self-aggregation to form dimers and higher order aggregates in solution and at the solid–liquid interface11 due to π-stacking, hydrogen bond and electrostatic attractive forces between the molecules. The spectral shift in the absorption spectrum occurs due to their self assembly, as explained by the molecular exciton theory proposed by Kasha.12–14 The bathochromic shift (red shift) corresponding to J-aggregates having edge to edge stacking of the molecules and the hypsochromic shift (blue shift) corresponding to the H-aggregates having face to face stacking of the molecules are explained by molecular exciton coupling theory, i.e. coupling of the transition moments of the constituent dye molecules.
It is well-known that Pcs containing divalent first-transition metals exhibit different polymorphic forms, especially α and β forms when deposited on a weakly interacting substrate, which are both characterized by herringbone structure with molecules stacked along the b axis.15 The α–β phase transformation is achieved in thin films by thermal annealing, solvent vapor annealing, or by controlling substrate temperature during deposition.16–19 The α phase is differentiated from the β phase by their structure, surface morphology, optical properties and electronic properties. Here, we selected the Langmuir–Blodgett (LB) technique for the preparation of ZnPc thin film. Langmuir–Blodgett technique offers an excellent method for constructing supramolecular assemblies or ultrathin organized molecular films of functional materials. By using this technique not only the molecular orientation but the molecular arrangement and the aggregation can also be improvised in a 2D manner. Mainly substituted Pc compounds were employed as sample materials because of their good solubility in organic solvents such as chloroform and benzene. However, some unsubstituted Pcs are soluble in appropriate mixtures of strong organic acids and organic solvents. The present work deals with the multilayer thin film of unsubstituted zinc phthalocyanine (ZnPc) prepared from a solution of ZnPc in a mixed solvent of N-methyl pyrroldione (NMP) and chloroform (CHCl3).
The molecular architecture and crystallinity of LB deposited thin film was determined by growth at the nanometer scale using X-ray diffraction and UV-Vis absorption spectroscopy. The surface morphology of the films was examined by atomic force microscopy and scanning electron microscopy. The electrical photoconductivity measurements of the films were also carried out.
Experimental details
Preparation of thin films
The Langmuir–Blodgett (LB) films were prepared using a Langmuir trough (Apex Instruments Co.) with a calibrated Wilhelmy plate balance. The LB trough was filled with Milli-Q water at pH ∼ 6.0, kept undisturbed for about 16 hours, and then the water surface was cleaned repeatedly until the surface pressure was π ∼ 0 mN m−1. ZnPc (Sigma-Aldrich) was used as received. The molecular structure of ZnPc is shown in Fig. 1. The spreading solution was prepared by dissolving the ZnPc at a concentration of 1 mg ml−1 into a mixture of N-methyl pyrroldione (NMP) and chloroform (CHCl3, Merck, Analytical Reagent) [1:10 (v/v)] solvent. Then, 200 μl of solution was spread using a microliter syringe and kept undisturbed for 20 min to allow the evaporation of solvent. Then, surface pressure–molecular area (π–A) isotherm was recorded by compressing the spread monolayer over water surface at a rate of 5 mm min−1 until surface pressure was π ∼ 35 mN m−1. The spreading monolayer film was then transferred onto solid substrates using the vertical dipping method at a surface pressure of π ∼ 35 mN m−1, where a compact Langmuir film was formed. Here, the LB film deposition was performed at 27 °C and at a 4 mm min−1 dipping speed for subsequent up-down strokes of substrate through the air–water interface. Drying time for first up stroke was maintained at 20 min and then for each subsequent upstroke i.e. above subphase was maintained at 10 min and similarly for downstroke i.e. below subphase it was 5 min. Hence, we deposited a multilayer film of 40 layers ZnPc using the above mentioned procedure. Quartz slides are used as solid substrate for UV-Vis measurements. Glass slides are used as solid substrate for AFM, SEM, XRD and XPS measurements, and ITO substrate was used for I–V measurements both in the dark and under light.
 | ||
| Fig. 1 (A) Surface pressure–molecular area (π–A) isotherm of the spreading monolayer of the ZnPc over the Milli-Q water surface at 25 °C, (B) molecular arrangement of ZnPc molecules over the glass substrate with an average tilt angle (θ) of 64.3° w.r.t. substrate surface. Φ is the tilt angle of the molecules within the columns corresponding to α and β phase having Φ = 26.5 and 46.8, respectively. | ||
Characterization techniques
Optical absorption was recorded with a PerkinElmer (Model Lamda 950) UV-Vis-NIR spectrophotometer. The structural evaluation of the films was carried out by X-ray diffraction measurements using a Bruker D8 Advance X-ray diffractometer, which uses Cu-Kα radiation (λ = 1.543 Å) and a fast counting detector based on silicon strip technology (Bruker Lynx Eye detector). For the chemical analysis of the LB film, XPS measurement was performed with an Omnicorn Multiprobe spectrometer fitted with an EA 125 hemispherical analyser and a monochromatized Al Kα (1486.6 eV) source. All the data are collected at 40 eV pass energy with analyser angular acceptance of ±1°. Atomic force microscope (Digital Instruments Nanoscope-IV, with Si3N4 100 μm cantilever, 0.56 N m−1 force constant) study was used to observe the morphological and structural details in contact mode. FESEM (model: Supra 55, Germany, operating voltage 1 kV and 2 kV) was used to record scanning electron micrograph images of ZnPc LB thin films. I–V dc measurements were carried out using Keithley 2400 equipment for ZnPc LB film deposited onto ITO coated glass substrate to determine its conductivity at each phase. To investigate the photoconductivity of the LB films, they were illuminated with a halogen lamp of 100 mW cm−2.Results and discussion
π–A isotherm of ZnPc
The Langmuir–Blodgett (LB) films were prepared using a Langmuir trough (Apex Instruments Co.). The surface pressure–molecular area (π–A) isotherm of ZnPc monolayer spread over water surface at 25 °C is shown in Fig. 1(a). It was found that the compound formed a stable floating film at the air–water interface. The isotherm shows the onset of surface pressure, when the ZnPc molecules attain an area of 93 Å2 per molecule in the monolayer. On compression, the surface pressure increases gradually to 10 mN m−1, and after this point it increases rapidly, which shows the formation of the solid monolayer. An inflection point is observed at 19 mN m−1, which may be an indication of reorientation or some kind of phase change of ZnPc molecules. The limiting area per molecule of ZnPc was estimated to be 41.0 Å2 per molecule from the surface pressure–area isotherm.20 This value is useful for estimating the configuration of ZnPc molecules at the air–water interface. ZnPc molecules have a planar geometry with square type structure (Fig. 1(b)). Its side length is 9.7 Å and its diagonal length is 13.7 Å.21 If the molecules of ZnPc are densely stacked in a face-to-face orientation and edge-on to the water surface, the average area per molecule would be approximately 33.0 Å2 (9.7 Å × 3.4 Å), assuming that the “thickness” of the ZnPc is 3.4 Å.22 However, if the molecules of ZnPc are laid down flat on the water surface, the average area per molecule would be approximately 94.4 Å2 (9.7 Å × 9.7 Å). The limiting area per molecule calculated from the isotherm of ZnPc molecule is 41.0 Å2, which is in between the area per molecule in edge-on and flat lying configuration. Therefore, it is reasonable to consider that on an average the ZnPc molecules are in a tilted arrangement over water surface in the monolayer. The average tilt angle was found to be 64.3° w.r.t. water surface. We can consider that the ZnPc molecules are deposited over the glass substrate in the same particular arrangement as in the monolayer over the water surface because of weak interacting property of glass substrate. The schematic model of structural arrangement of ZnPc molecules over the glass substrate is shown in Fig. 1(b).UV-Vis spectroscopy study
The UV-Vis absorption spectra has been used as a tool to investigate the possible aggregation of the ZnPc molecules in the as-deposited film deposited at a surface pressure of 35 mN m−1 and when the film annealed at a different temperature. To have a better understanding of the aggregation of the ZnPc molecules in the LB film over the substrate, we investigated the absorption spectra of ZnPc in solvent having [1:10] NMP and CHCl3, as shown in Fig. 2(a). Fig. 2(b) represents the absorption spectra of the as-deposited 40 L ZnPc LB film. The absorption spectrum for ZnPc in the solvent of NMP and CHCl3 and the as-deposited thin film consists of Q, B, N and C bands, which are typical features of metallophthalocyanine. The B band (or Soret band) with a peak at 360 nm and a shoulder at 293 nm indicates the coexistence of both monomers and dimers (or higher number of aggregates).3 The B band (or Soret) in the UV-Vis region is assigned to electronic transition from π–π* (b2u to eg) orbitals. The C band is due to d–π* transition, which implies a broader d-band. There is also a small peak N band at 294 nm, which has been attributed to charge transfer (CT) from the spz mixing orbital to the electron system of the macrocyclic ring of the phthalocyanine.23
 | ||
| Fig. 2 UV-Vis absorption spectrum (a) of the ZnPc in a mixed solvent system of NMP and CHCl3 [1:10 v/v] (b) of the as-deposited ZnPc LB thin film with Lorentzian fitting showing different aggregations present. | ||
According to the molecular exciton theory, the selection rule predicts that the absorption band of molecular aggregates will show red and blue shifts when the angle α, which is defined as the angle between the plane of the monomer and the line connecting the centers of the molecular plane, is in the range of 0° < α < 54.7° for J-aggregate and 54.7° < α < 90° for H-aggregate, respectively.
To have proper knowledge of the molecular packing structure in solution and the as-deposited LB thin film, the Q band, which exists in the visible region of the spectrum, has been studied thoroughly. The absorption spectra of ZnPc in a mixture solvent of NMP and CHCl3 show a single Q-band absorption, corresponding to monomeric absorption with absorption maxima at 672 nm. The ZnPc molecules tend to form various aggregates even at very low surface pressure in the monolayer over the LB trough, which is mainly due to their extended flat aromatic macrocyclic core, which favors π–π stacking.24 This results in the occurrence of new absorption peaks toward lower and higher wavelength, i.e. at 613 nm, 772 nm and 822 nm in the absorbance spectrum of the LB thin film w.r.t. the monomeric absorption peak, as observed in the solvent. The new peaks are obtained by fitting the Q band with four different Lorentzian curves by a nonlinear peak fitting method, as shown in Fig. 2(b). This particular blue and red shift indicates the formation of aggregates in the LB thin film. Four bands with peak positions at 613 nm, 686 nm, 782 nm and 822 nm correspond to the coexistence of three types of aggregations over the solid substrate, i.e. H, J and monomeric aggregates. This results in different excitation bands due to electronic interaction between the constituent molecules as well as the intermolecular transfer interaction of the excited holes and electrons. The absorption peak at 613 nm corresponds to H-type aggregate (blue shift) and absorption peaks at 782 nm and 822 nm corresponds to the J-type aggregates, while the peak at 686 nm can be tentatively attributed to a monomer band or to some other medium transition aggregate.24 It can be observed from Fig. 2(b) that the percentage of ZnPc molecules in J aggregates is significantly higher than the H aggregates. Therefore, it can be concluded that the as-deposited LB thin film with higher percentage of edge to edge stacking of ZnPc molecules in comparison to edge on i.e. face to face stacking of the ZnPc molecules over the substrate surface.
 | ||
| Fig. 3 (a) Absorption spectrum of Q-band and (b) Davydov splitting of the two Q-bands of the ZnPc LB thin film at different annealing temperatures. | ||
The absorption spectra of the ZnPc LB films at different post annealing temperatures are shown in Fig. 3(a). The Davydov splitting is found to increase with an increase in the post annealing temperature, as seen in the Fig. 3(b). In the XRD study, it is shown that the dhkl value decreases with increase in annealing temperature, and therefore it can be concluded that the decrease in dhkl value results in an increase in the interaction between the adjacent molecules in the ZnPc film, which results in increasing Davydov splitting. However, the aggregation behavior of the ZnPc molecules in the LB thin film over the substrate surface does not show any major change upon further annealing and remains to be in the H and monomer aggregate form over the substrate surface. Only a slight shift in the peak of H and monomer aggregates has been observed toward the higher wavelength, which may be related to the phase change of the ZnPc LB film. It is observed from Fig. 3(a) that the peak intensity of the lower energy component starts increasing w.r.t. to the higher energy component in the Q-band only after 200 °C, which can be considered to be the transition temperature for the phase transformation of the ZnPc thin film from α-phase to β-phase. Phase transformation to β-phase completes at about 290 °C. This has been confirmed from earlier studied ZnPc thin film deposited either by thermal vapour unit or vaccum deposition unit, where it was observed that sample remain in α-phase till the lower energy absorption peak having less intensity in comparison to the higher energy absorption peak in Q-band and it get reverse for β-phase of the sample obtained at higher annealing temperature.30,31 Therefore, it can be concluded that the ZnPc LB film is in α-phase from 65 °C up to 200 °C and at temperature above 290 °C it remain in β-phase. The intensity of the entire absorption spectrum decreases with increase in annealing temperature, which may be due to the degradation or desorption of the ZnPc chromophore with increase in annealing temperature.
X-ray diffraction study
The XRD study was carried out to observe the crystal structure of 40 L ZnPc LB thin film deposited on glass substrate with the variation of annealing temperature. Fig. 4(a) shows the XRD pattern of the powder sample of ZnPc and 40 L ZnPc LB thin film annealed at different temperatures. The XRD trace of powder ZnPc is identified to be in β-form.32 By comparing the XRD pattern of the LB as-deposited ZnPc thin film (Fig. 4(b)) with the ZnPc powder, it can be confirmed that a crystalline phase transformation occurred in the ZnPc LB thin film deposited over the glass substrate. The as-deposited ZnPc LB thin film shows a small intense peak at 2θ = 6.78° from which it can be confirmed that the film has little crystallinity, and the deposited ZnPc layers are all ordered in either monoclinic or triclinic crystalline phase.33 The crystallite size (D), strain (ε) and the presence of dislocations (δ) strongly influence the structural properties of the ZnPc thin films. The crystallite size was calculated by using the Scherrer formula33 from the full-width half maxima (FWHM) (β):| D = 0.94λ/(βcosθ) |
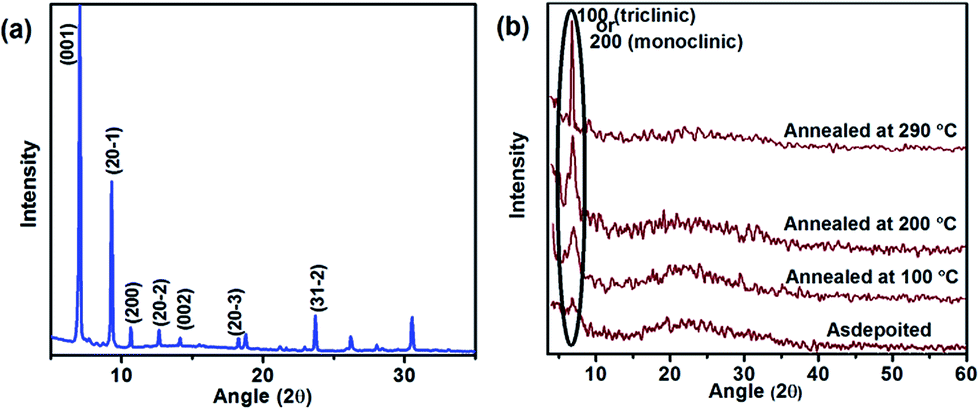 | ||
| Fig. 4 XRD patterns (Cu-Kα radiation) of the (a) ZnPc powder sample showing positions of the allowed Bragg reflections of β-ZnPc with corresponding miller indices, (b) 40 L ZnPc LB thin film deposited on glass substrate at different annealing temperatures. | ||
Strain (ε) was calculated from the formula:
| ε = (βcosθ)/4 |
Dislocation density (δ), which is defined as the length of dislocation per unit volume of the crystal, was evaluated from the formula:34,35
| Δ = 1/D2 |
 | ||
| Fig. 5 Variation of the (a) crystallite size D (nm) and d-spacing, (b) strain ε and dislocation density δ of ZnPc thin film on annealing. | ||
The d-spacing i.e. the interplanar spacing between the stacking ZnPc molecules over the substrate surface was observed to decrease from 13.0 Å to 12.0 Å (Fig. 5(a)) with an increase in annealing temperature from room temperature to 290 °C. This is due to increasing particle size of ZnPc over the substrate on annealing, which results in the increase in van der Waal forces between the ZnPc molecules. The decrease in d-spacing can be considered to be one of the reasons for the change in the phase of ZnPc LB film on annealing.
Microscopic strain calculated for the ZnPc thin film was found to decrease with increasing annealing temperature, as shown in Fig. 5(b). The observed decrease in strain in the ZnPc thin film is mainly because of the increase in thermal relaxation, decrease in the influence of the interface on the ZnPc layers and decreasing surface tension of the ZnPc layer.
X-ray photoelectron spectroscopy
For excitation, non-monochromatized Al Kα radiation is used. For every compound the binding energy scale was determined with reference to the carbon C1s peak centered at 284.2 eV. Note that that the as deposited ZnPc thin film sample has the C1s peak containing the respective signal from the carbon atoms. The XPS survey spectra were obtained with the Al Kα of the ZnPc as deposited thin film sample. The main peaks are Zn2p, N1s, and C1s (Table 1).| Element | Spectral line | Binding energy (eV) |
|---|---|---|
| Carbon | C1s | 282–288 eV |
| Nitrogen | N1s | 395–402 eV |
| Zinc | Zn2p | 1018–1050 eV |
The survey spectrum is coarse analysis for an accurate study of all the elements, and thus for every single element new settings are required. The peak positions data of the elements, presented in the table below, are taken from the literature database.41
The C1s and N1s core level spectra of the as-deposited ZnPc 40 L LB thin film are plotted in Fig. 6(b) and (c). A Shirley type background has been subtracted from these spectra.
 | ||
| Fig. 6 (a) XPS survey spectrum, (b) C1s core level spectrum, (c) N1s core level spectrum and (d) Zn2p core level spectrum of the as-deposited ZnPc 40 L LB thin film. | ||
The C1s peak has an asymmetric line shape with a longer tail on the high binding energy side. The unsubstituted phthalocyanine compounds have two types of contributions, which give rise to the C1s peak. The peak at 284.4 eV shows contribution from the aromatic carbons (which is the main contribution for unsubstituted phthalocyanines), and the peak at 285.9 eV corresponds to that of the pyrrolic carbon atoms (found at 1.5 eV higher binding energy than the aromatic carbons in benzene). For each molecule, the N1s peak contains contributions from meso-bridging and pyrrole nitrogens. As seen in Fig. 6(c), the N1s peak is found at 398.1 eV for P0–Zn and P1–Zn and 398 for P2–Zn.
The Zn2p core level spectra, as shown in Fig. 6(d), have two spin–orbit split components, namely Zn2p1/2 and Zn2p3/2. For 40 L ZnPc LB thin films, the Zn2p3/2 and Zn2p1/2 binding energies are determined to be 1021.6 eV and 1044.7 eV, respectively.
Surface morphology study
 | ||
| Fig. 7 FESEM image of the 40 L ZnPc LB thin films (a) in as deposited state and annealed at (b) 65 °C and (c) at 290 °C. | ||
 | ||
| Fig. 8 Model represents the growth mechanism with an increase in the stacking of ZnPc molecules along the b axis in the LB thin film during phase transformation from α to β-phase on annealing. | ||
| f(D) = 1/√2πσD[exp[−ln2\(D/Dc)/(2σ2)]] | (1) |
 | ||
| Fig. 9 Atomic force topographic images with corresponding grain size distributions of ZnPc LB thin film annealed at (a) 65 °C (b) 290 °C. | ||
The grain size distribution of the annealed ZnPc thin film remains monomodal up to 200 °C along with a continuous increase in ZnPc grains size, as shown in our earlier study,42 which confirms that the ZnPc thin films have a normal growth of grains until this annealing temperature. Similarly, the grain size distribution obtained for the ZnPc thin film annealed at 290 °C is found to be abnormal (Fig. 9(b)) and it is fitted using Gaussian distribution function given as:
| f(x) = 1/(σ√2π)e[−(x − μ)2/(2σ2)] | (2) |
By convoluting the grain size distribution graph, we obtained three peaks corresponding to an average ZnPc grain size of 39 nm, 72 nm and 120 nm. The abnormal grain growth has led to the formation of ZnPc grains having an average size of 72 nm and 120 nm, which grow at a higher rate in comparison to the average ZnPc grain size of 39 nm, which has a normal growth rate. In thin films, the abnormal grain growth is not solely driven by the reduction in grain boundary energies.46 The differences in surface energy (the energy associated with top and bottom surfaces of the film) supply an additional driving force for the growth of abnormal grains, which comes into play when grain size is comparable to film thickness.
Surface electrical study
To have an overview of the growth effect of ZnPc molecules on annealing toward the electrical properties of ZnPc LB thin film, we carried out current vs. voltage measurements of ZnPc LB thin film annealed at 65 °C and at 290 °C deposited over ITO glass substrate in dark and under light illumination of 1 sun = 100 mW cm−2 using a solar simulator (Newport, at AM 1.5 G), as shown in Fig. 10. The surface cell configuration showing the molecular architecture has been shown in the inset of Fig. 10. From the UV-Vis absorbance study, the ZnPc LB thin film was observed to be in α-phase and β-phase when annealed at 65 °C and 290 °C, respectively. Despite the decrease in the quantity of ZnPc chromophore due to desorption from the bulk of the LB film with increasing annealing temperature we have observed that the electrical conductivity of the ZnPc LB thin film at 290 °C increases significantly w.r.t. ZnPc thin film at 65 °C in dark and under light illumination. The reason is that we have taken the surface I vs. V measurement of the annealed film and it is known that the current flow in the organic devices is mainly confined in the first 50 Å of semiconductor layer.47 Therefore, the desorption of ZnPc chromophores at higher temperature will not have any effect on I vs. V measurement. We have observed from the AFM and SEM study that the molecular grain growth occurs along the substrate surface on annealing, which result in nanorod formation at 290 °C with comparatively larger ZnPc grain diameter than the ZnPc grains at 65 °C. This confirms that in β-phase the parallel inplane stacking of the planar ZnPc molecules standing perpendicular over the substrate surface become more ordered and compact throughout. The increase in grain size results in a decrease in grain boundary, which minimizes the obstruction imposed on the transport of the charge carriers because of grain disorderedness at the grain boundary. In addition, the more ordered and compact parallel in-plane stacking of the ZnPc molecules in β-phase helps in the efficient transport of charge carriers through the grain and also across the grain boundary.48 The observed increase in the electrical conductivity of the ZnPc LB thin film with phase transformation from α-phase to β-phase can also be justified with the resultant decrease in the interplanar distance of the stacking molecules. We observed from the XRD study that the interplanar distance of ZnPc LB thin film decreases with α-phase to β-phase transformation from 13.0 Å to 12.0 Å. The intermolecular π-orbital overlap is strongly dependent on the interplanar distance between the molecules. Therefore, reduction in the interplanar distance between the stacking molecules leads to an increase in the intermolecular π-orbital overlap. This results in an efficient transport of charge carriers and an increase in its conductivity. This concludes that the β-phase of the ZnPc has better conductivity w.r.t. α-phase. Under photoexcitation the amplitude of the device current at any voltage increases for both ZnPc LB thin film annealed at 65 °C and at 290 °C due to increase in photo generated excitons under illumination, which shows good optical absorbance properties of ZnPc thin film. This confirms the good photovoltaic properties of ZnPc thin film. The ZnPc thin film annealed at 290 °C has a better enhancement of photocurrent because of increase in charge carrier mobility in the β-phase. Tong et al.,49 reported that β-phase of CuPc has better photovoltaic performance compared to α-phase due to its higher conductivity as well as higher absorbance at longer wavelength. | ||
| Fig. 10 Measured current vs. voltage characteristics of the annealed ZnPc thin film (a) at 65 °C (α-phase), (b) at 290 °C (β-phase) under dark and photoexcitation whereas the inset shows the schematic diagrams of the surface cell configuration. | ||
Conclusion
We have investigated the aggregation behaviour of the ZnPc molecules in the as-deposited LB thin film and the change in the aggregation behaviour of ZnPc molecules when annealed at different temperatures using UV-Vis absorption spectroscopy. The ZnPc has been observed to be in monomeric form in mixed solvent, and in the as-deposited LB thin film it has been observed to be in H, J and monomer aggregate forms. The percentage of J aggregate in the as-deposited film is large in comparison to H and monomer aggregates, which indicates that the as-deposited thin film has a higher ratio of edge to edge stacking of ZnPc molecules in comparison to edge on, i.e. face to face stacking, of the ZnPc molecules over the substrate surface. A sudden change in the aggregation behavior of the molecules has been observed when the ZnPc LB film annealed at 65 °C. It consists of H and monomer aggregates, which indicate the film has only face to face stacking of the ZnPc molecules. The ZnPc LB film has been found to have the same aggregation behavior until higher annealing temperature.The ZnPc thin film remains in α-phase from 65 °C to 200 °C, and the α–β phase transformation starts occurring from 200 °C and is completed at 290 °C, as observed by UV-Vis absorption study. From the XRD study, we observe a large increase in the crystallite size of the ZnPc LB thin film on annealing at 290 °C, which indicates an abnormal growth of ZnPc nanoparticles and is related to α–β phase transformation of the ZnPc thin film. Similarly FESEM and AFM image confirm the formation of elongated nanorod-like structures over the substrate surface when the ZnPc thin film is annealed at 290 °C, which is due to the secondary grain growth process of the ZnPc nanoparticles at higher annealing temperature. This change in the shape of the ZnPc nanoparticle from spherical to nanorod structure is related to the phase change of the ZnPc LB thin film from metastable α-phase to stable β-phase. The π–π interaction between the face to face arranged molecules of the ZnPc is the fundamental reason for the growth of nanorods. The electrical conductivity of the ZnPc LB thin film in β-phase has been found to enhance significantly w.r.t. ZnPc thin film in α-phase under both dark and excitation of photo chromatic light. The ordered and compact parallel in-plane stacking of the ZnPc molecules as well as large increase in grain size lead to a decrease in grain boundary area in β-phase resulting in efficient transport of charge carriers through the grain. This study shows that the change of organic molecular arrangement or configuration over the substrate plays an important role in the change of optical and electrical properties of the material when processed in the form of a thin film.
Acknowledgements
DR and PSG thank UGC for financial support for carrying out the research work by granting Major Research Project F. N. 39-462/2010(SR). We gratefully thank Dr Mukul Gupta, UGC-DAE CSR, Indore for his support in XRD measurements and Dr V. Ganesan, UGC-DAE CSR, Indore for providing AFM facility. We gratefully thank Prof. B. R. Mehta, IIT Delhi, Delhi for his support in taking I–V measurements. We acknowledge UGC-DAE CSR, Indore for giving opportunity to carry out characterization of the samples under the CRS project.Notes and references
- J. M. Tour, Molecular Electronics, Commercial Insights, Chemistry, Devices, Architecture and Programming, World Scientific, Singapore, 2003 Search PubMed.
- A. A. Virkar, S. Mannsfeld, Z. Bao and N. Stingelin, Adv. Mater., 2010, 22, 3857 CrossRef CAS PubMed.
- C. C. Leznoff and A. B. P. Lever, Phthalocyanines: Properties and Applications, VCH, New York. 1993 Search PubMed.
- J. Drechsel, B. Mannig, F. Kozlowski, M. Pfeiffer, K. Leo and H. Hoppe, Appl. Phys. Lett., 2005, 86, 244102 CrossRef PubMed.
- S. Pfuetzner, J. Meiss, A. Petrich, M. Riede and K. Leo, Appl. Phys. Lett., 2009, 94, 253303 CrossRef PubMed.
- M. Riede, T. Mueller, W. Tress, R. Schueppel and K. Leo, Nanotechnology, 2008, 19, 424001 CrossRef CAS PubMed.
- C. Schunemann, D. Wynands, K. J. Eichhorn, M. Stamm, K. Leo and M. Riede, J. Phys. Chem. C, 2013, 117, 11600 Search PubMed.
- S. E. Fritz, S. M. Martin, C. D. Frisbie, M. D. Ward and M. F. Toney, J. Am. Chem. Soc., 2004, 126, 4084 CrossRef CAS PubMed.
- Y. Zheng, D. Qi, N. Chandrashekar, X. Gao, C. Troadec and S. T. A. Wee, Langmuir, 2007, 23, 8336 CrossRef CAS PubMed.
- T. Bhornholm, T. Hassenkam and N. Reitzel, J. Mater. Chem., 1999, 9, 1975 RSC.
- W. J. Feast, P. W. Lovenich, H. Puschmann and C. Taliani, Chem. Commun., 2001, 505 RSC.
- M. Kasha, in Spectroscopy of the Excited State, ed. B. D. Bartolo, Plenum Press, New York, 1976, NATO Adv. Stud. Inst. Ser., Ser. B, Physics. No. 12 Search PubMed.
- M. Kasha, H. R. Rawls and M. El-Bayoumi Ashraf, Pure Appl. Chem., 1965, 11, 371 CrossRef CAS.
- A. Gouloumis, D. Gonzalez-Rodrıguez, P. Vazquez, T. Torres, S. Liu, L. Echegoyen, J. Ramey, G. L. Hug and D. M. Guldi, J. Am. Chem. Soc., 2006, 128, 12674 CrossRef CAS PubMed.
- M. Ashida, N. Uyeda and E. Suito, J. Cryst. Growth, 1971, 8, 45 CrossRef CAS.
- M. Ashida, Bull. Chem. Soc. Jpn., 1966, 39, 2625 CrossRef CAS.
- S. M. Bayliss, S. Heutz, G. Rumbles and T. S. Jones, Phys. Chem. Chem. Phys., 1999, 1, 3673 RSC.
- S. Heutz, S. M. Bayliss, R. L. Middleton and T. S. Jones, J. Phys. Chem. B, 2000, 104, 7124 CrossRef CAS.
- S. Yim, S. Heutz and T. S. Jones, J. Appl. Phys., 2002, 9, 13632 Search PubMed.
- M. Mahato, P. Pal, T. Kamilya, R. Sarkar and G. B. Talapatra, J. Phys. Chem. B, 2010, 114, 495 CrossRef CAS PubMed.
- D. R. Tackely, G. Dent and W. E. Smith, Phys. Chem. Chem. Phys., 2000, 2, 3949 RSC.
- K. Xiao, Y. Liu, X. Huang, Y. Xu, G. Yu and D. Zhu, J. Phys. Chem. B, 2003, 107, 9226 CrossRef CAS.
- M. M. El-Nahass, H. M. Zeyada, M. S. Azis and N. A. El-Ghamaz, Opt. Mater., 2004, 27, 491 CrossRef CAS PubMed.
- Y. Qui, P. Chen and M. Liu, Langmuir, 2008, 14, 7200 Search PubMed.
- A. S. Davydov, Theory of molecular excitons, McGraw-Hill Book Company, New York, 1962 Search PubMed.
- A. A. Zanfolim, D. Volpati, C. A. Olivati, A. E. Job and C. J. L. Constantino, J. Phys. Chem. C, 2010, 114, 12290 CAS.
- J. Mack and M. J. Stillman, Inorg. Chem., 1997, 36, 413 CrossRef CAS.
- H. Laurs and G. Heiland, Thin Solid Films, 1987, 149, 129 CrossRef CAS.
- M. M. El-Nahass, H. M. Zeyada, M. S. Azis and N. A. El-Ghamaz, Opt. Mater., 2004, 27, 491 CrossRef CAS PubMed.
- S. Heutz, S. M. Bayliss, R. L. Middleton, G. Rumbles and T. S. Jones, J. Phys. Chem. B, 2000, 104, 7124 CrossRef CAS.
- M. Kozlik, S. Paulke, M. Gruenewald, R. Forker and T. Fritz, Org. Electron., 2012, 13, 3291 CrossRef CAS PubMed.
- C. Schunemann, C. Elschner, A. A. Levin, M. Levichkova, K. Leo and M. Reide, Thin Solid Films, 2011, 519, 3939 CrossRef PubMed.
- S. Senthilarasu, R. Sathyamoorthy and S. K. Kulkarni, Mater. Sci. Eng., B, 2005, 122, 100 CrossRef PubMed.
- S. Senthilarasu, Y. B. Hahn and S.-H. Lee, J. Appl. Phys., 2007, 102, 043512 CrossRef PubMed.
- S. Senthilarasum, R. Sathayamoorthy and S. K. Kulkarni, Mater. Sci. Eng., B, 2005, 122, 100 CrossRef PubMed.
- P. Sullivan, T. S. Jones, A. J. Furguson and S. Hertz, Appl. Phys. Lett., 2007, 91, 233114 CrossRef PubMed.
- R. Sathamoorthy and S. Senthilarasu, J. Electrochem. Soc., 2007, 154, H1 CrossRef PubMed.
- T. Sakurai, R. Fukasawa, K. Sato and K. Akimoto, Org. Electron., 2007, 8, 702 CrossRef CAS PubMed.
- A. Hoshino, Y. Takenaka and H. Miyaji, Acta Crystallogr., Sect. B: Struct. Sci., 2003, 59, 393 Search PubMed.
- S. Senthilarasu, Y. B. Hahn and S. H. Lee, J. Appl. Phys., 2007, 102, 043512 CrossRef PubMed.
- http://srdata.nist.gov/xps, December 2012.
- D. Roy, N. M. Das and P. S. Gupta, AIP Adv., 2014, 4, 077126 CrossRef PubMed.
- L. Gaffo, M. R. Corderio, A. R. Freitas, W. C. Moreira, E. M. Girotto and V. Zucolotto, J. Mater. Sci., 2010, 45, 1366 CrossRef CAS PubMed.
- W. Dou, Y. Tang, C. S. Lee, S. N. Bao and S. T. Lee, J. Chem. Phys., 2010, 133, 144704 CrossRef PubMed.
- S. Yim, S. Hertz and T. S. Jones, Phys. Rev. B: Condens. Matter Mater. Phys., 2003, 67, 165308 CrossRef.
- C. V. Thompson, J. Floro and H. I. Smith, J. Appl. Phys., 1990, 67, 4099 CrossRef CAS PubMed.
- M. A. Alam, A. Dodabalapur and M. R. Pinto, IEEE Trans. Electron Devices, 1997, 44, 1332 CrossRef CAS.
- M. M. Ling and Z. Bao, Chem. Mater., 2004, 16, 4824 CrossRef CAS.
- W. H. Tong, A. B. Djurisic, A. M. C. Ng and W. K. Chan, Thin Solid Films, 2007, 515, 5270 CrossRef CAS PubMed.
| This journal is © The Royal Society of Chemistry 2014 |