Esther Orisakwea,
Bruno Fontainea,
Duncan H. Gregoryb,
Régis Gautier*a and
Jean-François Halet*a
aInstitut des Sciences Chimiques de Rennes, UMR 6226 CNRS – Université de Rennes 1 – Ecole Nationale Supérieure de Chimie de Rennes, F-35708 Rennes Cedex 7, France. E-mail: rgautier@ensc-rennes.fr; halet@univ-rennes1.fr
bWestCHEM, School of Chemistry, University of Glasgow, Glasgow G12 8QQ, UK
First published on 4th July 2014
Thermodynamic, structural, and electronic properties of the layered ternary nitrides AEMN2 (AE = alkaline-earth; M = group 4 transition metal) both with the KCoO2 and α-NaFeO2 structure-types are examined within density-functional theory. The AE:M atomic (or ionic) radius ratio seems to be the most important criterion in determining one structural arrangement over the other. We find that the majority of compounds are more stable with the KCoO2 structure-type where M is coordinated to five nitrogen atoms in a distorted square-based pyramidal geometry. Strong interactions occur in both arrangements not only between nitrogen and transition metal atoms, but also between nitrogen and alkaline-earth metal atoms within and between the layers. Calculations show that all the AEMN2 compounds with the tetragonal structure-type KCoO2 are semiconducting with band gaps of approximately 1 eV. However, small band gap conductor and even semi-metallic behavior are computed for compounds with the alternative hexagonal α-NaFeO2 structure-type.
![]() | ||
Fig. 1 Crystal structure of SrZrN2 (with the α-NaFeO2 structure-type). Large blue, medium grey and small yellow spheres represent Sr, Zr and N atoms, respectively. |
Surprisingly, with the usual nominal oxidation states of 3− and 2+ for N and the AE metals respectively, the formal d-electron count for the group 4 transition metal in the above AEMN2 compounds is d0, irrespective of whether the α-NaFeO2 or KCoO2 structure is adopted. A glance at Table 1,29 which contains both the existing and as-yet unknown AEMN2 compounds, seems to suggest that both the electron count and the AE:M radius ratio govern the preferred structural arrangement.
Theoretical studies have been performed previously on some of the compounds given in Table 1 but these are few in number and much remains to be understood. The unexpected magnetic properties of SrTiN2 were tentatively elucidated.28 Electronic and vibrational properties of BaHfN2 were studied showing semiconducting behavior with an indirect band gap.30 However, no comprehensive study has yet been performed to rationalize the observed structures, bonding and physical properties in these AEMN2 compounds. This is the modest ambition of this paper using density-functional theory (DFT) calculations.
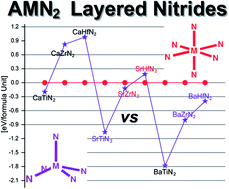
Given that all the above AEMN2 compounds are isoelectronic, we can postulate that the AE:M atomic (or ionic) radius ratio may play a deciding role in imposing one structure over the other. Although the total number of characterized compounds is not large, it seems that for an AE:M atomic radius ratio of around 1.3, the α-NaFeO2 structure type will be preferred, whereas with a ratio of approximately 1.4, the KCoO2 structure prevails. On this basis, CaTiN2 should be observed with the α-NaFeO2 structure type, although, calculations indicate a very small thermodynamic preference for the KCoO2 structure.
Tables 2 and 3 summarize the cell parameters, cell volumes, bulk moduli, and pertinent interatomic distances obtained from geometry optimization of the nine AEMN2 compounds in each of the α-NaFeO2 and KCoO2 structure types, respectively. Existing experimental and computational data are included for comparison where available. The good agreement between the computed and experimental structures (deviation <2% overall) inspires confidence in the prediction of structures for those compounds that have yet to be synthesized and characterized. As expected, for a given AE element, a significant increase in both a and c parameters is computed on moving from Ti to Zr and Hf compounds leading to an expansion of more than 12% in the unit cell volumes for the α-NaFeO2 structures. For AE = Ca and Sr, this increase is even larger for compounds adopting the KCoO2 structure type (ca. 20% vs. ca. 13% for BaMN2 compounds).
Structure | a/Å | c/Å | A–N/Å | M–N/Å | V/Å3 | B0/GPa | Band Gap/eV | Ref. |
---|---|---|---|---|---|---|---|---|
CaTiN2 | 3.138 | 16.404 | 2.424 | 2.132 | 139.9 | 173 | 0 | |
CaZrN2 | 3.318 | 16.843 | 2.494 | 2.266 | 160.6 | 161 | 0.45 | |
CaHfN2 | 3.292 | 16.811 | 2.486 | 2.247 | 157.8 | 171 | 0.45 | |
SrTiN2 | 3.211 | 17.335 | 2.571 | 2.159 | 154.8 | 139 | 0 | |
SrZrN2 | 3.382 | 17.781 | 2.629 | 2.281 | 176.1 | 129 | 0.40 | |
3.373 | 17.676 | 2.609 | 2.292 | 174.1 | 25 | |||
SrHfN2 | 3.353 | 17.684 | 2.607 | 2.277 | 172.2 | 166 | 0.40 | |
3.345 | 17.678 | 2.602 | 2.273 | 171.3 | 25 | |||
BaTiN2 | 3.279 | 18.451 | 2.749 | 2.181 | 171.8 | 115 | 0 | |
BaZrN2 | 3.446 | 18.921 | 2.818 | 2.302 | 194.6 | 123 | 0 | |
BaHfN2 | 3.418 | 18.888 | 2.806 | 2.286 | 191.1 | 122 | 0 |
Structure | a/Å | c/Å | A–N/Å | M–N/Å | V/Å3 | B0/GPa | Band Gap/eV | Ref. |
---|---|---|---|---|---|---|---|---|
a Ref. 30 – range of band gaps values obtained from PBE calculations using different pseudopotentials. | ||||||||
CaTiN2 | 3.807 | 7.517 | 2.253 (×1) | 1.844 (×1) | 108.9 | 127 | 1.00 | |
2.694 (×4) | 2.024 (×4) | |||||||
CaZrN2 | 3.996 | 8.131 | 2.471 (×1) | 2.009 (×1) | 129.8 | 130 | 1.60 | |
2.826 (×4) | 2.160 (×4) | |||||||
CaHfN2 | 3.960 | 8.150 | 2.306 (×1) | 2.016 (×1) | 127.8 | 128 | 1.70 | |
2.807 (×4) | 2.138 (×4) | |||||||
SrTiN2 | 3.802 | 7.776 | 2.596 (×1) | 1.836 (×1) | 112.4 | 123 | 0.80 | |
2.691 (×4) | 2.056 (×4) | |||||||
3.882 | 7.701 | 2.611 (×1) | 1.827 (×1) | 116.1 | 28 | |||
2.747 (×4) | 2.053 (×4) | |||||||
3.880 | 7.699 | 2.581 (×1) | 1.839 (×1) | 115.9 | 27 | |||
2.745 (×4) | 2.056 (×4) | |||||||
SrZrN2 | 4.069 | 8.296 | 2.523 (×1) | 2.018 (×1) | 137.3 | 122 | 1.15 | |
2.882 (×4) | 2.179 (×4) | |||||||
SrHfN2 | 4.043 | 8.278 | 2.539 (×1) | 2.008 (×1) | 135.3 | 123 | 1.20 | |
2.865 (×4) | 2.162 (×4) | |||||||
BaTiN2 | 4.014 | 8.068 | 2.856 (×1) | 1.827 (×1) | 130.0 | 101 | 0.80 | |
2.939 (×4) | 2.106 (×4) | |||||||
BaZrN2 | 4.188 | 8.502 | 2.858 (×1) | 2.000 (×1) | 149.1 | 124 | 1.10 | |
2.932 (×4) | 2.228 (×4) | |||||||
4.161 | 8.392 | 2.771 (×1) | 2.011 (×1) | 145.3 | 26 | |||
2.948 (×4) | 2.202 (×4) | |||||||
BaHfN2 | 4.152 | 8.491 | 2.819 (×1) | 1.993 (×1) | 146.4 | 106 | 1.10 | |
2.946 (×4) | 2.198 (×4) | |||||||
4.128 | 8.382 | 2.680 (×1) | 2.050 (×1) | 142.8 | [0.95–1.25]a | 26 | ||
2.922 (×4) | 2.186 (×4) |
It is noteworthy that M–N distances differ substantially in α-NaFeO2 and KCoO2 structure types. Six rather long M–N distances are encountered around the octahedrally coordinated metal in the former, whereas four shorter (5–8%) M–Nbasal contacts and a significantly shorter (by 12–15%) M–Napical contact are computed for the latter.
Resistance to volume change was analyzed by computing the bulk modulus, i.e. the second derivative of the total energy with respect to the volume, for all AEMN2 compounds. Values reported in Tables 2 and 3 show that compounds with the α-NaFeO2 structure-type are less compressible than those with the KCoO2 structure-type. This is particularly the case for the hypothetical CaMN2 compounds with the former structure-type, the bulk moduli of which are computed to be comparable to that of steel and ca. 30% larger than compounds with the KCoO2 structure-type.
The calculated PDOS and DOS of SrTiN2 when adopting the experimentally observed KCoO2 structure type are depicted in Fig. 4. The total DOS divides into three main regions. The first is located between −15 and −10 eV and is derived from the N 2s orbitals. The second region that is centered close to −2.5 eV below the Fermi level (εF), is somewhat broader and is mostly due to N 2p N orbitals with a substantial admixture of Sr and Ti valence (mostly d-type) orbitals. Interestingly, PDOS for basal N1 and apical N2 atoms differ slightly, with those of the former being broader and lying at somewhat lower energy than those of the latter. The large DOS above the Fermi level shows the dominance of the Ti orbitals, which are combined to a small extent with Sr and N orbitals. The metal orbital participation in the valence band in the vicinity of εF, coupled with the nitrogen orbital contribution to the conduction band which is otherwise predominantly comprised of metal states reflect the rather strong metal–nitrogen covalent interactions. Contrary to previous LMTO results,28 SrTiN2 is computed to be diamagnetic. The simplified description of the Kohn–Sham potential in the LMTO method may be at the origin of this discrepancy.
The band structure shown in Fig. 5 indicates a semiconducting behavior with a calculated (direct) band gap of ca. 0.8 eV. Since LDA and GGA functionals usually underestimate band gaps, the true band gap is likely to be larger than 1 eV. For comparison, all the computed band gaps for the compounds with the KCoO2 structure are given in Table 3. The small dispersion of bands in Γ → Z and A → M show the weak interaction between MN2 nets. The lowest conduction band has primarily Ti 3dxy character. The large dispersion of this band is due to Ti–Ti interactions within the layers. The band structure sketched in Fig. 5 agrees with a recent theoretical study carried out for some of these nitrides in order to evaluate their thermoelectric performance.32
Total and partial DOS for SrTiN2 in the alternative α-NaFeO2 structure-type are shown in Fig. 6. As is the case for the KCoO2 structure-type, the total DOS also divides into three main regions but the low lying band is notably narrower for the α-NaFeO2 structure. The valence band is once more dominated by N 2s and 2p orbitals with some contribution from the metal atoms, whereas the conduction band derives mostly from the metal orbitals with some admixture of N orbitals. It is noteworthy that the tails of the valence and conduction bands are in contact at the Fermi level. This semi-metallic character is confirmed by an analysis of the band structure shown in Fig. 7. It is important to note that the (indirect) band gap is computed as almost 0.6 eV using the mBJ functional proposed by Tran and Blaha that yields band gaps with accuracy similar to hybrid functional or GW methods.33 The band dispersion along the T → Γ direction that is perpendicular to the MN2 layers is weaker. It is noteworthy that the band structure portrayed in Fig. 7 is qualitatively similar to the one computed for the isostructural compound CaTaN2.34 In this latter, an additional electron per formula unit occupies the bottom of the conduction band shown in Fig. 7. Therefore 2D-metallic properties are envisioned for CaTaN2 whereas the AEMN2 (M = Ti, Zr, Hf) compounds in the α-NaFeO2 structure-type are expected to behave as semiconductors or semimetals according to DFT calculations. The alkaline-earth contribution to the occupied levels is very small in both cases. This suggests that a stronger more covalent interaction occurs in bonds within the MN2 layers but that ionic bonding exists between the MN2 layers and the Sr sheets (i.e. Sr2+(Ca2+)[MN2]2−). Similar band structures are observed for the α-NaFeO2-type variants of BaMN2 (M = Ti, Zr, Hf) and CaTiN2, suggesting that the bonding in these compounds is similar to that computed for the hypothetical SrTiN2 phase.
![]() | ||
Fig. 6 PDOS and DOS of SrTiN2 with the hypothetical α-NaFeO2 structure-type. The Fermi energy level is set at 0 eV. |
Strong interactions occur in both arrangements not only between nitrogen and transition metal atoms, but also between nitrogen and alkaline-earth metal atoms. Calculations show that AEMN2 compounds adopting the tetragonal structure-type KCoO2 are semiconducting with band gaps of approximately 1 eV. By contrast, small band gap conducting and even semi-metallic behaviors are computed for the equivalent compounds when adopting the hexagonal α-NaFeO2 structure-type.
Combining AE = Ca, Sr, Ba and M = Ti, Zr, Hf generates 9 ternary AEMN2 compounds, the structures of which were optimized and analyzed both with the KCoO2 and α-NaFeO2 structure-types. Optimization was obtained by minimizing the total energies of their primitive cells as a function of volume according to Birch–Murnaghan's equation of state:37,38
E (V) = E0 + 9V0B0/16[(X2 − 1)3B′0 + (X2 − 1)2(6 – 4X2)] |
This journal is © The Royal Society of Chemistry 2014 |