
 Open Access Article
 This Open Access Article is licensed under a
 Creative Commons Attribution 3.0 Unported Licence
Exploiting Na2MnPO4F as a high-capacity and well-reversible cathode material for Na-ion batteries†
Xiaochen
Lin
,
Xu
Hou
,
Xiaobiao
Wu
,
Sihui
Wang
,
Ming
Gao
and
Yong
Yang
*
State Key Laboratory of Physical Chemistry of Solid Surfaces, and Department of Chemistry, College of Chemistry and Chemical Engineering, Xiamen University, Xiamen 361005, PR China. E-mail: yyang@xmu.edu.cn
First published on 31st July 2014
Abstract
A Na2MnPO4F/C nanocomposite material is successfully synthesized via spray drying, followed by a high-temperature sintering method. It is shown that the highly phase-pure Na2MnPO4F with symmetry of the P21/n space group is uniformly embedded in the carbon networks, which play a key role in building up a highly efficient, electron-flow channel and elevating the electronic conductivity of the nanocomposites. The electrochemical measurements show that the initial discharge capacity of Na2MnPO4F reaches up to 140 and 178 mA h g−1 at 30 °C and 55 °C, respectively. Furthermore, the capacity still maintains 135 mA h g−1 after 20 cycles at 55 °C. The Na+ diffusion coefficient in Na2MnPO4F is calculated at about 10−17 cm2 s−1 by the GITT method. The impressive cycling performance of the material is ascribed to the good structural reversibility and stability of Na2MnPO4F, which are confirmed by the ex situ XRD measurements during the first cycle and after 30 cycles.
1. Introduction
Lithium-ion batteries play an important role as a highly efficient energy-storage device in our society due to the current wide applications in portable electronics and the future potential for large-scale energy storage and utilization of renewable energy.1,2 In parallel with the development of Li-ion batteries, Na-ion batteries have gradually become the central focus of renewable energy storage in the last few years. Compared with its Li counterpart, sodium resources are more abundant in nature, leading to the advantage of lower costs in their manufacture and usage. Consequently, the usage of Na-ion batteries will effectively accelerate the large-scale application of rechargeable batteries in the field of energy storage.3–5 Furthermore, the sodium system also provides us with broader research and applied fields, particularly for the compounds whose lithium counterparts do not exist.6NaFexMn1−xPO4,7–9 Na2MnP2O7,10,11 NaVPO4F,12 Na3V2(PO4)2F3 (ref. 13 and 14) and Na2FePO4F (ref. 15–18) have been reported in the previous studies as phosphate cathode materials for sodium-ion batteries. Herein, we report a new advance on Na2MnPO4F material. Na2MnPO4F has high theoretical capacity and working voltage plateau, which are the most important parameters for constructing high energy density batteries. In this class of fluorinated phosphate materials, the addition of the F atom needs the introduction of one alkaline atom to achieve charge balance; thus, two Na atoms could (de)intercalate per transition metal atom during cycling, which leads to a higher capacity. Furthermore, the electronegativity of fluorine is higher than that of oxygen, corresponding to the enhanced ionicity of the bonds and the higher redox potential.19,20
Considering that Mn-based phosphates commonly exhibit a higher redox potential than that of Fe,21 it is speculated that Na2MnPO4F would hold a higher voltage plateau than Na2FePO4F, even in the aspect of energy density. However, after reviewing the development of Na2MnPO4F, we could see that it is quite different from the Fe analogue because of the poorer electrochemical activity of Mn than Fe. Therefore, much work still needs to be conducted to exploit the highly active Na2MnPO4F cathode material.
Recham et al.16 applied the low-temperature ionothermal method to synthesize Na2MnPO4F. The obtained Na2MnPO4F turned out to be inactive, although they existed in the similar particle size and distribution compared with the active Na2FePO4F (<100 nm). They inferred that the strong Jahn–Teller effect on Mn3+ and the resultant distortion in coordination structure may be responsible for the poor electronic and ionic conductivity; thus, the Na2MnPO4F material exhibited poor electrochemical activity.
In another work, Wu et al.17 first reported the electrochemically active Na2MnPO4F prepared by the sol–gel method. When cycling in the voltage range of 1.5–4.6 V (vs. Li+/Li) at a current density of 10 mA g−1 at 60 °C in the hybrid Na/Li cell, it achieved an initial discharge capacity of 98 mA h g−1. The improved performance was ascribed to the smaller particle size and uniform carbon coating of the nanocomposites. Although this is considered impressive progress, some shortcomings of the material still exist such as poor capacity retention. In addition, Kim et al.22 conducted the calculation studies, based on transition state theory, to examine the diffusion kinetics of sodium ions in the 3-D structure of Na2MnPO4F. Through computation, they revealed that there were three sodium-ion diffusion paths with low activation barrier energy, including two Na+ chain paths and one inter-chain path. Concerned about these possible sodium ion diffusion paths, it is believed that the Na2MnPO4F could be highly active when properly synthesized, similar to size reduction and carbon coating reported by Wu. Based on this theoretical guidance, they prepared Na2MnPO4F by the solid-state method with a discharge capacity of ∼120 mA h g−1 at a current density of 10 mA g−1 between 1.0 V and 4.5 V (vs. Na+/Na). Unfortunately, the obtained capacity did not exceed the capacity of the one-electron exchange per unit formula (124 mA h g−1). Moreover, more detailed material properties such as cyclic performance, rate capability and structure stability need further study for this promising cathode material for Na-ion batteries.
In order to fully exploit the advantages of high-capacity Na2MnPO4F materials, the synthetic method of spray drying, followed by high-temperature sintering is carried out in this work. Spray drying is a facile method of producing dry powder from the liquid by rapid drying with hot gas. It exhibits the advantages of (1) a homogeneous mixture of raw reagents by liquid method; (2) the spherical precursor with a consistent particle-size distribution; and (3) the in situ, uniform carbon coating when sintering. In this respect, the approach of spray drying would be ideal for constructing the small-size particle and good distribution of the carbon coating, and then obtaining a high-capacity Na2MnPO4F material.
Herein, we utilize this spray-drying method to synthesize the precursor and high-temperature sintering to obtain the highly electrochemically active Na2MnPO4F/C nanocomposite. We investigate the morphology, elemental distribution, electrochemical performance and structural stability of Na2MnPO4F. The results show that the as-prepared Na2MnPO4F material exhibits impressive high capacity at 30 °C and 55 °C, good cycling stability and acceptable rate capability. Moreover, Na2MnPO4F possesses good structural reversibility and stability upon cycling.
2. Experimental
2.1 Synthesis of Na2MnPO4F/C
The schematic plot of synthesizing an Na2MnPO4F cathode material is illustrated in Fig. 1. The Na2MnPO4F/C nanocomposite was synthesized via spray drying, followed by a high-temperature sintering method. Firstly, 0.02 mol Mn(CH3COO)2·4H2O and 0.04 mol citric acid were added to 70 ml deionized water, followed by stirring for 10 min. Then, 0.04 mol NaF and 0.02 mol NH4H2PO4 were added to the as-prepared solution. The final mixed solution was stirred continuously for another 16 h. Then, the obtained homogeneously mixed solution was prepared into solid precursor with the help of a spray dryer. The obtained precursor was pressed into a pellet and sintered in argon atmosphere at 350 °C for 3 h, and then 700 °C for 6 h to obtain the product Na2MnPO4F/C. | ||
| Fig. 1 Schematic plot for synthesizing Na2MnPO4F/C cathode material. | ||
2.2 Characterization
Na, Mn and P elemental contents in the product are determined by ICP-AES (IRIS Intrepid II XSP, Thermo Electron, USA). The carbon content is detected by a Vario EL III elemental analyzer (Elementar Analysen System GmbH, Germany).The crystalline phase of Na2MnPO4F is confirmed by a Rigaku Ultima IV X-ray Diffractometer (Rigaku Corporation, Japan) with a scanning rate of 5° per min. The XPS spectra are measured on a Quantum 2000 spectrometer (Physical Electronics, USA), and all the peaks are calibrated by the C 1s (284.6 eV). Scanning electron microscopy (SEM) studies are conducted on an S-4800 (HITACHI, Japan), equipped with an energy-dispersive X-ray spectroscopy (EDS) detector used for EDS elemental mappings. The transmission electron microscopy (TEM) and high-resolution transmission electron microscopy (HRTEM) are conducted on Tecnai F20 (FEI, American), working at an accelerating voltage of 200 kV.
2.3 Measurement of electrochemical performances
The CR2025 coin-type cells are used to evaluate the electrochemical performance of Na2MnPO4F/Na using a non-aqueous electrolyte (1 M NaClO4/EC-PC 1![[thin space (1/6-em)]](https://www.rsc.org/images/entities/char_2009.gif) :1 v/v) with Na foil as the anode. To obtain the cathode slurry, the Na2MnPO4F powder is mixed with acetylene black and polyvinylidene fluoride (PVDF) binder in a weight ratio of 7:2:1, followed by a ball-milling process at a speed of 500 rpm for 3 h with N-methyl-2-pyrrolidone (NMP) as the solvent. The as-prepared slurry is then coated onto the Al foil with a diameter of 1.6 cm and dried at 120 °C for 2 h. Cells are assembled in an argon-filled glove box. The electrochemical tests are performed galvanostatically between 1.0 V (or 1.5 V) and 4.5 V (or 4.3 V) at different current densities (1 C = 124 mA g−1), conducted on a battery test system of LAND CT-2001A (Wuhan, China). For the ex situ XRD and ex situ XPS measurements, the samples are charged or discharged to various potentials at a rate of C/20 at 30 °C. Afterward, the cells are disassembled to obtain the electrodes. The electrodes are washed several times by PC and DMC, dried in argon-filled glove box, and then used for the ex situ XRD and ex situ XPS measurements. Before ex situ XPS tests, the electrodes were etched into a depth of 10 nm to remove the SEI layer. The specific capacity is calculated based on the net mass of Na2MnPO4F. All of the following potentials mentioned are in reference to the Na+/Na couple, unless specified otherwise.
:1 v/v) with Na foil as the anode. To obtain the cathode slurry, the Na2MnPO4F powder is mixed with acetylene black and polyvinylidene fluoride (PVDF) binder in a weight ratio of 7:2:1, followed by a ball-milling process at a speed of 500 rpm for 3 h with N-methyl-2-pyrrolidone (NMP) as the solvent. The as-prepared slurry is then coated onto the Al foil with a diameter of 1.6 cm and dried at 120 °C for 2 h. Cells are assembled in an argon-filled glove box. The electrochemical tests are performed galvanostatically between 1.0 V (or 1.5 V) and 4.5 V (or 4.3 V) at different current densities (1 C = 124 mA g−1), conducted on a battery test system of LAND CT-2001A (Wuhan, China). For the ex situ XRD and ex situ XPS measurements, the samples are charged or discharged to various potentials at a rate of C/20 at 30 °C. Afterward, the cells are disassembled to obtain the electrodes. The electrodes are washed several times by PC and DMC, dried in argon-filled glove box, and then used for the ex situ XRD and ex situ XPS measurements. Before ex situ XPS tests, the electrodes were etched into a depth of 10 nm to remove the SEI layer. The specific capacity is calculated based on the net mass of Na2MnPO4F. All of the following potentials mentioned are in reference to the Na+/Na couple, unless specified otherwise.
3. Results and discussion
The atomic ratio of Na:Mn:P confirmed by ICP-AES is close to 2:1:1, which is consistent with the stoichiometric ratio of Na2MnPO4F. The carbon content in the Na2MnPO4F/C composite is detected to be 10.5 wt%. Fig. 2 shows the XRD pattern of Na2MnPO4F. This confirms that the phase-pure Na2MnPO4F is successfully synthesized as all of the Bragg peaks can be completely indexed to a monoclinic structure with a symmetry of P21/n. The lattice parameters refined with Jade 5.0 software are a = 13.6634 Å, b = 5.3197 Å, c = 13.6326 Å, β = 119.4383° and V = 862.95 Å3. The obtained data are similar to what reported in the ref. 16, 17 and 22.
 | ||
| Fig. 2 XRD pattern of Na2MnPO4F/C material. | ||
To confirm the chemical valence of elements in Na2MnPO4F, the X-ray photoelectron spectroscopy (XPS) is conducted as shown in Fig. 3. The binding energy of Mn 2p3/2 (641.7 eV) and Mn 2p1/2 (653.7 eV) is consistent with the results reported by Li et al.,23 which identifies the existence of Mn2+ in Na2MnPO4F. We also conduct the ex situ XPS measurements of Mn 3s to prove the existence of Mn2+ and study the variation trend of Mn valence during charge/discharge (in ESI Fig. S1 and Table S1†), and from Fig. 3b, the binding energy peaks indexed at 284.8 eV and 288.7 eV are identified as the C 1s signal from the decomposition of citric acid.24 In another two XPS spectra, the peak positions of P 2p and F 1s are located at 133.0 eV and 683.9 eV, respectively.
 | ||
| Fig. 3 XPS spectra of (a) Mn 2p, (b) C 1s, (c) P 2p and (d) F 1s of Na2MnPO4F/C material. | ||
The morphologies of the precursor and the Na2MnPO4F/C nanocomposite are observed by the SEM images as shown in Fig. 4. According to the SEM images of the precursor (Fig. 4a and b) synthesized by spray drying, the hollow spheres with an average diameter about 1–5 μm are distinctly observed, and the thickness of the hollow spheres is approximately several hundred nanometres. After sintering (Fig. 4c and d), the spherical particles break down and agglomerate into micro-scaled secondary particles, which consist of interconnected primary particles in the diameter of less than 100 nm. Thus, such porous micro-scaled structure composed of nanoparticles is in favor of the immersion of the electrolyte by increasing the contact area between the electrode material and electrolyte, i.e., an excellent electrochemical performance of the as-prepared Na2MnPO4F/C can be expected. As observed in the TEM images (Fig. 5a), the sizes of primary particles are also confirmed as tens of nanometres. Furthermore, the characterization of the distribution of the amorphous carbon and Na2MnPO4F particles in the nanocomposites has been conducted by high-resolution transmission electron microscopy (HRTEM) techniques. In the HRTEM image (Fig. 5b), we can define the regions with lattice as Na2MnPO4F and those without lattice as amorphous carbon. Two crystal planes of (020) and (−206) are indicated with d-spacing values of 0.266 and 0.225 nm, and the phenomenon can be observed that the uniformly dispersive nanocrystallites (∼10 nm) are homogeneously co-embedded in the amorphous carbon layer networks. The complementary structure containing nanocrystallites and carbon matrix could guarantee the enhanced electrochemical performance as what we reported in another polyanion-type Li2FeSiO4/C material.25
 | ||
| Fig. 4 SEM images of (a) and (b) spherical precursor and (c) and (d) Na2MnPO4F/C material. | ||
 | ||
| Fig. 5 (a) TEM and (b) HRTEM images of Na2MnPO4F/C material. | ||
The distribution of each element in the Na2MnPO4F material and precursor is measured by EDS elemental mappings in Fig. 6. As for the mapping spectra of the product (Fig. 6b–g), all of the elements exhibit uniform distribution. In particular, the mapping spectrum of well-distributed carbon agrees with the observation in HRTEM, which exhibits the uniform distribution of Na2MnPO4F nanocrystallites and carbon. The similar phenomenon can also be easily observed in the mapping spectra of the precursor (Fig. 6i–n), where all of the elemental mappings show coherent elemental enrichment corresponding to the shape of the spherical precursor. The results indicate that the raw reagents have been homogenously mixed in the stirring process, ensuring the homogeneity of the obtained product.
 | ||
| Fig. 6 SEM images of (a) Na2MnPO4F/C material and (h) spherical precursor. EDS elemental mappings of (b) C, (c) O, (d) F, (e) Na, (f) P, (g) Mn for Na2MnPO4F/C and (i) C, (j) O, (k) F, (l) Na, (m) P, (n) Mn for the precursor. | ||
We could imagine that the spherical precursor decomposes and crystallizes into Na2MnPO4F nanocrystallites when sintered. Moreover, the decomposed amorphous carbon could act as the dispersant to distribute the reduced-size Na2MnPO4F nanocrystallites homogenously. As shown in the schematic plot of the Na2MnPO4F/C nanocomposite networks (Fig. 7), the electrons can rapidly flow towards the surface of nanocrystallites through the carbon networks to conduct the charge-transfer reaction. Furthermore, the sodium ions diffuse in the nanocomposite or in the void among the amorphous carbon. Therefore, the ionic conductivity is elevated by the short ion diffusion paths in the smaller-sized nanocrystallites. In addition, the electronic conductivity can also be improved by increasing the contacting area between the amorphous carbon networks and the co-embedded Na2MnPO4F nanocrystallites. Thus, this specific structure makes significant contributions toward achieving the high electrochemical performance of Na2MnPO4F.
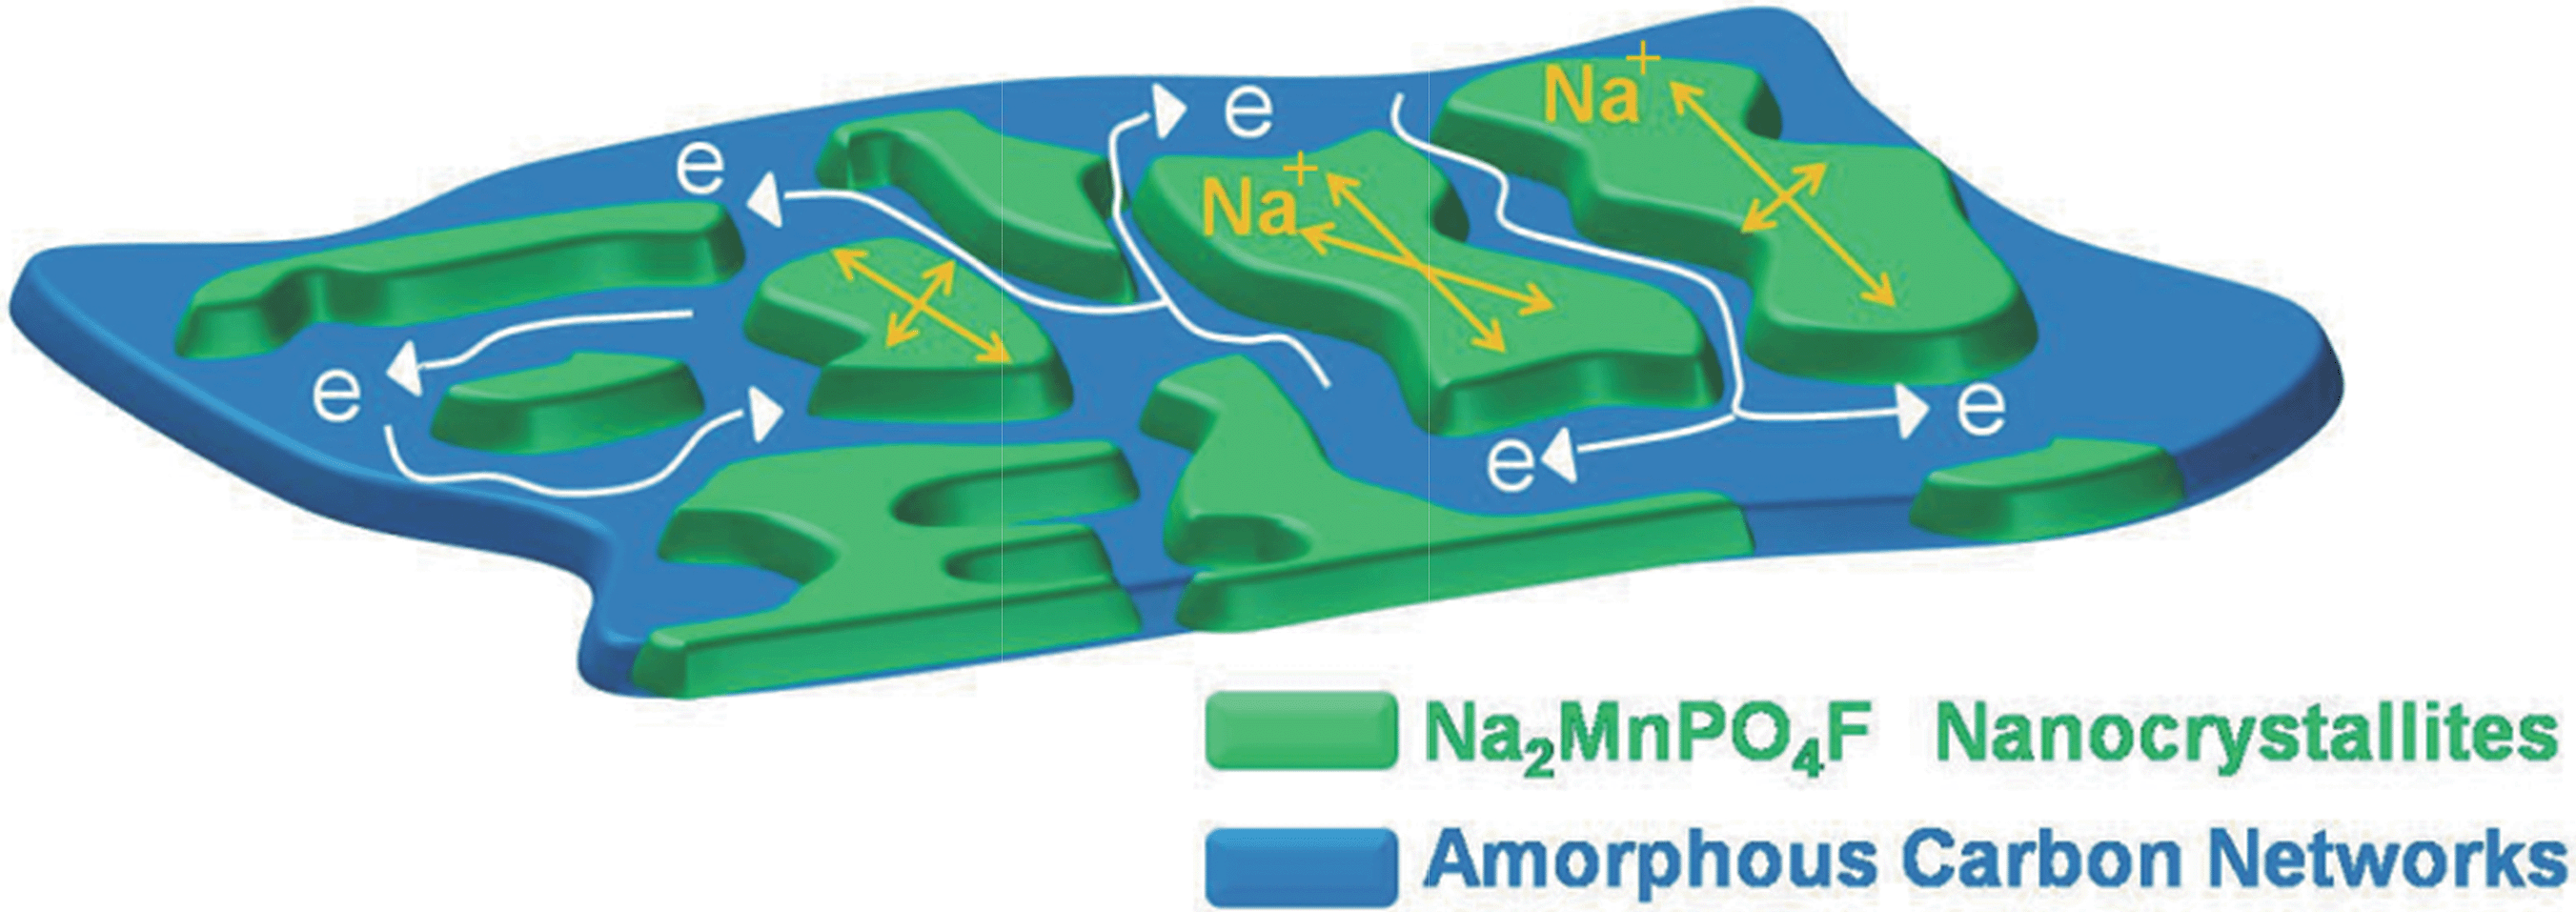 | ||
| Fig. 7 Schematic plot of Na2MnPO4F/C nanocomposite networks. | ||
Fig. 8a and b show the electrochemical performance of Na2MnPO4F/Na cells tested in the voltage range of 1.5–4.5 V at a current density of 6.2 mA g−1 at 30 °C. The discharge capacities in the first three cycles are 106, 90 and 84 mA h g−1, respectively. It can still retain 63 mA h g−1 after 50 cycles. Moreover, the coulombic efficiency gradually stabilizes as >95%, as shown in Fig. 8b.
 | ||
| Fig. 8 (a) Charge/discharge profiles of Na2MnPO4F/Na cells over 1.5–4.5 V at the current density of 6.2 mA g−1 at 30 °C. (b) The corresponding cyclic performance and coulombic efficiency. | ||
However, we choose a wide voltage range of 1.0–4.5 V in further study for the following reasons: (1) the low electronic/ionic conductivity and the resultant potential polarization or hysteresis in Mn-based polyanion materials;2,17 (2) it is convenient to compare our work with the few report on the Na2MnPO4F/Na cell before in the same voltage range;22 (3) and, most importantly, we need complete and detailed information on the electrochemical performance and structural changes in the Na2MnPO4F/Na cell. Therefore, a full working potential range is necessary for current study and future development.
Fig. 9a–c show the electrochemical performance of Na2MnPO4F/Na cells tested at a current density of 6.2 mA g−1 at 30 °C in the voltage range of 1.0–4.5 V. The initial discharge capacity is nearly 140 mA h g−1. Observed from the similar charge and discharge curves in different cycles, it is easily speculated that no apparent structural changes occur in the electrode material during cycling. The corresponding cyclic performance is shown in Fig. 9b. The discharge capacity decreases from 140 mA h g−1 to 116 mA h g−1 in first three cycles. Subsequently, the decreasing trend slows down to keep a capacity of 50 mA h g−1 in the 50th cycle. As shown in Fig. 9c, the rate capability of Na2MnPO4F/C is evaluated for the first time. When the current rate increases from 0.05C to 1C, the initial discharge capacity decreases from 140 mA h g−1 to 60 mA h g−1. The acceptable rate capability is obtained in our work, compared with other Mn-based polyanion materials like Na2MnP2O7.10 Therefore, by our synthetic method, the highly electrochemically active Na2MnPO4F/C material is experimentally achieved as we expected.
 | ||
| Fig. 9 (a) Charge/discharge profiles of Na2MnPO4F/Na cells over 1.0–4.5 V at the current density of 6.2 mA g−1 at 30 °C. (b) The corresponding cyclic performance. (c) Rate capability of Na2MnPO4F/Na cells cycling at different current densities in the first cycle. | ||
When tested at 55 °C in the voltage range of 1.0–4.3 V, as demonstrated in Fig. 10, the Na2MnPO4F/Na cell exhibits an enhanced electrochemical performance. Owing to the advantages of Na2MnPO4F, a 2-alkaline metal atom polyanion material, the theoretical capacity of Na2MnPO4F can reach as high as 248 mA h g−1. With the higher redox potential of Mn over Fe, the possible high capacity makes it probable that the higher energy density can be achieved. As for Na2MnPO4F/Na cell cycling at 55 °C, the discharge capacities in first three cycles are 178, 167, and 166 mA h g−1, respectively. Even after 20 cycles, it can still deliver a high capacity of 135 mA h g−1. To the best of our knowledge, the impressive capacity is higher than the results previously reported in the literature for Na2MnPO4F/Na cells. The higher electrochemical activity at high temperatures may be originated from the faster transfer of ions and electrons. When cycling at 55 °C, it is also worth noting that not only an increasing capacity but also a decreasing polarization can be observed from the charging and discharging curves. To analyze this phenomenon accurately, we compare the differential capacity plots in the first cycle of Na2MnPO4F/Na cells tested at 30 °C with that at 55 °C (Fig. 11). According to the plots, we find some obvious differences; i.e., the sharper redox peaks and the smaller voltage gaps between oxidation and reduction peaks are observed in the case of 55 °C. The main oxidation and reduction peaks can be indexed at 3.8 V and 3.3 V (voltage gap: 0.5 V) from dQ/dV plots at 30 °C, whereas in the case of 55 °C, the indexed peaks are at 3.75 V and 3.55 V (voltage gap: 0.2 V), respectively. The position of oxidation peak at 55 °C is consistent with the calculated result in Zheng's report on the average extraction voltage of the first 0.5 Na+ (3.71 V) and the second 0.5 Na+ (3.76 V).26 Therefore, the reaction in Na2MnPO4F/Na cells would be closer to the thermodynamic equilibrium state when cycling at 55 °C than that at 30 °C.
 | ||
| Fig. 10 (a) Charge/discharge profiles of Na2MnPO4F/Na cells over 1.0–4.3 V at the current density of 6.2 mA g−1 at 55 °C. (b) The corresponding cyclic performance. | ||
 | ||
| Fig. 11 The comparison of differential capacity plots in the first cycle tested at 30 °C with that at 55 °C. | ||
Considering the large polarization of Na2MnPO4F in charge and discharge at 30 °C, we apply the galvanostatic intermittent titration technique (GITT) to investigate the quasi-equilibrium state during cycling (Fig. 12a). The GITT experiment is measured by charging or discharging for 0.5 h at a current density of 6.2 mA g−1, followed by a relaxation time for 1.5 h at 30 °C. As shown in Fig. 12a, the curves connected by relaxed states show the characteristic of small polarization, and the initial discharge capacity reaches 148 mA h g−1, which is slightly higher than that tested in the common pattern at 30 °C. An obvious charge plateau is observed at around 3.75 V, in accordance with the result tested at 55 °C. Moreover, a discharge plateau above 3.6 V is observed, which is even a little higher than 3.55 V at 55 °C. The smaller voltage gap (voltage gap: 0.15 V) between the first-cycle charge and discharge plateaus indicates the reduced polarization at a low current density with a relaxation process. The actual curves, nearly without the effect of polarization, would be in favor of the study in Na2MnPO4F/Na cell system.
 | ||
| Fig. 12 (a) The galvanostatic intermittent titration technique (GITT) measured by charging and discharging for 0.5 h at the current density of 6.2 mA g−1 followed by a relaxation time of 1.5 h at 30 °C. (b) The calculated values of –logDGITT. | ||
In Fig. 12b, the diffusion coefficient of the sodium ion (DGITT) in the Na2MnPO4F/Na cell is calculated according to the GITT experiment (the calculation details are shown in the ESI†). The calculated result shows that the Na+ diffusion coefficient is gradually stable at around 10−16–10−17 cm2 s−1 when discharging. The low diffusion coefficient of Na2MnPO4F in the sodium-ion battery may be explained by the intrinsic limits of the accommodation between the polyanionic framework and the larger sodium ion, which was also quantitatively studied by Zhu et al.9 The low chemical diffusion coefficient in these Na-based polyanion materials, i.e. NaFePO4 or Na2MnPO4F, could partially explain their poor electrochemical performances.7,9,16,17,22,27
The structural changes of electrode materials during charge and discharge are one of the major factors that influence the electrochemical and cyclic performance of batteries. Ex situ XRD measurements are reasonably carried out to determine the structural reversibility and stability of Na2MnPO4F during the first cycle (Fig. 13) and after some specific cycles (Fig. 14) in sodium-ion batteries. From the XRD patterns of different charge and discharge states in the first cycle (Fig. 13), we conclude that the crystalline phase of Na2MnPO4F can be confirmed in all patterns, and no obvious new phases exist. Moreover, it can be easily observed that nearly all of the diffraction peaks gradually move to the higher 2θ values when charging to 4.5 V, with the broadening of diffraction peaks. The opposite phenomenon exists when discharging to 1.0 V. The good structural reversibility is proven by the slightly reversible movement of peaks, which shift back to the pristine position in fully discharged states. In addition, the ex situ XRD patterns after 1, 10, 20 and 30 cycles (Fig. 14) are all consistent with that of the pristine sample, and it is easily confirmed that the structure can be maintained even after 30 cycles. The good structural reversibility and stability demonstrate that the 3-D framework structure of Na2MnPO4F is not remarkably impacted by the insertion and extraction of sodium ions during cycling. The good structural stability concluded from the ex situ XRD measurements agree well with the similar charge/discharge curves as previously mentioned. Excluding the influence of structural changes, the decay of the electrochemical capacity observed in Fig. 7 may be due to the interfacial issues of the electrodes when charged to a high voltage.28
 | ||
| Fig. 13 Ex situ XRD patterns of Na2MnPO4F at various charged states in the first cycle over 1.0–4.5 V. | ||
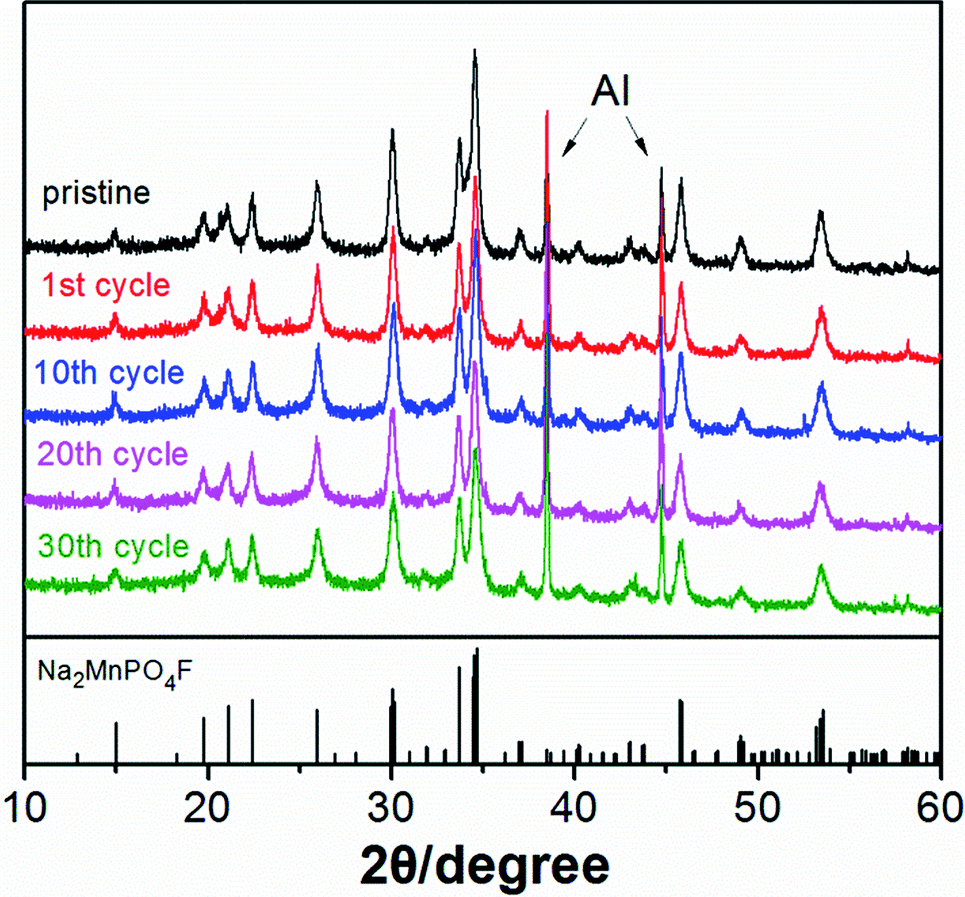 | ||
| Fig. 14 Ex situ XRD patterns of Na2MnPO4F after different cycles. | ||
4. Conclusions
In summary, the highly active Na2MnPO4F/C nanocomposite material is synthesized by the spray drying and high-temperature sintering method. The crystalline purity of Na2MnPO4F, with 3-D structure and symmetry of P21/n, is confirmed by the XRD pattern. The high activity of Na2MnPO4F/C can be explained as follows: (1) the homogeneous carbon distribution; (2) the better immersion of electrolytes in the porous secondary particles; (3) and the elevation of ionic and electronic conductivity owing to the specific composite structure. Therefore, the impressive electrochemical activity of Na2MnPO4F/C is achieved with an initial discharge capacity of 140 and 178 mA h g−1 at 30 °C and 55 °C, respectively. Moreover, Na2MnPO4F delivers a discharge capacity of 135 mA h g−1 even after 20 cycles at 55 °C.Acknowledgements
The authors acknowledge the financial support of the National Basic Research Program of China (973 program, Grant no. 2011CB935903) and the National Natural Science Foundation of China (Grant nos 21233004 and 21021002) to their research.Notes and references
- M. Armand and J. M. Tarascon, Nature, 2008, 451, 652–657 CrossRef CAS PubMed
.
- Z. Gong and Y. Yang, Energy Environ. Sci., 2011, 4, 3223–3242 CAS
- V. Palomares, M. Casas-Cabanas, E. Castillo-Martinez, M. H. Han and T. Rojo, Energy Environ. Sci., 2013, 6, 2312–2337 CAS
- V. Palomares, P. Serras, I. Villaluenga, K. B. Hueso, J. Carretero-Gonzalez and T. Rojo, Energy Environ. Sci., 2012, 5, 5884–5901 CAS
- M. D. Slater, D. Kim, E. Lee and C. S. Johnson, Adv. Funct. Mater., 2013, 23, 947–958 CrossRef CAS
- S. P. Ong, V. L. Chevrier, G. Hautier, A. Jain, C. Moore, S. Kim, X. Ma and G. Ceder, Energy Environ. Sci., 2011, 4, 3680–3688 CAS
- S.-M. Oh, S.-T. Myung, J. Hassoun, B. Scrosati and Y.-K. Sun, Electrochem. Commun., 2012, 22, 149–152 CrossRef CAS PubMed
- R. Tripathi, S. M. Wood, M. S. Islam and L. F. Nazar, Energy Environ. Sci., 2013, 6, 2257–2264 CAS
- Y. Zhu, Y. Xu, Y. Liu, C. Luo and C. Wang, Nanoscale, 2013, 5, 780–787 RSC
- P. Barpanda, T. Ye, M. Avdeev, S.-C. Chung and A. Yamada, J. Mater. Chem. A, 2013, 1, 4194–4197 CAS
- C. S. Park, H. Kim, R. A. Shakoor, E. Yang, S. Y. Lim, R. Kahraman, Y. Jung and J. W. Choi, J. Am. Chem. Soc., 2013, 135, 2787–2792 CrossRef CAS PubMed
- J. Zhao, J. He, X. Ding, J. Zhou, Y. o. Ma, S. Wu and R. Huang, J. Power Sources, 2010, 195, 6854–6859 CrossRef CAS PubMed
- K. Chihara, A. Kitajou, I. D. Gocheva, S. Okada and J.-i. Yamaki, J. Power Sources, 2013, 227, 80–85 CrossRef CAS PubMed
- R. A. Shakoor, D.-H. Seo, H. Kim, Y.-U. Park, J. Kim, S.-W. Kim, H. Gwon, S. Lee and K. Kang, J. Mater. Chem., 2012, 22, 20535–20541 RSC
- B. L. Ellis, W. R. M. Makahnouk, Y. Makimura, K. Toghill and L. F. Nazar, Nat. Mater., 2007, 6, 749–753 CrossRef CAS PubMed
- N. Recham, J.-N. Chotard, L. Dupont, K. Djellab, M. Armand and J.-M. Tarascon, J. Electrochem. Soc., 2009, 156, A993–A999 CrossRef CAS PubMed
- X. Wu, J. Zheng, Z. Gong and Y. Yang, J. Mater. Chem., 2011, 21, 18630–18637 RSC
- Y. Kawabe, N. Yabuuchi, M. Kajiyama, N. Fukuhara, T. Inamasu, R. Okuyama, I. Nakai and S. Komaba, Electrochem. Commun., 2011, 13, 1225–1228 CrossRef CAS PubMed
- J.-M. Tarascon, Philos. Trans. R. Soc., A, 2010, 368, 3227–3241 CrossRef PubMed
- J. Barker, M. Y. Saidi and J. L. Swoyer, J. Electrochem. Soc., 2003, 150, A1394–A1398 CrossRef CAS PubMed
- J. Molenda, W. Ojczyk and J. Marzec, J. Power Sources, 2007, 174, 689–694 CrossRef CAS PubMed
- S.-W. Kim, D.-H. Seo, H. Kim, K.-Y. Park and K. Kang, Phys. Chem. Chem. Phys., 2012, 14, 3299–3303 RSC
- Y.-X. Li, Z.-L. Gong and Y. Yang, J. Power Sources, 2007, 174, 528–532 CrossRef CAS PubMed
- J. Du, L. Jiao, Q. Wu, Y. Liu, Y. Zhao, L. Guo, Y. Wang and H. Yuan, Electrochim. Acta, 2013, 103, 219–225 CrossRef CAS PubMed
- J. Bai, Z. Gong, D. Lv, Y. Li, H. Zou and Y. Yang, J. Mater. Chem., 2012, 22, 12128–12132 RSC
- Y. Zheng, P. Zhang, S. Q. Wu, Y. H. Wen, Z. Z. Zhu and Y. Yang, J. Electrochem. Soc., 2013, 160, A927–A932 CrossRef CAS PubMed
- K. Zaghib, J. Trottier, P. Hovington, F. Brochu, A. Guerfi, A. Mauger and C. M. Julien, J. Power Sources, 2011, 196, 9612–9617 CrossRef CAS PubMed
- X. Wu, Z. Gong, S. Tan and Y. Yang, J. Power Sources, 2012, 220, 122–129 CrossRef CAS PubMed
Footnote |
| † Electronic supplementary information (ESI) available. See DOI: 10.1039/c4ra05336b |
| This journal is © The Royal Society of Chemistry 2014 |