 Open Access Article
Creative Commons Attribution 3.0 Unported Licence
Effect of carbonate anions on Bi-doped Ca2Ru2O7 pyrochlores that are potential cathode catalysts for low temperature carbonate fuel cells
Cathryn A.
Hancock
*,
Ai Lien
Ong
and
John R.
Varcoe
Department of Chemistry, Faculty of Engineering and Physical Sciences, University of Surrey, Guildford, GU5 0UW, UK. E-mail: cathrynhancock@hotmail.co.uk; Tel: +44 1483 686838
First published on 23rd June 2014
Abstract
This ex situ electrochemical study investigates how the oxygen reduction reaction (ORR) on Bi-doped Ca2Ru2O7 pyrochlore catalysts is affected by the addition of carbonate to the aqueous KOH (1 mol dm−3) electrolyte. The parent Ca2Ru2O7 catalyst has been previously reported to be selective towards the generation of CO32− on the reaction of O2 with CO2 (in the presence of H2O) at the cathode of low temperature alkaline polymer electrolyte fuel cells containing alkaline anion-exchange membranes (AAEM): a target is to develop low temperature carbonate fuel cells involving CO32− conduction through the AAEM (for potential CO2 utilisation). Rotating ring disk electrode (RRDE) voltammetry was used to probe the ORR behaviours of Ca2Ru2−xBixO7−y catalysts with x = 0.25, 0.5, 0.75, and 1. The results show that as more Bi was doped into the pyrochlore catalysts, the poorer the on-set potentials compared to the parent Ca2Ru2O7 (which itself yielded a poorer on-set potential to a benchmark Pt black catalyst). Higher levels of Bi-doping tended to reduce n values with higher levels of peroxide generated: all of the pyrochlore catalysts tested gave higher peroxide yields compared to the Pt black benchmark. However, the presence of CO32− in the O2-saturated KOH (1 mol dm−3) electrolyte appeared to improve kinetic performance of the Bi-doped pyrochlore catalysts (the effect being greatest with the x = 0.75 catalyst).
Introduction
Fuel cell technology has many advantages compared to other energy generation/conversion techniques including higher efficiencies and potentially lower (local) emissions of greenhouse gases. There are many types of fuel cell with the proton-exchange membrane fuel cells (PEMFC) being the most widely known and developed low temperature option. However research on alkaline fuel cells (AFCs), including AFCs containing aqueous KOH electrolytes is still continuing due to the limitations of the PEMFCs, primarily the requirement for costly metal catalysts and poorer oxygen reduction reaction (ORR) kinetics at low pHs.1–7 The use of alkaline polymer electrolyte fuel cells (APEFCs) promises to address many of the shortcomings of the PEMFCs by replacing the proton-exchange membrane with alkaline anion exchange membranes (AAEMs conduct anions such as OH− and/or CO32−).8Traditional AFCs/APEFCs operate with OH− cycles: however, an intriguing possibility is to operate APEFCs with CO32− anion cycles, especially as there are reports that AAEMs can conduct CO32− anions with reasonable conductivities of ca. 30 mS cm−1.9 The most debilitating aspect of using the OH− cycles is the degradation of the AAEMs by the OH− ions that are produced via the traditional ORR at the cathode (eqn (1)):
| O2 + 2H2O + 4e− → 4OH− | (1) |
The OH− anions are excellent nucleophiles and can displace the cationic head-groups of the AAEMs (commonly quaternary ammonium groups) via a multitude of degradation mechanisms.10 An AAEM-containing CO32− cycle system, as advocated by Kohl11 and Mustain,2 combats this by replacing the OH− with less nucleophilic CO32− (such that AAEMs that are unstable to OH−-containing electrolytes are chemically stable).3–5 Using the CO3− cycle therefore increases the lifetime of the AAEM and may also improve the hydrogen oxidation reaction (HOR) kinetics at the anode.4
The challenge with developing a CO32− cycle system is the need for an electrode which absorbs CO2 in preference to water in order to generate CO32− selectively over OH− anions on reaction with O2 at the cathode.2–4,12,13 In addition to this, for the cathode catalyst to be effective in a low temperature carbonate fuel cell, it needs to have high electrical conductivity and electrochemical activity to facilitate the electron transfer processes and activate the O2 double bond.14–16 Currently only one CO32− selective catalyst has been reported: the Ca2Ru2O7 (RuV) pyrochlore.2,4,13 The alkaline earth metal on the A site produces a catalyst with a high surface basicity: because CO2 is a stronger Lewis acid than water, this leads to preferential absorption of CO2. The B site introduces a metal with ORR activity in alkaline media, which in this case is Ru.
A low temperature carbonate fuel cell works as shown in Fig. 1. The CO32− anions are produced from the selective reduction of O2 and CO2 at the cathode (eqn (2)). The CO32− anions travel through the membrane (cathode → anode) where they oxidise the H2 at the anode (eqn (3)).11
| Cathode: 2CO2 + O2 + 4e− → 2CO32− | (2) |
| Anode: 2H2 + 2CO32− → 2H2O + 2CO2 + 4e− | (3) |
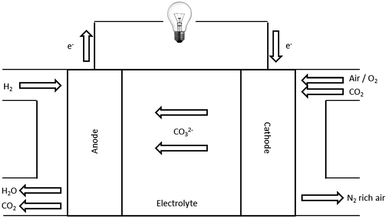 | ||
| Fig. 1 Schematic for a low temperature carbonate fuel cell. Adapted from Mustain et al.13 | ||
This initial study focuses on the synthesis of Bi-doped Ca2Ru2O7 catalysts, which has been shown in other prior studies to have novel conductivity properties as well as thermal and chemical stability.2,15,16 High surface area Ca2Ru2−xBixO7−y (x = 0, 0.25, 0.5, 0.75 and 1) catalysts were synthesised to determine the effect that the much cheaper Bi (compared to Ru) has on the catalysts' performance and behaviour: this was probed using the rotating ring disk electrode (RRDE) hydrodynamic voltammetry.
Experimental
Synthesis and structural analysis
Most pyrochlore systems are synthesised using the standard solid state reaction of base oxides. However in this case, when the base oxides were reacted together, a calcium ruthenate perovskite, CaRuO3 (RuIV), was produced instead of the target pyrochlore. The method used to produce this material was a reflux technique developed by Mustain et al.,2 where the KMnO4 was used as a replacement for oxygen in more traditional hydrothermal techniques. To begin with, an aqueous KMnO4 (10 mmol dm−3) solution was prepared by adding KMnO4 (BDH) to a aqueous KOH solution (1 mol dm−3, analytical grade, Fluka). CaO (BDH), RuCl3 (Ru content 45–55%, Acros Organics) and Bi2O3 (99.999%, Sigma Aldrich) were then added to the solution in the correct ratios to produce Ca2Ru2−xBixO7−y (x = 0, 0.25, 0.5, 0.75 and 1) and mixed thoroughly for 20 min at 80 °C. The solution was then refluxed at 200 °C for 24 h. Once cooled, the solution was filtered and washed with deionised water and heated overnight at 80 °C to dry. Powder X-ray diffraction (PANalytical Xpert Pro, λ = 1.5406 Å) was used to characterise the final catalysts. This technique was used to determine the phase purity of the materials as well as the structural properties of the system.Catalyst ink and rotating ring-disk electrode (RRDE) preparation
The catalysts to be ex situ electrochemically tested were first ground into small particles using a pestle and mortar for 10 min. Once sufficiently ground, the catalyst (0.01 g) was suspended in deionised water (4 cm3) and sonicated for 10 min. Propan-2-ol (1 cm3) was then added followed by a further 10 min of sonication. Finally, Nafion 117 (20 μL of supplied dispersion [5% mass in lower aliphatic alcohols, Alfa Aesar]) was added to the ink mixture with a final sonication for 10 min. Before all procedures, the rotating Pt-ring glassy-carbon(GC)-disk RRDE (Ametek, UK, disk area = 0.2475 cm2, ring inner diameter ∅ = 0.625 cm and ring outer diameter ∅ = 0.792 cm) was polished by gently moving in a figure of eight pattern on a Rayon Microcloth disk (Buehler) coated with an alumina slurry (particle size < 0.05 μm) and then thoroughly rinsed with deionised water. Before a 10 μL sample of the ink was pipetted onto the surface of the dry and clean RRDE, the catalyst ink was further sonicated for 10 min to ensure the ink was properly suspended. The inverted and catalysed RRDE was then spun at 600 rpm for 1 h at room temperature to dry the catalyst ink.Electrochemical procedure
All RRDE electrochemical experiments were conducted using an IviumStat bipotentiostat (supplied by Alvatek, UK). This instrument also contained an internal impedance analyser. The instrument was controlled using IviumSoft software (ver. 1.831). The RRDE rotation rates were controlled using a Pine rotator (supplied by Ametek). The collection efficiency (N = the ratio of ring current to disk current) of the catalyst-free and freshly polished RRDE was determined by submerging in a solution of aqueous potassium ferricyanide (K3Fe(CN)6, 10 mmol dm−3) in aqueous KCl (0.5 mol dm−3) and sweeping the disk potential between 0.5 V and −0.5 V vs. Ag/AgCl (3 mol dm−3 NaCl internal solution) reference electrode at a sweep rate = 10 mV s−1. The ring potential was set at 0.6 V vs. Ag/AgCl (3 mol dm−3 NaCl). N was measured for each RRDE rotation rate used. The RRDEs were submerged in deionised water for storage when not in use.The electrolytes used for the RRDE ORR studies were a mixture of an aqueous solution of KOH (1 mol dm−3, analytical grade, Fluka, used as supplied) and K2CO3 (Reagent grade, Fisher) in the following combination of concentrations: KOH (1 mol dm−3) only [for blank experiments], KOH (1 mol dm−3) + K2CO3 (0.01 mol dm−3), KOH (1 mol dm−3) + K2CO3 (0.05 mol dm−3), and finally KOH (1 mol dm−3) + K2CO3 (0.1 mol dm−3). The electrolytes were purged with N2 (99.999%, BOC) for 3 h to ensure the complete removal of CO2 from the solution. Each solution was then separated into 90 cm3 volume samples: one sample was purged with O2 for 1 h to achieve O2-saturation while the other solution was kept O2-free with continued purging with N2. The limited current did not increase further with longer purging times, which indicated O2 saturation was after 1 h of purging.
Once the electrolytes were fully oxygenated, a catalyst-free RRDE (as working electrode) was lowered into each electrolyte solution and the O2 purge pipe was lifted so as to blanket the surface solution with O2 [but not to mechanically disturb the solution (introduce unwanted convection)]. In addition, a reversible hydrogen electrode (Hydroflex RHE, Gaskatel) reference electrode and a Pt wire counter electrode (surface area significantly larger than the area of the RRDE working electrode: length = 50 cm and ∅ = 0.05 cm) were lowered into the solution. Immediately after immersion of the RRDE into each aqueous electrolyte under test, an impedance spectrum (frequency range 180 kHz to 96 Hz, voltage perturbation r.m.s. amplitude = 10 mV) was recorded to determine the uncompensated iR-correction. The background (catalyst-free RRDE) ORR testing was carried out by sweeping the disk potential from +1.00 to −0.30 V vs. RHE at 20 mV s−1: the ring potential was held at +1.2 V vs. RHE at all rotation speeds used for catalyst testing (200, 400, 600, 800, 1200 and 1600 rpm).
Once the catalyst-free Pt-ring GC-disk RRDE was determined to be clean [having a low electron transfer number (n) in the above background tests], the catalyst to be tested was placed on the RRDE as discussed above. Impedance measurements were then repeated with each catalysed RRDE to determine the uncompensated iR-correction required for each test. Initially, cyclic voltammograms were recorded at 50 mV s−1 between the potential limits +1.2 and 0 V vs. RHE in the N2 purged electrolytes for each catalysed RRDE. Following this, the catalysed RRDEs were then placed into the oxygenated electrolytes to perform the ORR measurements in a similar manner to the catalyst-free RRDE background tests: the reduction of O2 was carried out by sweeping the disk potential from +1.00 to −0.30 V vs. RHE at 20 mV s−1: the ring potential was held at +1.2 V vs. RHE. The measurements were repeated for each RRDE and electrolyte at 200 rpm until a stable response was obtained and then further ORR linear sweep voltammograms were recorded with increasing rotation speeds in the range 200–1600 rpm.
Results and discussion
Powder XRD characterisation
Fig. 2 shows the XRD patterns for the series of Ca2Ru2−xBixO7−y (x = 0, 0.25, 0.5, 0.75, and 1). The structures were determined to be cubic with the space group Fd![[3 with combining macron]](https://www.rsc.org/images/entities/char_0033_0304.gif) m and with the unit cell parameters presented in Table 1. Peaks due to Bi2O3 impurities are present in the x = 0.25 and x = 1 catalysts with the latter highly doped sample containing extensive impurities [hence the unit cell parameters were estimated using the (222) peak at 2θ = 30°]. The broad peaks are indicative of small particle sizes but due to the extreme broadness for the x = 0 sample it was not possible to calculate the unit cell parameter: however, Sato et al. provide unit cell parameters of 10.197(2) with their more crystalline sample yielding sharper peaks (and more accurate cell parameter determinations).17 Using this literature value, the cell volume increases on doping with Bi which is due to the increase in size of the Bi3+ (r = 117 pm, CN = 6) compared to the smaller Ru5+ (r = 70.5 pm, CN = 6).
m and with the unit cell parameters presented in Table 1. Peaks due to Bi2O3 impurities are present in the x = 0.25 and x = 1 catalysts with the latter highly doped sample containing extensive impurities [hence the unit cell parameters were estimated using the (222) peak at 2θ = 30°]. The broad peaks are indicative of small particle sizes but due to the extreme broadness for the x = 0 sample it was not possible to calculate the unit cell parameter: however, Sato et al. provide unit cell parameters of 10.197(2) with their more crystalline sample yielding sharper peaks (and more accurate cell parameter determinations).17 Using this literature value, the cell volume increases on doping with Bi which is due to the increase in size of the Bi3+ (r = 117 pm, CN = 6) compared to the smaller Ru5+ (r = 70.5 pm, CN = 6).
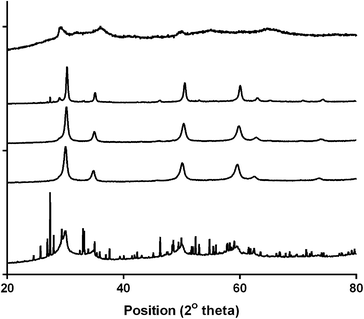 | ||
| Fig. 2 Powder XRD profiles of the Ca2Ru1−xBixO7−y catalysts synthesised. From top to bottom: x = 0, 0.25, 0.5, 0.75 and 1. | ||
| x | a/Å | Cell volume/Å3 | Particle size/nm |
|---|---|---|---|
| a The cell parameters were taken from literature17 due to the broadness of the XRD peaks. b The cell parameters were estimated from the (222) peak only due to the interferences from the impurities. | |||
| 0 | 10.197a | 1060.27a | — |
| 0.25 | 10.2115(2) | 1064.79(7) | 25 |
| 0.5 | 10.2423(2) | 1074.46(7) | 25 |
| 0.75 | 10.2847(3) | 1087.85(9) | 27 |
| 1 | 10.3142b | 1097.26b | 18 |
Cyclic voltammetry (CV)
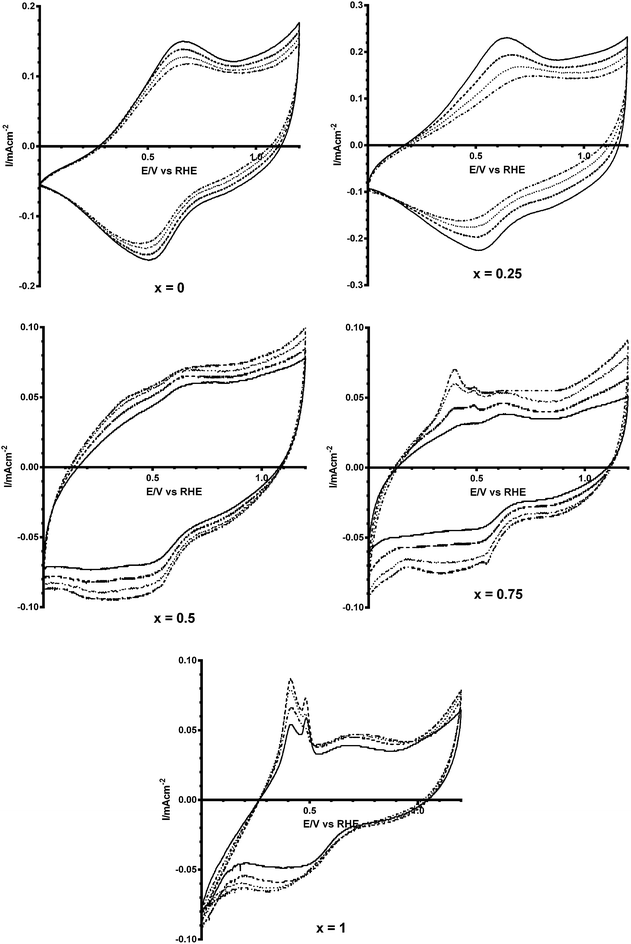
As shown in Fig. 3, there are no significant changes in the peak potentials when CO32− is added to the solution. For the undoped catalyst, the double layer region is wider when there is no CO32− in the system. However with increasing amounts of Bi3+ dopant in the catalysts this trend reverses where the highest concentration of CO32− yields the widest double layer.18 This is an initial indication that the Bi3+ doped catalysts have a sensitivity to CO32− anions. Additional features are seen in the CVs with the higher Bi content catalysts (x = 0.75 and x = 1): aqueous Bi3+/Bi+ cations have reduction potentials in the range 0.2–0.5 vs. RHE. The impurities present may also be responsible, but it should be kept in mind that the x = 0.25 catalyst contained more impurities than the x = 0.75 according to the XRD profiles (but the latter contained more redox features in the CVs).Calculation methods
Further investigations of the activities of the Ca2Ru1−xBixO7−y catalysts for the ORR through the OH− and CO32− pathways were investigated using the RRDE technique. The RRDE technique was chosen over Koutecký–Levich analysis of RDE data as the method for determining the n value (the number of e− reacting to reduce a single O2 molecule). With the RRDE method, the n value can be determined from the ratio between the ring and the disk currents (after the collection efficiency has been determined). However, Koutecký–Levich and subsequent Tafel analysis of RDE data is dependent on knowing the exact properties of the solution (O2 concentration, kinematic viscosity etc.), which will be problematic as: (a) it is time consuming to accurately measure the exact properties of each of the solutions, which will vary when different concentrations of CO32− are added to the aqueous KOH (1 mol dm−3); and (b) the exact electrochemical active surface areas of the catalyst are unknown (standard methods used for measuring electrochemical active surface areas for Pt/C catalysts cannot be directly translated into measuring this for catalysts such as those reported in this study). As will be shown later, n values obtained from Koutecký–Levich analyses are all higher with the Bi-doped catalysts compared to the n values calculated from the ratio of RRDE ring and disk currents (the preferred method in this study).For the RRDE method of calculating the electron transfer number, n, it is necessary to determine the collection efficiency of the electrode being used. This is determined experimentally by measuring data using a well-known redox system: in this case the ferrocyanide–ferricyanide system was used (a simple reversible n = 1 e− redox couple). This procedure to calculate collection efficiency has been performed extensively in the past: refer to Fig. 3 in ref. 19.
The (catalyst-free) Pt-ring GC-disk RRDE used in this study had an N value = 41%. N can then be used in eqn (4) and (5) along with the RRDE current data (at a potential of −0.3 V in these experiments) to determine the amount of HO2− yield (%) and the e− (n) per O2 for each catalyst and electrolyte:20
 | (4) |
 | (5) |
Rotating ring-disk electrode (RRDE) voltammetry
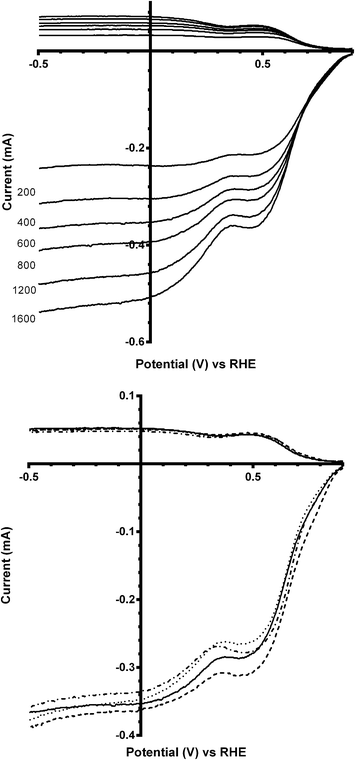
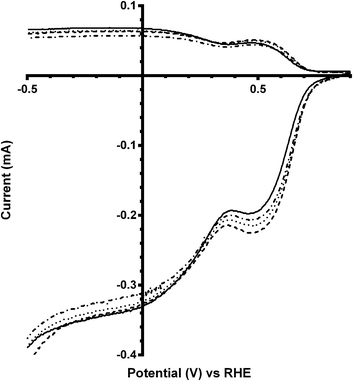
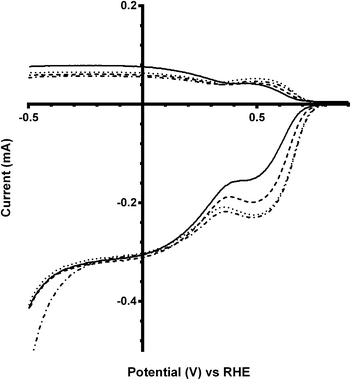
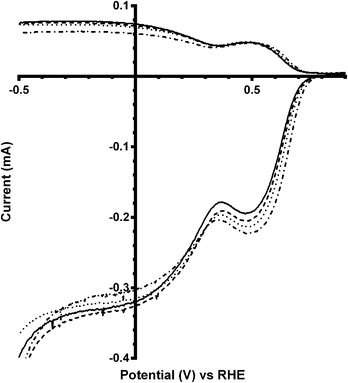
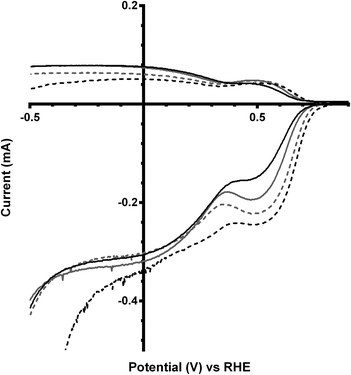
Linear sweep voltammograms (LSV) were performed on all the catalysts in different electrolytes (containing different concentrations of CO32−). Fig. 4 (top) shows the voltammogram at all rotation speeds for the parent catalyst Ca2Ru2O7 in aqueous KOH (1 mol dm−3). The inflections at ca. 0.3–0.5 V vs. RHE corresponds to the redox peaks observed in the cyclic voltammetry traces (Fig. 3) and are due to the reduction of Ru cations, which clearly introduces a second reduction wave. This redox peak feature is repeated with the Bi-doped catalysts. On addition of K2CO3 into the electrolyte, there were no significant changes in the form of the LSVs [Fig. 4 (bottom)] with the Bi-free parent catalyst: there was also no significant differences between the number of e− per O2 molecule reduction (nRRDE in Table 2) and on-set potentials (the lowest concentration of K2CO3 [0.01 mol dm−3] may even have led to a slightly improved on-set potential).| Concentration of K2CO3/mol dm−3 | n RRDE a | Peroxide yield (%) from RRDEa | n K–L b |
|---|---|---|---|
| a Arithmetic mean and sample standard deviations over all rotations rates. b Koutecký–Levich analyses conducted with the crude assumption that the addition of K2CO3 did not significantly alter the properties of the solution (e.g. O2 solubility, kinematic viscosity etc.). | |||
| 0 | 2.97 ± 0.02 | 51.3 ± 1.0 | 2.14 |
| 0.01 | 3.03 ± 0.03 | 48.7 ± 1.0 | 3.45 |
| 0.05 | 2.95 ± 0.02 | 52.6 ± 1.1 | 3.13 |
| 0.1 | 2.98 ± 0.03 | 51.0 ± 1.2 | 3.12 |
On doping with a small amount of Bi into the pyrochlore catalyst (x = 0.25), no significant difference in the nRRDE values were observed on addition of CO32− into the electrolyte (Fig. 5 and Table 3), while ORR on-set potentials were slightly shifted to less positive values (i.e. higher overpotentials). Both the on-set potentials and the n values were the same as the parent (Bi-free) catalyst for the K2CO3-free electrolyte (Fig. 6) indicating that a small level of Bi doping (x = 0.25) has no significant electrochemical effects. The parent compound has higher (more positive) ORR on-set potentials in the presence of CO32− (0.1 mol dm−3) compared to the x = 0.25 Bi-doped catalyst.
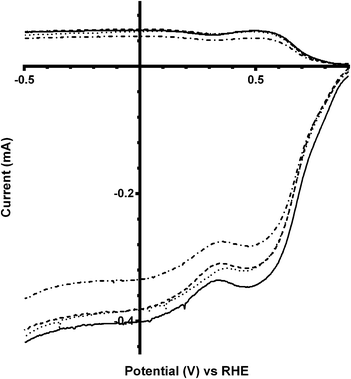
On addition of greater amounts of Bi with the x = 0.5 catalyst, there are visible shifts in the on-set potential to more positive potentials on addition of CO32− (e.g.Fig. 7). The on-set potentials remains at these more positive potentials with the continuing addition of K2CO3 in the electrolyte: this behaviour is different to the parent (Bi-free) system where only the addition of K2CO3 at the smallest 0.01 mol dm−3 concentration led to on-set potentials that were more positive compared to tests with the use of the K2CO3-free benchmark electrolyte. The n values were in general lower than with the Bi-free catalyst but, again, there is no significant increase in the n values with x = 0.5 Bi-doped catalysts on increasing concentrations of K2CO3 (Table 4).
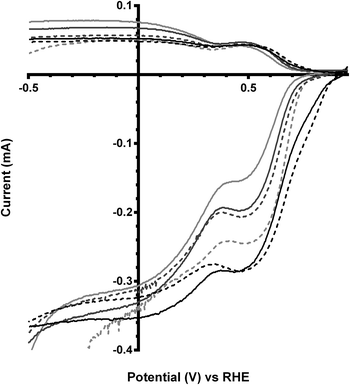
These trends continue for Ca2Ru1.25Bi0.75O6.25 catalyst, which has the greatest shift in on-set potentials on addition of CO32− into the electrolyte of all the catalysts studied (Fig. 8 and Table 5). The improvement in on-set potential on addition of CO32− surpasses that of the prior x = 0.5 Bi-doped catalyst, which again suggests that higher concentrations of K2CO3 in the electrolyte can improve the performances of the higher Bi-doped catalysts (Fig. 9). However, the improved on-set potentials for the x = 0.5 and x = 0.75 Bi-doped catalysts in the presence of CO32− are still less positive than those of the Bi-free parent catalyst in CO32−-free electrolyte: the n values are all lower as well.
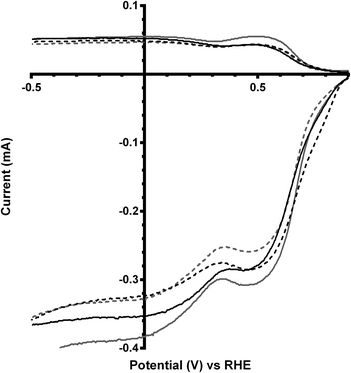
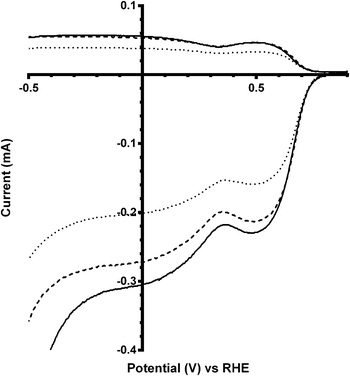
The final catalyst studied was the x = 1 sample (that contains significant levels of impurities). Again the on-set potentials shifted to more positive potentials, and the n values only slightly increased, on addition of CO32− (Fig. 10 and Table 6). Interestingly, the on-set potential is better than the previous Ca2Ru1.25Bi0.75O6.25 catalyst in the CO32−-free electrolyte (Fig. 11). However, interferences due to the Bi2O3 impurities cannot obviously be ruled out. Hence, a control experiment with Bi2O3 was conducted. This control experiment showed that Bi2O3 had a better on-set potential than the doped pyrochlore catalyst (Fig. 12): the increased on-set potential of the Ca2RuBiO6 catalyst (compared to Ca2Ru1.25Bi0.75O6.25) may well arise from the Bi2O3 impurities. However when CO32− was added to the electrolyte the on-set potential of the Bi2O3 control catalyst undesirably shifted to less positive potentials (not shown): this may explain why the improvement of on-set potential is less for the x = 1 catalyst compared to the x = 0.75 catalyst on addition of CO32−.
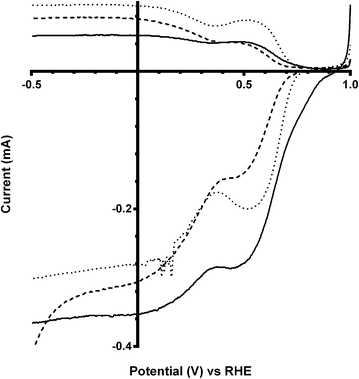 | ||
| Fig. 12 RRDE LSVs of Ca2Ru2−xBixO7−y (x = 0 solid line, x = 0.75 dashed line) and Bi2O3 (dotted line) in O2-saturated aqueous KOH (1 mol dm−3). Rotation rate = 600 rpm. | ||
Due to the Ca2Ru1.25Bi0.75O6.25 catalyst having the best response on addition of CO32− (and the most well defined powder XRD profile with the lease amount of impurities), it was decided to investigate the addition of even greater concentrations of K2CO3. On an increase to 0.5 mol dm−3, the on-set potential and n value did not vary significantly compared to the K2CO3 (0.1 mol dm−3) electrolyte. However there was a significant decrease in current in the diffusion limited region. This indicates significant changes in the properties of the solution and a lowering of the diffusion limited current defined by the Levich equation (eqn (6)):21,22
| iL = 0.62nFADo2/3ω1/2v−1/6Co | (6) |
As well as changing the ionic strength and pH of the solutions (which is why a RHE was used: the measured potentials using a Gaskatel RHE do not change with pH [unlike with the use of other hydrogen-based reference electrodes]), the addition of salts to the electrolyte can cause a decrease in both the O2 concentration and the diffusion coefficient. In conjunction with the rise in kinematic viscosity, this reduces the limiting current of the system. To determine whether the on-set potentials may be significantly affected by addition of too high a concentration of K2CO3, a lower concentration of 0.2 mol dm−3 was additionally tested. Again the on-set potential did not vary significantly, while the limiting current was intermediate between the 0.1 and 0.5 mol dm−3 K2CO3 tests (Fig. 13).
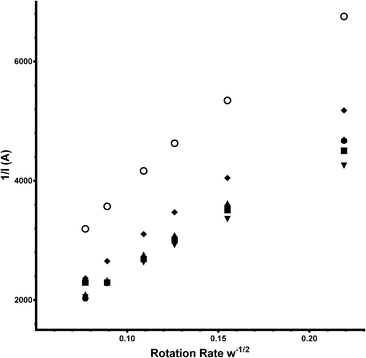
As seen in the Tables of data presented, the e−n value can also been calculated using the Koutecký–Levich equation (eqn (7) – a modified version of eqn (6):
| n = (1/slope)/0.62FD2/3v−1/6CoA | (7) |
![[thin space (1/6-em)]](https://www.rsc.org/images/entities/char_2009.gif) 485 C mol−1), D = the O2 diffusion coefficient (taken here as = 2.04 × 10⁻⁵ cm2 s−1), v = kinematic viscosity (taken here as = 0.01 cm2 s−1), Co = bulk concentration of O2 (taken here as = 7.8 × 10⁻⁷ mol cm−3), A = disk area (0.2475 cm2), and the gradient of the slopes are from the plots in Fig. 14 (for the Ca2Ru1.75Bi0.75O6.25 catalyst).
485 C mol−1), D = the O2 diffusion coefficient (taken here as = 2.04 × 10⁻⁵ cm2 s−1), v = kinematic viscosity (taken here as = 0.01 cm2 s−1), Co = bulk concentration of O2 (taken here as = 7.8 × 10⁻⁷ mol cm−3), A = disk area (0.2475 cm2), and the gradient of the slopes are from the plots in Fig. 14 (for the Ca2Ru1.75Bi0.75O6.25 catalyst).
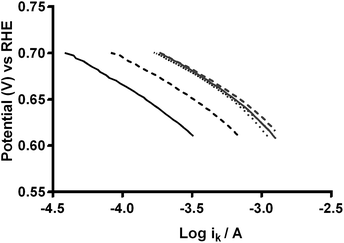
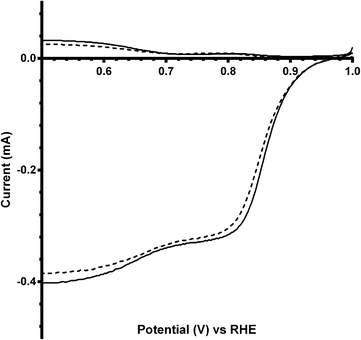
As stated earlier, the values for the various electrolyte parameters (e.g. O2 concentration etc.) are incorrect when K2CO3 is added to the electrolyte (more so with high concentrations): however, this shouldn't affect the values for the K2CO3-free aqueous KOH (1 mol dm−3) electrolyte (where the above values are well established). The reason for the discrepancies between the n values determined from the RRDE method (ratio of ring to disk currents) and K–L analyses may arise from the area A used in eqn (6) and (7). The A used in the calculation is the area of the GC-disk but the powdered catalyst will not fully cover the GC-disk and will cause other uncertainties in A as the catalyst layers will not flat when deposited: hence, the A values will be different for each catalyst with undetermined uncertainties and errors (which is why the RRDE is a preferred method for analysing the response with such catalysts). Further analysis of the data involved the Tafel plots for Ca2Ru1.25Bi0.75O6.25 in O2-saturated aqueous KOH (1 mol dm−3) with different concentrations of K2CO3 (see Fig. 15).23 The Tafel slopes for all concentrations of CO32− are similar. Interestingly, the curves are desirably shifted to the right with increasing concentrations of CO32− (with a plateau at 0.1 mol dm−3). This suggests that either the presence of CO32− enhances the ORR kinetics or that the mechanism or reaction occurring has changed.
Additional experiments were performed on a Pt black catalyst to compare with the parent pyrochlore catalyst. As seen in Fig. 16 the Pt black performs better than the Ca2Ru2O7 in both on-set potential and electron transfer number (Table 7) with the CO32−-free electrolyte. On the addition of the CO32− the electrolyte the on-set potential of the Pt black catalyst decreases (Fig. 17): however, the on-set potential is still significantly greater than that of those of the pyrochlore catalysts. This poorer performance in CO32−-containing solution compared to the CO32−-free solution is also seen with Tafel plots for Pt black (Fig. 18): the CO32−-free electrolyte gives higher ORR kinetic performances and confirms the prior work by Vega et al.1
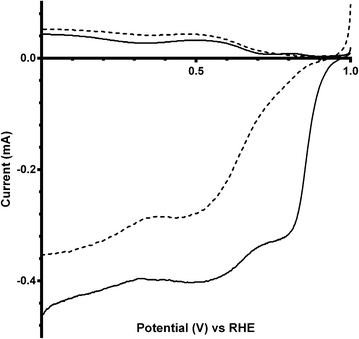 | ||
| Fig. 16 RRDE LSV comparison of Ca2Ru2O7 (dashed) and Pt black (solid) in O2-saturated KOH (1 mol dm−3) at 600 rpm. | ||
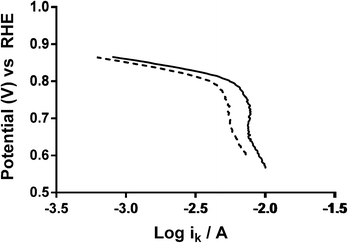 | ||
| Fig. 18 Tafel plots of Pt black in O2-saturated aqueous KOH (1 mol dm−3) with varying concentrations of K2CO3: solid = K2CO3-free and dashed = 0.1 mol dm−3. | ||
Conclusions
The ex situ oxygen reduction reaction (ORR) activity of Ca2Ru2−xBixO7−y (x = 0, 0.25, 0.5, 0.75 and 1) pyrochlore catalysts were investigated, in aqueous KOH (1 mol dm−3) electrolytes in both the absence and presence of K2CO3, using rotating ring disk electrode (RRDE) studies. The synthesis of the x = 1 example was less successful than the others with significant levels of Bi2O3 impurities (electroactive in its own right). The additional of CO32− to the electrolyte generally improved the electrode kinetics of the pyrochlore catalysts and gave more positive on-set potentials (compared to the CO32−-free electrolytes), especially with higher levels Bi-doping (e.g. the x = 0.75 example). There was a significant decrease in the on-set potentials (shift to less positive values) for the pyrochlore catalysts compared to a Pt black benchmark even with the addition of CO32− into the system. All pyrochlore catalysts gave higher peroxide yields compared to the Pt black benchmark catalyst: peroxide yields were higher with the Bi-doped catalysts compared to the Bi-free pyrochlore parent catalyst.This ex situ study shows that such Ca2Ru2−xBixO7−y pyrochlore catalysts have unusual ORR behaviours in aqueous alkali electrolytes in the presence of CO32− anions and this warrants further fundamental studies. Future studies should also investigate the in situ performances of the catalysts in fuel cells with an O2(air)/CO2 mix feeds at the cathode further probe the properties of the catalyst and to investigate if such catalysts operate via carbonate cycles in low temperature carbonate fuel cells containing anion-exchange membranes.
Acknowledgements
The authors like to thank the UK's Engineering & Physical Sciences Research Council (EPSRC) for funding grant EP/I004882/1. The IviumStat bipotentiostat used was purchased using funding from EPSRC grant EP/H019480/1 (SuperGen Biological Fuel Cells consortium).References
- J. A. Vega and W. E. Mustain, Electrochim. Acta, 2010, 55, 1638 CrossRef CAS PubMed.
- J. A. Vega, S. Shrestha, M. Ignatowich and W. E. Mustain, J. Electrochem. Soc., 2012, 159, B12 CrossRef CAS PubMed.
- J. A. Vega, C. Chartier and W. E. Mustain, J. Power Sources, 2010, 195, 7176 CrossRef CAS PubMed.
- J. A. Vega, S. Smith and W. E. Mustain, J. Electrochem. Soc., 2011, 158, B349 CrossRef CAS PubMed.
- M. Unlu, J. Zhou and P. Kohl, Electrochem. Solid-State Lett., 2009, 12, B27 CrossRef CAS PubMed.
- L. Demarconnay, C. Coutanceau and J. M. Leger, Electrochim. Acta, 2004, 49, 4513 CrossRef CAS PubMed.
- V. Rao, Hariyanto, C. Cremers and U. Stimming, Fuel Cells, 2007, 7, 417 CrossRef CAS.
- (a) K.-D. Kreuer, Chem. Mater., 2014, 26, 361 CrossRef CAS; (b) M. A. Hickner, A. M. Herring and E. B. Coughlin, J. Polym. Sci., Part B: Polym. Phys., 2013, 51, 1727 CrossRef CAS; (c) J. Pan, C. Chen, L. Zhuang and J. Lu, Acc. Chem. Res., 2012, 45, 473 CrossRef CAS PubMed; (d) G. Merle, M. Wessling and K. Nijmeijer, J. Membr. Sci., 2011, 377, 1 CrossRef CAS PubMed; (e) R. Zeng and J. R. Varcoe, Recent Pat. Chem. Eng., 2011, 4, 93 CAS; (f) J. R. Varcoe, J. P. Kizewski, D. M. Halepoto, S. D. Poynton, R. C. T. Slade and F. Zhao, in Encyclopedia of Electrochemical Power Sources, ed. J. Garche, C. Dyer, P. Moseley, Z. Ogumi, D. Rand and B. Scrosati, Elsevier, Amsterdam, 2009, vol. 2, pp. 329–343 Search PubMed; (g) R. C. T. Slade and J. R. Varcoe, Fuel Cells, 2005, 5, 187 CrossRef; (h) T. Xu, J. Membr. Sci., 2005, 263, 1 CrossRef CAS PubMed.
- N. Li, M. D. Guiver and W. H. Binder, ChemSusChem, 2013, 6, 1376 CrossRef CAS PubMed.
- H. Long, K. Kim and B. S. Pivovar, J. Phys. Chem. C, 2012, 116, 9419 CAS.
- C. M. Lang, K. Kim and P. Kohl, Electrochem. Solid-State Lett., 2006, 9, A545 CrossRef CAS PubMed.
- N. S. Spinner, J. A. Vega and W. E. Mustain, Catal. Sci. Technol., 2012, 2, 19 CAS.
- J. A. Vega, N. Spinner, M. Catanese and W. E. Mustain, J. Electrochem. Soc., 2012, 159, B19 CrossRef CAS PubMed.
- J. Prakash, D. A. Tryk, W. Aldred and E. B. Yeager, J. Appl. Electrochem., 1999, 29, 1463 CrossRef CAS.
- J. Prakash, D. A. Tryk and E. B. Yeager, J. Electrochem. Soc., 1999, 146, 4145 CrossRef CAS PubMed.
- L. Yao, D. Wang, W. Peng, W. Hu, H. Yuan and S. Feng, Sci. China: Chem., 2011, 54, 941 CrossRef CAS PubMed.
- T. Munenaka and H. Sato, J. Phys. Soc. Jpn., 2006, 75, 103801 CrossRef.
- G. Haranyi, J. Solid State Electrochem., 1998, 2, 237 CrossRef.
- C. A. Hancock, A. Ong and J. R. Varcoe, J. Mater. Chem. A, 2014, 2, 3047 CAS.
- J. Sunarso, A. A. J. Torriero, W. Zhou, P. C. Howlett and M. Forsyth, J. Phys. Chem. C, 2012, 116, 5827 CAS.
- S. Treimer, A. Tang and D. C. Johnson, Electroanalysis, 2002, 14, 165 CrossRef CAS.
- C. H. Hamann, A. Hamnett and W. Vielstich, Electrochemistry, Wiley-VCH, Germany, 2nd edn, 2007, pp. 193–197 Search PubMed.
- E. Gileadi, Physical Electrochemistry Fundamentals, Techniques and Applications, Wiley-VCH, Germany, 2011, p. 65 Search PubMed.
| This journal is © The Royal Society of Chemistry 2014 |

