G. P. Nagabhushanaa,
D. Samratb and
G. T. Chandrappa*a
aDepartment of Chemistry, Bangalore University, Bangalore-560001, India. E-mail: gtchandrappa@yahoo.co.in; Tel: +91-80-22961350
bCenter for Nano and Material Sciences, Jain University, Jakkasandra-562112, India
First published on 17th October 2014
Nanoparticles of ultra-porous MoO3 were synthesized in a single step by a solution combustion reaction using molybdenum metal powder as precursor for the first time. The effects of the preparation conditions, such as the temperature and precursor concentration, on the crystalline phase and morphology of the products were studied systematically. The analytical techniques SEM, TEM, PXRD, TGA, FTIR, and SAED were used to characterize the morphology, composition, and structure of the as-prepared products. The TEM images of MoO3 show the sizes of the particles to be in the range of 2–10 nm. Electrochemical characterization of MoO3 was carried out in 0.5 M H2SO4. The specific capacitance and electrochromic properties of MoO3 were studied. The high photocatalytic activity of MoO3 was investigated using methylene blue azo dye at various concentrations. MoO3 showed the ability to degrade 100% of methylene blue present at high concentrations of about 75 mg L−1.
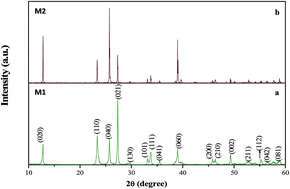
Molybdenum can form the binary oxides MoO2 and MoO3. Molybdenum trioxide has several polymorphs, such as the thermodynamically stable orthorhombic α-MoO3, metastable monoclinic β-MoO3 and metastable hexagonal h-MoO3. The crystalline structure of orthorhombic α-MoO3 shows a unique layer structure made up of chains of octahedra that share corners. Two such chains are connected by sharing two edges of the octahedra to form a double chain. These double chains are then connected together in the third dimension (perpendicular to the plane of the double chain) by sharing corners to form a sheet-like structure. Thus, for each octahedron, three oxygen atoms are shared by three octahedra of the same double chain, two are shared by two octahedra of adjacent double chains, and one is unshared. This unshared unit is commonly referred to as a MoO unit. Finally, these two-dimensional sheets are stacked on top of each other with rather weak interactions, i.e., van der Waals' forces, between the layers.9 MoO3 has a wide band gap of 2.5 to 3.2 eV, is an n-type semiconductor and is a promising material for photocatalytic degradation of organic molecules both under UV and visible light. It has been used in various different technical, industrial and scientific applications. Due to its distinctive electrochromic, thermochromic and photochromic properties, it has been investigated over the past decades for use in smart materials, gas sensors, lubricants, electrochemical storage materials, catalysts and host materials for intercalation.10–13
The formation of +4 and +6 oxidation states of molybdenum in molybdenum oxide with the required phase and the novel characteristic properties differing from their bulk counterpart mainly depends on the method of synthesis. Considerable research effort has gone into synthesizing MoO3 nanostructures with specific morphologies, sizes, crystal structures, and dopants, using various synthesis techniques including sol–gel, combustion, hydrothermal synthesis, chemical vapour deposition and pulsed laser ablation.14–21 Among these methods, the solution combustion route is promising since one can control the formation of product by controlling several parameters such as oxidizer-to-fuel ratio, volume of the precursor solution, reaction temperature, oxygen/air partial pressure, additional oxidizers, mixture of fuels and ignition temperature. This process is capable of producing larger-scale materials faster than the other techniques, and at a lower temperature.
Redox-active metal oxide materials have become the centre of attention for supercapacitor studies.22 The process of charge storage is a combination of two mechanisms in the case of metal oxides:23 these materials store energy through highly reversible surface redox reactions in addition to electric double layer capacitance, and this combination is termed pseudocapacitance.24,25 Redox-active metal oxides have gained considerable interest in the areas of electrochromics and batteries.26,27 The electrochromic effect exhibited by these materials has made them very useful in the development of displays and smart windows.28,29
For the present work, MoO3 was synthesised within a few minutes by a solution combustion method, starting with dissolving Mo metal powder in hydrogen peroxide and using sucrose as a fuel. The particle size varies in the range of 2–10 nm. Electrochemical studies were used to examine the specific capacitance and electrochromic properties of the synthesized materials. MoO3 displayed excellent photocatalytic activity for the degradation of methylene blue under UV light.
The present combustion-based synthesis using molybdenum metal as the precursor and sucrose as the fuel has several advantages including short reaction time, use of a low-cost precursor, and high exothermicity; the reaction lasts for a few seconds and leads to controlled growth of particles that produce floppy end products.
A clear and transparent 2 cm × 1 cm × 0.7 mm glass electrode was coated with indium tin oxide (ITO) and washed with alcohol and deionized water. An aqueous suspension of metal oxide was drop-casted onto the glass electrode and dried under ambient conditions.
The differences in the morphologies of the as-synthesized M1 and M2 MoO3 powders were studied using SEM micrographs. Fig. 2a shows the SEM image of the M1, which exhibits macroporosity with fine grains. The BET specific surface area was found to be ∼4.97 m2 g−1. In the SEM image of Fig. 2b, M2 can be seen to be quite agglomerated despite being porous.
Fig. 3 shows the TEM images, SAED pattern and size distribution histogram of the MoO3 (M1) powder. From the TEM images (a and b), it is observed that the particles are well distributed and then less agglomerated. The abundance of particles with different sizes is also shown in the size distribution histogram (Fig. 3d). There is a narrow particle size distribution with the highest frequency in the range of 6 ± 2 nm. The histogram was obtained by analyzing several frames of similar bright field images using IMAGE J software. The selected-area electron diffraction (SAED) pattern (Fig. 3c) shows the polycrystalline nature of the MoO3 (M1) powder. A TEM image of the M2 powder is shown in ESI (Fig. S5†) and it is found that the particles are in the range of 50 to 100 nm.
![]() | ||
Fig. 3 TEM images (a and b), SAED pattern (c) and size distribution histogram (d) of the MoO3 (M1) powder. |
FT-IR was performed to determine the chemical bonding states between molybdenum and oxygen atoms in MoO3. Fig. 4 shows the IR spectrum of MoO3 (M1) measured in the 4000–400 cm−1 region. It can be seen that the as-prepared MoO3 shows three peaks at 553, 848 and 985 cm−1. The peak at 985 cm−1 is due to the terminal MoO bond, which is an indicator of the layered orthorhombic MoO3 phase. The peak at 848 cm−1 is attributed to the Mo–O–Mo vibrations of the Mo6+ ions and the broad band at 553 cm−1 is due to the bending vibration of an oxygen atom linked to three metal atoms.31
TGA was performed to determine whether carbon is present in the as-synthesised MoO3 (M1) powder. Fig. 5 shows that there is a weight loss of ∼1.54%, up to 700 °C, which could be accounted for by loss of adsorbed water.
![]() | ||
Fig. 6 Continuous cyclic voltammograms (25 cycles) of the GCE drop-casted with MoO3 (M1) powder in 0.5 M H2SO4 with a scan rate 30 mV s−1. |
The three sets of redox peaks have also been reported in the literature. But the differences in the peak current and potential corresponding to the major redox peak are due to different experimental conditions and different electrodes employed.32 In the above-described potential window, hydrogen ions insert into the M1 film during the cathodic half cycle, which results in the formation of hydrogen molybdenum oxide bronzes [eqn (1)]. During the reverse cycle, withdrawal of hydrogen ions takes place to form the low-valent molybdenum oxide [eqn (2)].33 Though this process is reversible, there is a decrease in the peak currents, which can be observed due to the trapping of a certain percentage of the inserted hydrogen ions.34
MoO3 + xH+ + xe− → MoO3−x (OH)x (0 < x < 1.6) | (1) |
MoO3 + 2ye− + 2yH+→ MoO3−2y + yH2O (0 < y < 1) | (2) |
The specific capacitance of the M1-drop-casted GCE was determined by recording the CV in the potential window 0.2 to 1.2 V with a 40 mV s−1 scan rate by following the above-described procedure. Similarly, CVs were recorded for M2 and commercially obtained MoO3 for the purpose of comparison. The cyclic voltammograms obtained for synthesized MoO3 systems were approximately rectangularly shaped with one redox peak in each (Fig. 7). Capacitance and specific capacitance (Csp) were calculated using eqn (3) and (4).17 Csp of the M1, M2 and commercially procured MoO3 systems were found to be 108.88, 77.09 and 41.04 F g−1, respectively.
Csp = 2Cdl/S | (3) |
![]() | ||
Fig. 7 Overlaid cyclic voltammograms of GCEs drop-casted with M1 (black line), M2 (blue line) and commercially obtained MoO3 (red line) in 0.5 M H2SO4 with a 40 mV s−1 scan rate. |
Double layer capacitance was calculated using the formula:
Cdl (dE/dt) = (Ia − Ic)/2 | (4) |
The redox reactions expressed as eqn (1) and (2) explains the electrochromic property of MoO3. As expressed in eqn (1), cathodic polarization at −2.0 V of M1-casted ITO-coated glass causes the intercalation of H+ ions, which in turn converts the white film to green. The intensity of the green color can be increased by polarizing the film at a higher cathodic overpotential such as −3.0 V. The reverse of the above, i.e., anodic polarization, causes the deintercalation of inserted H+ ions that leads to the bleaching of the colored film. Further anodic polarization at +3.0 V causes the complete bleaching of the green color as shown in Fig. 8a. The corresponding transmittance spectra were recorded for the different polarizations applied. The spectra agree well with optical photographs taken and with the above explanation. With the increase in cathodic polarization potential, the green color becomes more intense, and as a result a decrease in the transmittance was observed. Conversely, an increase in anodic polarization potential bleaches the color of the film, causing the M1 film to become more transparent (Fig. 8b). M2 and commercial MoO3 also form the molybdenum bronze-like M1, due to the intercalation of H+ ions on applying potentials such as −2.0 and −3.0 V, as shown in ESI Fig. S3 and S4,† respectively. But the colour intensity of M1 is greater than that of M2, which in turn is greater than that of commercial MoO3 at the same applied potentials. This difference in colour intensity indicates the greater percentage of insertion of H+ into MoO3 in the case of M1. Similarly, less bleaching of colour was observed in the case of M2 and commercial MoO3 than in M1. This can be explained by incomplete deintercalation of inserted H+ ions in M2 and commercial MoO3 due to less porosity.
![]() | ||
Fig. 8 (a) Optical photographs of MoO3 (M1)-casted ITO-coated glass. (b) corresponding UV-vis spectra of the M1-coated ITO glass. |
Initially, with constant concentration of MB dye, the influence of the amount of photocatalyst was investigated in the range of 50 to 250 mg. Around 100% degradation was observed with a dye concentration of about 75 mg L−1 for 100 mg of catalyst.
Fig. 9a shows I/Io versus irradiation time, where I and Io are the intensities of the absorbance peak at 664 nm at the reaction time and the initial time. With lower catalyst dosage the degradation was very poor; with 50 mg of catalyst, only ∼10% of the MB degraded. Even the increase in the catalyst dosage to more than 100 mg shows low degradation. This might be due to the scattering of UV light by the excess of photocatalyst which reduces the generation of charge carriers. The other reason could be that the turbidity, which is due to the aggregation of the catalyst particles caused by the high catalyst dosage, leads to a decrease in the penetration of light.
As the catalyst dosage was optimised, the effect of concentration was investigated. Fig. 9b shows that as the dye concentration was increased to 100 mg L−1, there was a large decrease in the degradation rate. Hence the optimum catalyst dose of 100 mg MoO3 can degrade 75 mg L−1 of MB in 60 min. But the commercial MoO3 shows nearly 18% of the degradation even after 60 min.
Footnote |
† Electronic supplementary information (ESI) available. See DOI: 10.1039/c4ra05135a |
This journal is © The Royal Society of Chemistry 2014 |