Shape tailored Ni3(NO3)2(OH)4 nano-flakes simulating 3-D bouquet-like structures for supercapacitors: exploring the effect of electrolytes on stability and performance†
Jickson Joseph,
Ranjusha Rajagopalan*,
S. S. Anoop,
V. Amruthalakshmi,
Amrutha Ajay,
Shantikumar V. Nair and
Avinash Balakrishnan*
Nanosolar Division, Amrita Center for Nanosciences, Kochi, India-682041. E-mail: avinash.balakrishnan@gmail.com; rranjusha@gmail.com; Tel: +91-484-2801234
First published on 12th August 2014
Abstract
The present study demonstrates a novel, low temperature synthetic approach by which 3-D bouquets of nickel hydroxide nitrate were processed into high surface area electrodes for supercapacitor applications. The synthesized micro-bouquets comprised randomly arrayed microporous nanoflakes (pore size: 2–6 nm) and exhibited a surface area of 150 m2 g−1. Morphological evolution studies were performed to elucidate how surface morphology of these electrode materials affect redox reactions and their ultimate performance as a supercapacitor. The electrodes were tested in three different electrolytes, namely lithium hydroxide, potassium hydroxide and sodium hydroxide. From the detailed electrochemical analysis, an intrinsic correlation between the capacitance, internal resistance and the surface morphology was deduced and explained on the basis of relative contributions from the faradaic properties in different electrolytes. Depending on the surface morphology and electrolyte incorporated, these nano/micro-hybrid electrodes exhibited specific mass capacitance value of as high as 1380 ± 38 F g−1. Inductively coupled plasma-atomic emission spectroscopy was used to determine the electrode dissolution in the given electrolyte and the findings were co-related with the cycling stability. By employing this low cost electrode design, high stability (>5000 cycles with no fading) was achieved in lithium hydroxide electrolyte. Furthermore, a working model supercapacitor in a coin cell form is also shown to exhibit peak power and energy density of 3 kW kg−1 and 800 mW h kg−1, respectively.
1. Introduction
Superior energy storage technologies based on inexhaustible and economical resources are required to enhance sustainability, reduce pollution and keep fossil fuel prices lower.1–3 Energy storage devices, such as supercapacitors, have significant applications in electronic systems such as power back-up, micro-devices, electric vehicles, etc.4,5 A supercapacitor that exhibits reversible faradaic reactions at the electrode surface is called a pseudocapacitor.6,7 In many cases, pseudocapacitors have a specific capacitance exceeding that of the electric double layer supercapacitors composed of carbonaceous materials.22 Transition metal oxides and hydroxides are typical active pseudocapacitor electrode materials. As compared to carbon, employing transitional materials can often result in a compromise between the power performance and reversibility because the redox kinetics are limited by ion mobility and electron transfer rates.11,12 Because of these kinetics, even though most of these transitional metal oxides/hydroxides have theoretical capacitance values (>1000 F g−1), the practical values obtained are much lower.9,13 A partial solution to this problem is to use nanostructured materials. Low capacitance values still persist for these transitional nanostructures at high C-rates. Thus, efforts have been made to improve the performance of these pseudocapacitive materials through engineered meso/micro-porous structures, which are compounded by more active sites for achieving a high rate capability.14 Despite these efforts, a huge challenge still remains to search for a low-cost, stable and high performing pseudocapacitive electrode material with good rate capability. To address the above mentioned issue, herein, a novel electrode material design is investigated wherein micro-porous nanoflakes are randomly arrayed in a three-dimensional (3D) manner. The material studied is nickel hydroxide nitrate (Ni3(NO3)2(OH)4). From an electrochemical point of view, nickel hydroxide nitrate is advantageous because it offers a layered CdI2 structure.15 As the sites of the OH− are substituted by the NO3−, the interlayer spacing obtained in these materials is larger than nickel hydroxide.10 Such large interlayer spacing can be beneficial from an ion diffusion point of view and have been exploited in nickel–cadmium battery applications.16 To the best of our knowledge, there are only two major reports on utilizing nickel hydroxide nitrate for pseudocapacitors. For instance, Liu et al.10 employed ultrathin nickel hydroxide nitrate nanoflakes grown on ZnO nanowire as electrodes in a 1 M NaOH electrolyte for pseudo-capacitor applications where specific capacitance as high as 1310 F g−1 at a discharge current density of 15.7 A g−1 was attained. Though promising, the synthetic technique reported here is complicated; secondly, the utilization of ZnO nanowire semiconductors can reduce the current collection (through electron recombination17) and hence the capacitance. Furthermore, the contributions from transitional zinc oxide in the final performance of the electrode were not discussed and cannot be neglected. Thus, from a structural point of view, there is a scope for realizing and improving the practical specific capacitance of this material. This was shown by Kong et al.,18 whereby employing a flower-like morphology of nickel hydroxide nitrate in 2 M KOH, a higher specific capacitance of 2212.5 F g−1 was reported at ∼1.5 A g−1 during the initial discharge. Approximately 30% fading was observed at the end of 1000 cycles limiting its application. We believe that this fading could be attributed to the electrode–electrolyte combination, which was detrimental for the electrode structure causing dissolution. This has been shown in our present study. Furthermore, the values reported by Kong et al., exceeded the theoretical specific capacitance of these materials (∼1500 F g−1).10 This could be attributed to the fact that the authors were incorporating acetylene black and graphite as current collectors, thus the double layer storage contributions along with faradaic contributions could have added to their final specific capacitance values. Our previous studies have shown that for pseudocapacitors, the charge storage mechanism coming from the double layer effect of carbon current collectors plays a significant role in improving the final performance of the electrode system.8,19–21 Therefore, to understand the true potential of these materials, the present study employs an electrophoretic deposition technique to attain thin film coatings comprising phase pure nickel hydroxide nitrate. Micro-bouquets of Ni3(NO3)2(OH)4 were synthesized by a hydrothermal method without addition of any surfactant. The surface morphology of the hybrid structure showed randomly oriented micro-porous flakes (pore size: 2–6 nm). The electrochemical properties of Ni3(NO3)2(OH)4 were investigated by cyclic voltammetry, constant current charge–discharge tests and electrochemical impedance spectroscopy. A specific capacitance value of ∼1380 F g−1 (2.3 F cm−2) was obtained. It is the first time that such high values have been reported at high discharge current density. The effects of different electrolytes are analyzed in detail for these materials. The present study also demonstrates the first results on the performance of these electrodes when employed in a fully functional coin cell supercapacitor.2. Experimental
2.1. Synthesis of Ni3(NO3)2(OH)4 powders
All the chemicals used in the present study were of analytical grade obtained from Nice Chemicals, India. First, 0.015 M of Ni(NO3)3·6H2O was completely dissolved in 32 mL of distilled water under constant stirring. To this solution, 0.015 M of urea was added and completely dissolved. 32 mL of methanol was incorporated to this solution mixture. This methanolic solution was stirred for 30 min. The obtained clear solution was autoclaved in a Teflon lined container at 90 °C for different time intervals ranging from 6 to 36 h. The resultant solution was centrifuged for 20 min and the obtained precipitate was thoroughly washed with de-ionized water and oven dried in air at 60 °C for 12 h.2.2. Electrophoretic deposition and surface characterization
Morphology and phase analyses were performed using scanning electron microscopy (SEM, Model: JEOL, JSM-6390LV), high resolution-transmission electron microscopy (HR-TEM, Model: JEOL, JEM-2100F), Fourier transform infrared spectroscopy (FT-IR, Model: Thermo Nicolet, Avatar 370) and X-ray diffraction analyses (XRD, X'Pert PRO Analytical). The resultant powders were electrophoretically deposited onto a nickel substrate. For this an electrochemical setup comprising nickel foil (1 cm × 2 cm × 0.2 mm) was used as a substrate (cathode) and platinum wire as an anode. Isopropanol solution was used as the electrolyte solvent. To this electrolyte, 14 mg of Ni3(NO3)2(OH)4 synthesized powders were dispersed uniformly under constant stirring. For each batch, the deposition was carried out at 36 V for 20 min at room temperature, resulting in a thin uniform porous layer of Ni3(NO3)2(OH)4. The atomic force microscopy (AFM, JEOL SPM 5200) was used to measure the active surface area of the deposited layer. Surface area measurements were carried out using a BET analyzer (Nova Quantachrome, USA).2.3. Electrochemical characterization
Cyclic voltammetry (CV) and constant current charge–discharge were performed to evaluate the capacitance. For the electrochemical studies, a three electrode setup consisting of electrophoretically deposited Ni3(NO3)2(OH)4, platinum and Ag/AgCl (3 M KCl filling solution) electrode were used as working, counter and reference electrode, respectively. Different electrolytes comprising of KOH, NaOH and LiOH in 1 M concentrations were used.3. Results and discussion
3.1. Phase and morphological analyses
Fig. 1(a)–(d) shows the SEM images displaying the morphology of the hydrothermally synthesized Ni3(NO3)2(OH)4 powders at different processing times of 6, 12, 24 and 36 h designated as N-6, N-12, N-24 and N-36, respectively. It was observed that as the processing time increases from 6 to 24 h, the morphology changes from micro-clumps (Fig. 1(a) & (b)) to a cluster of nano-flakes arrayed in a spheroidal manner (Fig. 1(c)). At the end of 24 h processing time, N-24 samples showed microclusters with size ranging from 10–20 μm (see inset (Fig. 1(c)). As the processing time was increased to 36 h, N-36 samples showed clump-like features similar to N-6 samples. This phenomenon can be mainly attributed to the agglomeration of the nanoflakes subjected to prolonged exposure to temperature and pressure during the hydrothermal synthesis.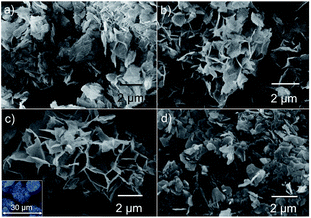 | ||
| Fig. 1 SEM images displaying the morphology of synthesized Ni3(NO3)2(OH)4 hydrothermally at different times of (a) 6 h, (b) 12 h, (c) 24 h, and (d) 36 h. | ||
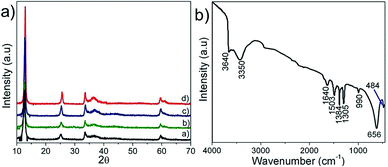
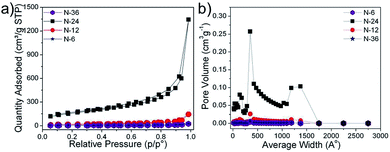
Fig. 2(a) shows the typical XRD patterns of the synthesized powders where the diffraction peaks corresponded to pure phases of α-Ni3(NO3)2(OH)4 (JCPDS 22-0752). It was seen that the crystallinity of the samples increased with processing time. Fig. 2(b) shows the typical FT-IR spectrum of the as-prepared nickel nitrate hydroxide powders. Three peaks observed at 3640, 656, and 484 cm−1 correspond with the ν-OH stretching, σ-OH vibrations and ν-Ni–O vibration, respectively.23,24 The vibrations of H2O were manifested as two peaks at 3350 and 1640 cm−1. The interlayer NO3− was observed as a set of strong peaks in the range of 1503 to 980 cm−1. No vibrations of organic compounds (C–H vibration ∼2900 cm−1)23 were observed indicating the phase purity of the prepared powder. The effect of processing time was reflected in the surface area of the processed powder. Fig. 3(a) shows the isotherm plots of synthesized samples; a surface area of 11, 14, 150 and 61 m2 g−1 was obtained for N-6, N-12, N-24 and N-36 samples, respectively.
Fig. 3(b) shows pore size distributions for the synthesized powders. The pore size distributions of the N-24 samples were narrower and the pore diameters were smaller showing the presence of both micro and meso-pores. The pore diameters and pore volumes patterns of N-6, N-12 and N-36 illustrated that the prepared powders were non-porous in nature, which explained their low surface area (Fig. 3(a)).
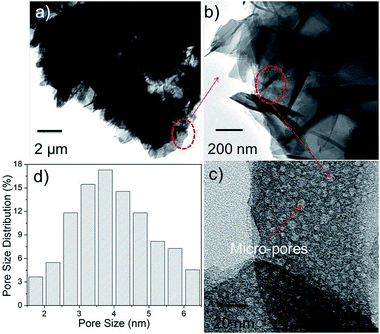
Fig. 4(a) and (b) shows the HR-TEM images and pore size distribution (Fig. 4(c)) of N-24 powders obtained from TEM images (Fig. 4(a)–(c)). Pore size varied from 2–8 nm. This micro/mesoporous nature of the N-24 sample is correlated with the high BET surface area value. The formation mechanism of α-Ni3(NO3)2(OH)4 can be shown as follows:25,26
| 4CH3OH + NO3− ↔ 4CH2O + NH3 + OH− + 2H2O | (I) |
| 3Ni2+ + 4OH− + 2NO3− ↔ Ni3(NO3)2(OH)4 | (II) |
The initiation of flower-like morphology begins with the nucleation of primary Ni3(NO3)2(OH)4 crystallites. As reported by Shinde et al.27 as the ionic product exceeds the solubility product, positively charged and anisotropic Ni3(NO3)2(OH)4 nuclei are formed. This possibly occurs from homogeneous aqueous nickel nitrate solution due to intensive hydrolysis at elevated temperatures during the hydrothermal process. As the reaction progresses, these crystallites agglomerate/aggregate to self-organize themselves into micro-porous nanoflakes which self-assemble into 3-D structures. This self assembly of the flakes can be attributed to multiple factors such as electrostatic and dipolar fields associated with the agglomerations, hydrophobic interactions, hydrogen bonds, crystal face attraction and van der Waals forces of attraction.28–30
In the present case, it is believed that the presence of functional (nitrate and hydroxyl) groups, electrostatic interactions and hydrogen bonds have played a pivotal role in aiding the formation of the flower-like morphology.24 The schematic representation of this formation mechanism of micro-porous Ni3(NO3)2(OH)4 3-D structures is shown in Fig. 5.
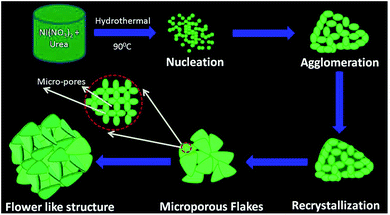 | ||
| Fig. 5 Schematic representation of the formation mechanism of micro-porous Ni3(NO3)2(OH)4 3-D structures. | ||
Fig. 6(a)–(d) reveal the SEM images of the electrophoretically deposited layer of Ni3(NO3)2(OH)4 electrodes displaying a thickness of ∼20–30 μm (see ESI-I†). All the powders appear to retain their initial morphology after electrophoretic deposition.
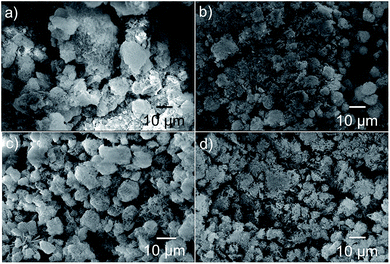 | ||
| Fig. 6 SEM images of the electrophoretically deposited layer of (a) N-6, (b) N-12, (c) N-24 and (d) N-36 powders. | ||
3.2. Electrochemical characterization
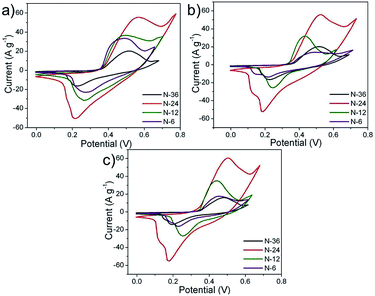
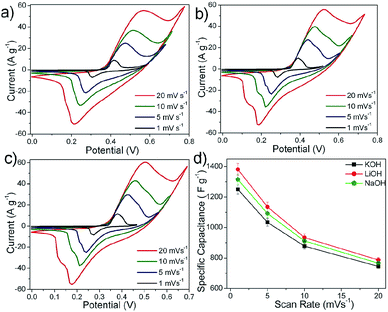
For a given electrolyte, all the fabricated electrodes (N-6, N-12, N-24 and N-36) showed similar redox patterns. Among all the electrodes, N-24 showed prominent redox peaks in the given electrolytes (Fig. 7(a)–(c)).This concurs with the fact that N-24 powders showed higher surface area (see Fig. 3), where the 2D flake-like structures make nickel nitrate hydroxide exclusively exposed to the electrolyte as compared to other electrode overlays. The mean surface roughness (Ra) for N-24 samples was measured using AFM and was found to be 0.150 μm (see ESI-II†). N-24 electrode showed similar performance in all the given electrolytes. Thus, all further electrochemical characterization was performed using N-24 electrodes.
 | (1) |
The redox peaks of Ni3(NO3)2(OH)4 electrodes (Fig. 8(a)–(c)) in the given electrolytes can be attributed to the intercalation and de-intercalation of OH− ions from the electrolyte into the micro and/or mesopores of the flake-like structure. The possible faradaic reactions occurring on the surface of Ni3 (NO3)2(OH) 4 are:
| Ni3(NO3)2(OH)4 + yOH− + e− ↔ Ni3(NO3)2(OH)4−y·yOH− + (1 − y)Ni3(NO3)2(OH)4 + H2O + e− | (III) |
At lower scan rates of 1 mV s−1, the specific capacitance for LiOH, NaOH and KOH was found to be higher, which implied more active sites participating as compared to at 20 mV s−1 (Fig. 8(d)). This implied that by lowering the scan rate it is possible to increase the OH− intercalation–deintercalation reactions contributing an increase in the total capacitance of the electrode. The decrease in specific capacitance at faster scan rates can be attributed to the fact that the OH− ions from the electrolyte reach only up to the electrode surface with limited entry into the deeper pores of the electrode.31,32
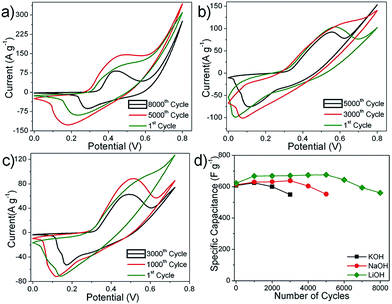 | ||
| Fig. 9 CV curves of N-24 electrodes in (a) LiOH, (b) NaOH and (c) KOH for different numbers of cycles. Scan rate: 50 mV s−1. | ||
The initial increase in capacitance could be attributed to the pore opening phenomenon as observed in other metal oxide systems. The superior performance in LiOH could be attributed to the lower dissolution of nickel into the electrolyte.
ICP-AES analysis of the electrolyte (see Table 1) at the end of the 1st and last cycle showed lower dissolution of nickel in the case of LiOH as compared to NaOH and KOH electrolyte systems.
| Electrolytes | |||
|---|---|---|---|
| No. of cycles | LiOH | NaOH | KOH |
| a Values: in ppm. | |||
| 1st | 0.01 | 0.01 | 0.02 |
| 1000th | 0.02 | 0.03 | 0.03 |
| 3000th | 0.04 | 0.05 | 0.30 |
| 5000th | 0.08 | 0.45 | — |
| 8000th | 0.58 | — | — |
Fig. 10(a) shows the Nyquist plots of N-24 electrodes in the three electrolytes. In the complex plane of the Nyquist plot, the imaginary component Zll shows the capacitive nature and the real component Zl shows the ohmic behavior. Both the components were investigated in the frequency range of 0.1–10![[thin space (1/6-em)]](https://www.rsc.org/images/entities/char_2009.gif) 000 Hz. The Nyquist plots of a supercapacitor consist of three regions that are frequency dependent. At high frequencies, the supercapacitor exhibits pristine resistor behavior. The reactance (imaginary part) increases with decreasing frequency indicating a capacitive behavior. In the medium frequency domain, the influence of the electrode porosity is observed.36
000 Hz. The Nyquist plots of a supercapacitor consist of three regions that are frequency dependent. At high frequencies, the supercapacitor exhibits pristine resistor behavior. The reactance (imaginary part) increases with decreasing frequency indicating a capacitive behavior. In the medium frequency domain, the influence of the electrode porosity is observed.36
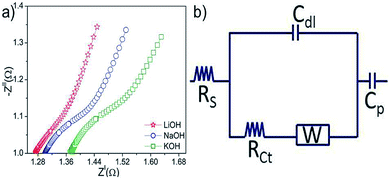 | ||
| Fig. 10 (a) Nyquist plots of N-24 electrodes in different electrolytes and (b) equivalent circuit obtained from the Nyquist plot. | ||
As the frequency decreases from the higher to the lower range, the deeper pores of the electrode structure becomes available for ion adsorption.41 The lower frequency region corresponding to the capacitive element of the electrode. The Warburg region lies in between the high frequency and low frequency regions. This region is related to electrolyte penetration into the electrode pores.42 In the present study, the EIS curves (Fig. 10(a)) corresponding to the three electrolyte systems showed linear behavior in the lower frequency region and an arc at high frequency. The electrical resistance between the N-24 nanoflakes in a given electrolyte can be represented by Rs. It was observed that N-24 samples showed lower ohmic values in LiOH as compared to other two electrolytes. These shifts in the impedance spectra in the different electrolytes can be attributed to the effect of different cation sizes. For instance, in each electrolyte as OH− ions intercalate into the anode, it is complemented by a cation transfer at the counter electrode. Depending on the size, the cation density at the counter electrode–electrolyte interface will vary, which is reflected in the ohmic values of the overall system. The higher the cation density at the electrolyte–electrode interface, the lower is the ohmic resistance. In the present case, Li+ has lower ionic radius of 0.09 nm as compared to Na+ (0.116 nm) and K+ (0.152 nm).22 Thus, N-24 is anticipated to show lower ohmic values in LiOH as compared to the other electrolytes, as shown in Fig. 10. The capacitive regions in the case of LiOH were significantly more inclined, indicating enhanced access of the electrolytic ions to the electrode surface. The equivalent series resistance (ESR) is observed from the x-intercept of the Nyquist plot. They are 1.27 Ω, 1.3 Ω and 1.37 Ω in LiOH, NaOH and KOH, respectively. The ESR data determine the rate at which the supercapacitor can be charged and discharged. It is a very important factor to determine the power density of a supercapacitor because the power density is inversely proportional to the ESR. The typical equivalent circuit corresponding to all these system is shown in Fig. 10(b). Considering the stability and lower ESR values, the N-24 electrodes in LiOH system was considered for further characterization.
 | (2) |
 | (3) |
 | (4) |
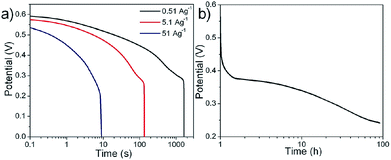 | ||
| Fig. 11 (a) Discharge curves of N-24 electrodes at different current densities and (b) self-discharge behavior of N-24 electrodes in 1 M LiOH. | ||
The obtained specific capacitance values were 1380 ± 38 F g−1 (2.3 ± 0.06 F cm−2), 1162 ± 32 F g−1(1.94 ± 0.05 F cm−2), and 802 ± 18 F g−1 (1.33 ± 0.03 F cm−2) at discharge current densities of 0.51 A g−1, 5.1 A g−1, and 51 A g−1, respectively. It should be noted that the highest discharge current density, i.e. 50 A g−1 reported here is 3 times higher as compared to the discharge current density (∼15.7 A g−1) reported by Liu et al.10 for the same material in 1 M KOH. The decrease in capacitance with the increase in applied current density is a well-known phenomenon for transition materials. The fading of specific capacitance at higher current densities can be attributed to different factors such as voltage (IR) drop, non-uniformly distributed pore resistance and severe redox reactions at the electrode surface.33–35 The obtained energy and power density values for these N-24 electrodes in LiOH electrolyte were observed to be 56 W h kg−1 and 27 kW kg−1, respectively. The deviation in the linearity for the discharge curve corresponds to the redox behavior as observed in the CV curves (Fig. 8(a)), indicating a tendency towards a battery-like behavior.40 Unlike a battery, this system showed high cycling stability (Fig. 9). The deviation during the discharge process could be attributed to multiple factors: (a) variation in the direct equivalent series resistance, (b) redistribution of charge within the pores of the material structure and (c) pseudocapacitive behavior of the material.36–39 However, identifying the role of individual influences of the above mentioned factors on the electrode's performance is difficult and is beyond the scope of the present work. Fig. 11(b) shows the self-discharge behavior for a period of ∼100 h, where the total discharge was found to be ∼50%, indicating a low self-discharge property.
As a preliminary study, the application of these N-24 electrodes was explored in a fully functional CR2032 coin cell (Fig. 12(a)). Fig. 12(b) shows a typical CR2032 coin cell. Fig. 12(c) shows the discharge curves at 5, 25, 50 mA g−1. A capacitance of ∼15 mF at a peak voltage of ∼1.75 V was obtained. The obtained peak energy and peak power density values for the coin cells were found to be ∼800 mW h kg−1 and 3 kW kg−1, respectively. These samples showed good shelf life retaining their discharge capacitance even after 30 days.
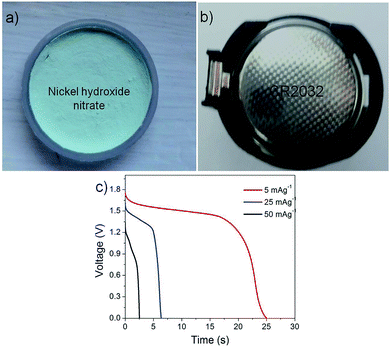 | ||
| Fig. 12 (a) and (b) Assembled button cell using N-24 electrode, (c) discharge curve at different discharge currents. | ||
Although these results appear to be promising, the main conclusion of this investigation can only be validated once the performance of these N-24 electrodes are evaluated at higher and lower temperatures at different discharging currents. This work is currently been pursued by our group.
4. Conclusions
In summary, the present study investigates the performance of Ni3(NO3)2(OH)4 micro-bouquets for pseudocapacitor electrode applications. The presence of micro-pores on the Ni3(NO3)2(OH)4 nano-flakes has shown to increase the surface area. This porous electrode morphology shows advantages especially from higher mass specific capacitance (1380 ± 38 F g−1) with a low self-discharge behavior stand point. The superior performance of these electrodes in conjunction with their reduced cost and low temperature fabrication makes them promising systems for pseudocapacitor applications.Acknowledgements
Department of Science and Technology (DST), Government of India is gratefully acknowledged for their financial support to Dr Avinash Balakrishnan under Fast Track Scientist scheme. Ministry of New and Renewable Energy (MNRE), India is also acknowledged for their infrastructural support.Notes and references
- M. S. Whittingham, Chem. Rev., 2004, 104, 4271 CrossRef CAS.
- A. Hochbaum and P. Yang, Chem. Rev., 2010, 110, 527 CrossRef CAS PubMed.
- J. R. Miller and P. Simon, Science, 2008, 321, 651 CrossRef CAS PubMed.
- L. Cao, F. Xu, Y. Y. Liang and H. L. Li, Adv. Mater., 2004, 16, 1853 CrossRef CAS PubMed.
- D. D. Zhao, W. J. Zhou and H. L. Li, Chem. Mater., 2007, 19, 3882 CrossRef CAS.
- L. B. Kong, M. C. Liu, J. W. Lang, M. Liu, Y. C. Luo and L. Kang, J. Solid State Electrochem., 2011, 15, 571 CrossRef CAS.
- S. C. Pang, M. A. Anderson and T. W. Chapman, J. Electrochem. Soc., 2000, 147, 444 CrossRef CAS PubMed.
- R. Ranjusha, V. Prathibha, S. Ramakrishna, A. Sreekumaran Nair, P. Anjali, K. R. V. Subramanian, N. Sivakumar, T. N. Kim, S. V. Nair and A. Balakrishnan, Scr. Mater., 2013, 68, 881 CrossRef CAS PubMed.
- S. Roshny, R. Ranjusha, M. S. Deepak, N. Sanoj Rejinold, R. Jayakumar, S. V. Nair and A. Balakrishnan, RSC Adv., 2014, 4, 15863 RSC.
- J. Liu, C. Cheng, W. Zhou, H. Li and H. J. Fan, Chem. Commun., 2011, 47, 3436 RSC.
- R. Liu and S. B. Lee, J. Am. Chem. Soc., 2008, 130, 2942 CrossRef CAS PubMed.
- H. Pang, Q. Y. Lu, Y. Z. Zhang, Y. C. Li and F. Gao, Nanoscale, 2010, 2, 920 RSC.
- L. Gao, F. Xu, Y. Y. Liang and H. L. Li, Adv. Mater., 2004, 16, 1853 CrossRef PubMed.
- R. Ranjusha, K. M. Sajesh, S. Roshny, V. Lakshmi, P. Anjali, T. S. Sonia, A. Sreekumaran Nair, K. R. V. Subramanian, S. V. Nair, K. P. Chennazhi and A. Balakrishnan, Microporous Mesoporous Mater., 2014, 186, 30 CrossRef CAS PubMed.
- J. Y. Miao, M. Xue, H. Itoh and Q. Feng, J. Mater. Chem., 2005, 16, 474 RSC.
- D. Louer, J. Mater. Sci., 1985, 20, 3729 CrossRef CAS.
- R. Ranjusha, P. Lekha, K. R. V. Subramanian, S. V. Nair and A. Balakrishnan, J. Mater. Sci. Technol., 2011, 27, 961 CAS.
- L. B. Kong, L. Deng, X. M. Li, M. C. Liu, Y. C. Luo and L. Kang, Mater. Res. Bull., 2012, 47, 16411 CrossRef PubMed.
- P. Anjali, A. S. Nair, R. Ranjusha, P. Praveen, K. R. V. Subramanian, N. Sivakumar, S. V. Nair and A. Balakrishnan, ChemPlusChem, 2013, 78, 1258 CrossRef PubMed.
- R. Ranjusha, S. Ramakrishna, A. S. Nair, P. Anjali, S. Vineeth, T. S. Sonia, N. Sivakumar, K. R. V. Subramanian, S. V. Nair and A. Balakrishnan, RSC Adv., 2013, 3, 17492 RSC.
- T. S. Sonia, S. Roshny, R. Ranjusha, P. Anjali, V. Lakshmi, K. R. V. Subramanian, S. V. Nair and A. Balakrishnan, RSC Adv., 2014, 4, 11673 RSC.
- R. Ranjusha, A. S. Nair, S. Ramakrishna, P. Anjali, K. Sujith, K. R. V. Subramanian, N. Sivakumar, T. N. Kim, S. V. Nair and A. Balakrishnan, J. Mater. Chem., 2012, 22, 20465 RSC.
- M. Taibi, S. Ammar, N. Jouini, F. Fiévet, P. Molinié and M. Drillon, J. Mater. Chem., 2002, 12, 3238 RSC.
- B. H. Liu, S. H. Yu, S. F. Chen and C. Y. Wu, J. Phys. Chem. B, 2006, 110, 4039 CrossRef CAS PubMed.
- C. Tang, G. Li and L. Li, Chem. Lett., 2008, 37, 1138 CrossRef CAS.
- X. Sun, X. Qiu, L. Li and G. Li, Inorg. Chem., 2008, 47, 4146 CrossRef CAS PubMed.
- V. R. Shinde, H. S. Shim, T. P. Gujar, H. J. Kim and W. B. Kim, Adv. Mater., 2008, 20, 1008 CrossRef CAS PubMed.
- L. Xu, Y. Ding, C. Chen, L. Zhao, C. Rimkus, R. Joesten and S. Suib, Chem. Mater., 2008, 20, 308 CrossRef CAS.
- Y. Luo, G. Li, G. Duan and L. Zhang, Nanotechnology, 2006, 17, 4278 CrossRef CAS PubMed.
- L. Dong, Y. Chu and W. Sun, Chem.–Eur. J., 2008, 14, 5064 CrossRef CAS PubMed.
- M. Toupin, T. Brousse and D. Belanger, Chem. Mater., 2004, 16, 3184 CrossRef CAS.
- S. Cheng, D. Yan, J. T. Chen, R. F. Zhuo, J. J. Feng, H. J. Li, H. T. Feng and P. X. Yan, J. Phys. Chem. C, 2009, 113, 13630 CAS.
- J. liang, B. dong, S. ding, C. Li, B. Q. Li, J. Li and G. Yang, J. Mater. Chem. A, 2014, 2, 11299 CAS.
- W. E. Mustain and J. Prakash, Proc. - Electrochem. Soc., 2003, 30, 71 Search PubMed.
- X. Xu, J. Liang, H. Zhou, S. Ding and D. Yu, RSC Adv., 2014, 4, 3181 RSC.
- S. Chen, J. Zhu, X. Wu, Q. Han and X. Wang, ACS Nano, 2010, 4, 2822 CrossRef CAS PubMed.
- X. Xu, H. Zhou, S. Ding, J. Li, B. Li and D. Yu, J. Power Sources, 2014, 267, 641 CrossRef CAS PubMed.
- G. D. Sulka, V. Moshchalkov, G. Borghs and J. P. Celis, J. Appl. Electrochem., 2007, 37, 789 CrossRef CAS.
- J. Chen, N. Xia, T. Zhou, S. Tan, F. Jiang and D. Yuan, Int. J. Electrochem. Sci., 2009, 4, 1063 CAS.
- P. Kurzweil, The 14th International Seminar On Double Layer Capacitors, Deerfield Beach, FL, U.S.A., 2004 Search PubMed.
- S. K. Meher, P. Justin and G. R. Rao, Nanoscale, 2011, 3, 683 RSC.
- Q. Cheng, J. Tang, J. Ma, H. Zhang, N. Shinya and L. C. Qin, Phys. Chem. Chem. Phys., 2011, 13, 17615 RSC.
Footnote |
| † Electronic supplementary information (ESI) available: SEM & AFM image of material coated on nickel substrate. See DOI: 10.1039/c4ra05054a |
| This journal is © The Royal Society of Chemistry 2014 |

